Extension of exposures and the parallelogram method are the two ways to bring historical premium to current rate level, or "on-level" it, before a rate indication. Extension of exposures re-rates every policy under today's rates and adds them up; the parallelogram method multiplies aggregate premium by an average factor built from the dates and sizes of past rate changes, assuming policies were written evenly through the year. The first is exact wherever the data exists; the second is an approximation that breaks by class when relativities have changed. The difference matters beyond the indication: re-rating each policy is also how a pricing team sees the distribution of a proposed change, and Botminds' Rate Dislocation Analysis uses exactly that, re-rating every in-force policy under the proposed plan to show who pays how much more before the filing goes in.
The worked figures for the two methods are the Casualty Actuarial Society's own example from Werner and Modlin's Basic Ratemaking; the re-rate of a whole book uses a fictional sample carrier's Texas homeowners program as it runs through the solution.
In the past, extension of exposures was practically impossible due to the significant number of calculations required to rerate each policy.
Werner and Modlin, Basic Ratemaking, Casualty Actuarial Society (2016)
Extension of exposures vs parallelogram: which to use
Use extension of exposures whenever you have each policy's rating characteristics; use the parallelogram method when you do not, and only for an overall figure. The CAS text calls extension of exposures "the most accurate current rate level method", and the parallelogram method "less accurate". The computing objection is gone; the text itself says "the only remaining hurdle is associated with gathering the required data."
The parallelogram method survives because it needs almost nothing: the effective dates and overall percentages of past rate changes, and the assumption that premium was written evenly. For a quick overall indication in a line whose changes were applied uniformly, that can be enough. For personal lines, where territory, roof age, deductible and credit-based relativities move in most filings, it is not: Werner and Modlin record that its class-level weakness "has forced many companies to abandon this approach in favor of the extension of exposures approach", "especially" in lines "like personal lines automobile and homeowners".
What is the extension of exposures method?
Extension of exposures restates each historical policy's premium at the rates in force today, using that policy's own rating characteristics, then sums the results. In the CAS example, a policy effective 1 March 2011 with ten class Y exposures was charged $7,370 (10 × $1,045 × 0.60 + $1,100 fee). Substituting today's class factor and fee gives $8,405 (10 × $1,045 × 0.70 + $1,090). Done for every policy, the total is the historical year's premium at current rate level, exactly, whatever the mix of classes.
The same machinery runs forward. Re-rate today's in-force book under a proposed plan instead of history under the current one, and the output is no longer an on-level premium but the distribution of proposed changes: dislocation. That is why the agent at the heart of Rate Dislocation Analysis is a re-rater, and why the steps below look like an extension of exposures done with more care about what changed since the extract.
The book re-rater's steps, from in-force extract to each policy's change
Agent
Load the in-force extractEvery policy with its rating characteristics and current premium, as of a dated extract. Sample: 186,420 Texas homeowners policies at 30 September 2026.
Agent
Apply mid-term endorsementsUses the endorsed premium and characteristics for any policy changed after the extract, so a coverage change is not mistaken for a rate change.
Never: changes a policy record
Agent
Rate under the proposed planApplies base rate, relativities, fees and rules in the plan's order of calculation, scenario by scenario, each run saved with its plan version and extract date.
Agent
Attribute the changeSplits each policy's change into one step per rating factor, in rating order, so the steps add up to the proposed premium exactly.
A person decides
Pricing actuary checks the runReproduces sample policies by hand against the manual and accepts or rejects the run before any figure leaves it.
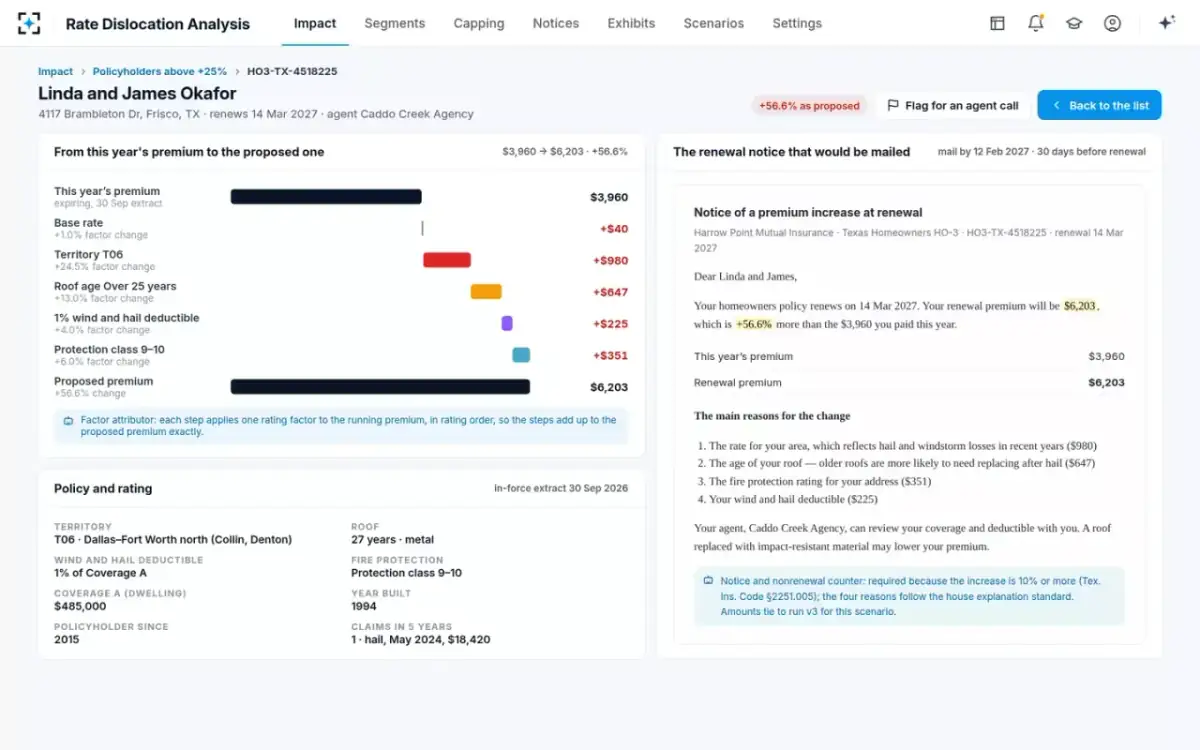
The attribution step is what makes a re-rate useful to people other than the actuary. On the sample book one policy goes from $3,960 to $6,203. Applied in rating order, the base rate adds $40, territory $980, a 27-year roof $647, the 1% wind and hail deductible $225 and protection class 9–10 $351. Each step multiplies the running premium, so the dollar amounts depend on the order; the solution follows the manual's order so that the steps reconcile to the proposed premium to the dollar.
One policy re-rated: the steps add up to the proposed premium
The parallelogram method on level premium, worked for one calendar year
The parallelogram method replaces a year's average rate level with today's, using geometry instead of policies. In the CAS example there were three rate changes, each applied to annual policies written on or after its date: +5% on 1 July 2010, +10% on 1 January 2011 and −1% on 1 April 2012. Drawn on a grid of written date against earned time, each change is a diagonal line, and the share of calendar year 2011's earned premium written at each rate level is an area.
Calendar year 2011 premium put on-level with the parallelogram method
| Step | Calculation | Result |
|---|---|---|
| 1. Rate level groups | Initial; +5% from 1 Jul 2010; +10% from 1 Jan 2011; −1% from 1 Apr 2012 | Four groups |
| 2. Share of CY2011 earned premium in each group | Triangle ½ × ½ × ½ for group 1; group 3 = ½ × 1 × 1; group 2 the remainder | 0.125 · 0.375 · 0.500 |
| 3. Cumulative rate level index | 1.00; 1.00 × 1.05; 1.05 × 1.10; 1.155 × 0.99 | 1.0000 · 1.0500 · 1.1550 · 1.1435 |
| 4. Average index for CY2011 | 1.000 × 0.125 + 1.0500 × 0.375 + 1.1550 × 0.500 | 1.0963 |
| 5. On-level factor | Current index ÷ average index = 1.1435 ÷ 1.0963 | 1.0431 |
| 6. Premium at current rate level | CY2011 earned premium × 1.0431 | +4.31% |
The method needs only the overall percentage of each change, which is its appeal and its limit. CAS's own footnote to the example notes that a 5.6% rise in the rate per exposure produced an overall average change of 5.0%, because the overall figure also depends on exposures per policy, class factors and the fee. The parallelogram method takes the 5.0% as given; it never sees the policies that produced it.
Where calendar year 2011's earned premium was written: three rate levels
Where the parallelogram method breaks, and why personal lines left it
The parallelogram method fails in two ways the CAS text names, and in a third that matters for implementation. The first is timing: the method "assumes that premium is written evenly throughout the time period". Boat owners policies, the text notes, are mostly bought in the first half of the year; splitting the calculation into quarters or months reduces the error, and aggregating policies by the rate level actually applied removes it.
The second is the class problem: "while the overall premium may be adjusted to an approximated current rate level, the premium for certain classes will not be on-level if the implemented rate changes varied by class." If the last filing raised one territory 20% and cut another 10%, an average factor on-levels the total and mis-states both territories, which is exactly the input a territorial review needs. The CAS text allows the parallelogram method at class level "if data limitations preclude use of extension of exposures", which is a fallback, not a choice.
The third is that implemented premium is not always manual premium. A transition rule in force means some policies are still paying less than the manual says, and mid-term endorsements change premium for reasons that have nothing to do with rates. An average factor cannot separate either. A policy-level re-rate can, provided it starts from the right premium and the right characteristics.
Two on-level methods, row by row
Parallelogram method: Multiplies aggregate earned premium by an on-level factor built from past overall rate changes.
Extension of exposures: Re-rates each historical policy under current rates and sums the results.
Parallelogram method: Effective dates and overall percentages of past changes; earned premium by period.
Extension of exposures: Each policy's rating characteristics and the current manual.
Parallelogram method: Approximate; depends on even writing through the year.
Extension of exposures: Exact, to the quality of the policy data.
Parallelogram method: Wrong for any class whose past changes differed from the average.
Extension of exposures: Exact for every class and every cell.
Parallelogram method: Not visible.
Extension of exposures: Visible if the extract carries endorsements and the capped premium.
Parallelogram method: None: it produces one number.
Extension of exposures: The same engine, run forward on the in-force book under the proposed plan.
What on level premium and on level earned premium mean
On-level premium is historical premium restated at the rates in force today; on-level earned premium is the same restatement applied to a year's earned premium, which is the denominator of the loss ratio in an indication. The adjustment exists because, in the CAS text's words, "the policies underlying the experience period may have been written using rates that are no longer in effect". It is distinct from premium trend, which adjusts for changes in the mix and amount of insurance rather than in rates, and from premium development for audits or incomplete years.
The NAIC's handbook for rate reviewers lists on-level premium first among the common premium adjustments a regulator will look for in an indication, ahead of audit and trend (NAIC Product Filing Review Handbook, 2024). A reviewer who sees an on-level factor applied to a whole state's premium in a filing that revised territorial relativities will ask how the territories were on-leveled.
From on-leveling to dislocation: the same re-rate, pointed forward
On-leveling re-rates history under current rates; dislocation analysis re-rates the current book under proposed rates. Both are extension of exposures, and the second is now requested by regulators in so many words: the NAIC's predictive-model white paper asks reviewers to obtain a distribution of impacts on renewal business produced by re-rating the current book (NAIC, Regulatory Review of Predictive Models).
The forward re-rate also does a calculation the parallelogram mind-set approximates: the off-balance. When relativities change, the base rate must move to keep the overall change where it was selected, and the CAS text says "an exact calculation of ΔS can be made using the extension of exposures method", where ΔS is the change in the average rate differential. With the whole book re-rated, the off-balance is measured rather than estimated from the product of average changes. The arithmetic of the off-balance, and of capping one variable, is worked in a rate change calculator for insurance.
On the sample Texas book, the forward re-rate with every factor at its full indication gives +11.9% overall and a long tail: 23,802 policyholders above +25%. Moving the territory factor to 60% of its indication and re-rating again gives +8.6% and 9,165. The two runs are seconds apart; by workbook they would be a day apart.
The whole book re-rated again with territory at 60% of its indication
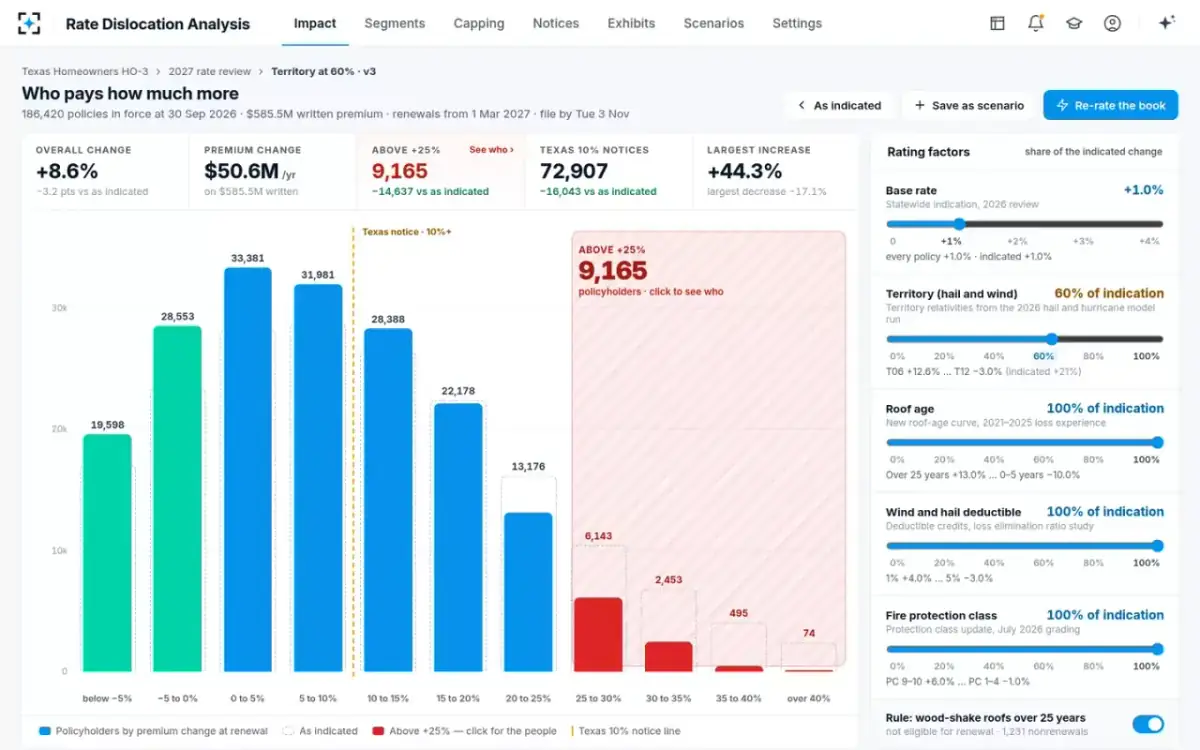
What can go wrong when you re-rate the whole book
A policy-level re-rate is only as accurate as the extract and the manual it reads. Most errors come from four places, and each can be tested before a number leaves the run.
The first is the extract date. On the sample review, a workbook built from an extract of 31 August counted 71,233 Texas notices; the run, built from 30 September with endorsements applied, counted 72,907. The 1,674 difference was policies endorsed after the earlier extract and rated on their old premium. The second is the order of calculation: a manual that applies a minimum premium or a fee before or after a factor gives a different answer, and the regulator's predictive-model white paper says that for the rating plan "the rate order of calculation rule may be sufficient" to validate a premium. The third is rules that are not factors: eligibility rules, minimum premiums, and any transition rule still in force. The fourth is the capped premium itself, discussed in Washington's rule on rate stability rules, which requires the next filing to account for the rule's effect on the indicated rate level (WAC 284-24-130(11)).
Six checks before trusting a re-rated book
- Count and premium tie to the extract
Policies in force and written premium in the run equal the source system on the extract date.
- Hand-rate a sample of policies
Pick policies from every territory and the extremes of the distribution, and rate them from the manual by hand.
- Endorsements after the extract are applied
Or the extract is refreshed; otherwise coverage changes look like rate changes.
- The order of calculation matches the manual
Fees, minimums and rules applied where the manual applies them.
- Capped premiums are recognised
Policies still under a transition rule start from what they pay, and the rule's end date is known.
- Every run is saved with its versions
Rate plan, extract date and model versions, so any figure in the filing can be reproduced.
When the parallelogram method is still the right tool
The parallelogram method still earns its place where policy data does not exist or is not worth assembling. A small program with few rating variables, an acquired book whose history arrives as aggregate premium, or a quick check on an overall indication are all reasonable uses, provided the rate changes being reversed were close to uniform. Where they were not, approximations pile up. Discussing a related approximation, of the off-balance for a rating algorithm with both multiplicative and additive parts, the CAS text concludes that the effort to improve it "would be better spent compiling data to undertake the extension of exposures technique".
For dislocation there is no such choice. A distribution of changes by policy cannot be approximated from an average; it exists only if every policy is re-rated. That is the method Botminds built into Rate Dislocation Analysis, and what the re-rate is then used for is set out in dislocation analysis in insurance.
Questions people ask
What is the extension of exposures method in simple terms?
It is re-rating every policy in a historical period at today's rates and adding up the results, so the total shows what that period's business would cost now. The CAS text calls it the most accurate current rate level method, limited only by whether the policy-level data is available. Personal lines carriers generally have the data, because they rate each policy from its characteristics.
Why is it called the parallelogram method?
Because the calculation is drawn as geometry: each rate change is a diagonal line across a grid of policy-writing date against time earned, and the shares of a year's premium at each rate level are triangles, trapezoids and parallelograms. It is also called the geometric method. The areas assume premium was written evenly through the year.
Can the parallelogram method be used by class?
Yes, if the rate changes are known by class and the data for extension of exposures is missing. Werner and Modlin describe class-level parallelogram as acceptable when data limitations preclude extension of exposures. It still assumes even writing within each class.
What is on-leveling premium?
On-leveling is restating premium at current rates so it can be compared with projected losses in an indication. The CAS example shows why: with rates at $210 after a past increase and a true need of $220, forgetting the increase produces a 10% indication instead of 4.8%. On-leveling is separate from premium trend and premium development.
How long does it take to re-rate a whole book?
With the data assembled, seconds to minutes; the CAS text notes the computing hurdle has gone and the data hurdle remains. On a fictional sample of 186,420 homeowners policies, Rate Dislocation Analysis re-rated the book in 3.1 seconds per scenario. The time that remains is in checking the extract and hand-rating sample policies.