Dislocation analysis in insurance is the count of existing policyholders who will receive each size of premium change under a proposed rate change, usually shown as a histogram of renewal changes by band, by segment and by rating variable. Its purpose, in the Casualty Actuarial Society's words, "is to quantify the number of existing customers that will receive specific amounts of rate change." It matters because a filing is described by its overall average, while customers, agents and regulators meet the individual changes, and an average of +10% can hide a fifth of the book getting a decrease and a tenth getting more than +25%. Botminds' Rate Dislocation Analysis builds that histogram from a re-rate of every policy in force, opens the tail to the policyholders in it with the rating factor behind each increase, and lets the pricing team design a cap and count the notices from the same run.
The national figures below are from the U.S. Treasury's Federal Insurance Office and the NAIC. The worked histogram comes from a fictional sample carrier, Harrow Point Mutual, and its Texas homeowners program of 186,420 policies as it runs through the solution.
The national average hid a spread of more than sixteen points
+8.7%
average homeowners premium per policy above inflation, 2018–2022, nationwide
+14.7%
at least this much above inflation in the top fifth of ZIP Codes
−1.4%
at least this much below inflation in the bottom fifth of ZIP Codes
What is dislocation in insurance?
Dislocation in insurance is the movement in individual policyholders' premiums caused by a rate or rule change, as opposed to the average movement of the book. Regulators use "disruption" and "dislocation" side by side: the NAIC's white paper on predictive models asks rate reviewers to obtain a rate disruption or dislocation analysis (NAIC, Regulatory Review of Predictive Models). Outside pricing the word has other meanings, such as a dislocation injury claim or market dislocation; in ratemaking it means the spread of premium changes.
The CAS ratemaking text explains why carriers measure it: "the amount of any rate change can be a major influence on whether or not an existing insured decides to renew the policy." Companies, it says, "typically have a threshold defining the magnitude and dispersion of rate changes that the company believes will produce an unacceptable effect on retention (in total or by customer segment)", and if the dislocation analysis shows effects outside that tolerance, "the company may revise the proposed rate change" (CAS, Basic Ratemaking).
Why the average hides the policyholders a rate change hurts most
An average hides the tail whenever relativities change. The CAS text draws the line exactly: a change to the base rate alone moves every policy by nearly the same percentage, while a change to the relativities moves different insureds and classes by very different amounts, because each policy carries its own combination of factors and the changes multiply (revenue neutral rate changes quotes the passage).
The sample book shows how far. With every rating factor at its full indication, the Texas homeowners program moves +11.9% overall, $69.6 million on $585.5 million of written premium. That single figure describes almost nobody. More than one policyholder in five gets a decrease; one in eight gets more than +25%; the largest increase is +56.6% and the largest decrease −20.0%.
The same book, three ways: as indicated, with territory at 60%, and capped at +25%
| Scenario | Decrease | 0 to 10% | 10 to 25% | Above 25% |
|---|---|---|---|---|
| As indicated: +11.9% overall | 21.7% | 30.5% | 35.0% | 12.8% |
| Territory at 60% of its indication: +8.6% | 25.8% | 35.1% | 34.2% | 4.9% |
| Territory at 60%, capped at +25%: +8.4% in year one | 25.8% | 35.1% | 39.1% | 0% |
Read top to bottom, the figure is a pricing decision. Taking territory at 60% of its indication cuts the share above +25% from 12.8% to 4.9% at a cost of 3.3 points of overall change, with the balance deferred to the next review. The cap then moves the last 4.9% into the band below, at a cost of $1.51 million in the first year. None of this is visible in the averages, which go from +11.9% to +8.6% to +8.4%.
The histogram the average hides, with the tail shaded
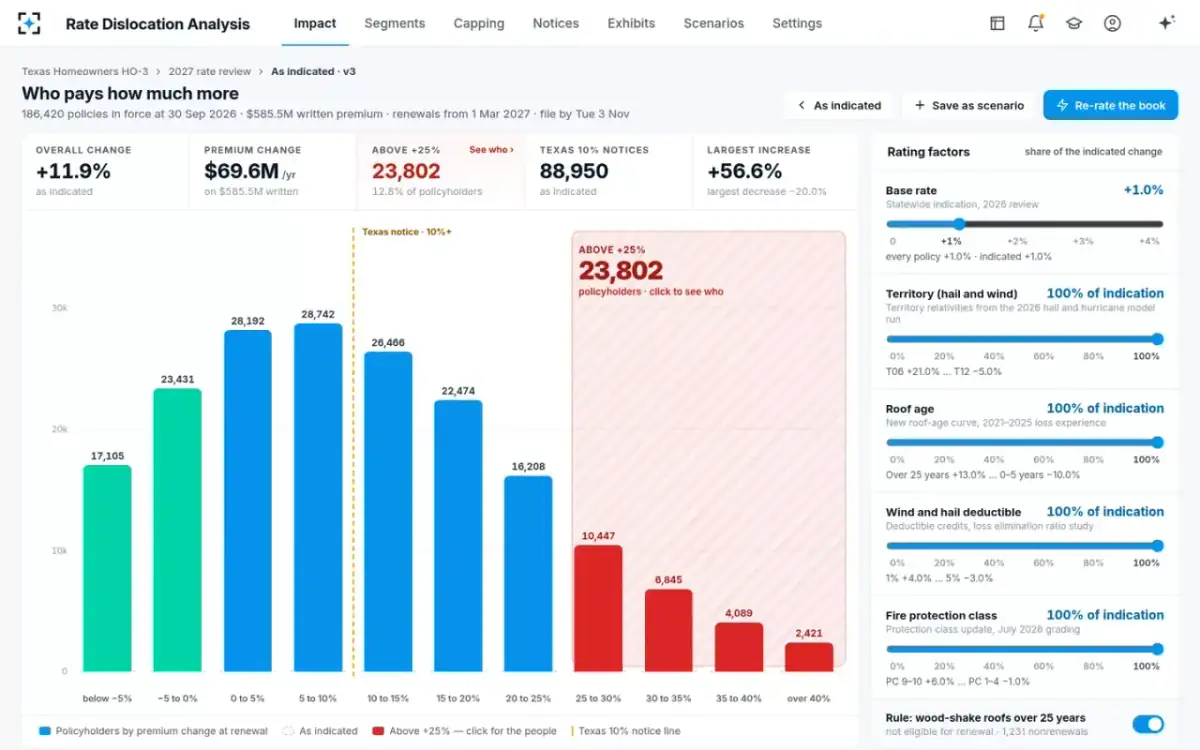
Reading a dislocation histogram: five things to look at
A dislocation histogram answers five questions, in order. Where is the mass? On the sample book, 44.7% of policies fall between 0% and +15%. Where are the tails, and how long? Here the increase tail runs to +56.6% and the decrease tail to −20%. Where do the state's legal thresholds fall? In Texas, a residential renewal increase of 10% or more over the lesser of the prior 12 months' premium or the prior term's needs a notice at least 30 days ahead, so every bar from +10% upward is a mailing (Tex. Ins. Code §2251.005); as indicated that is 88,950 notices. Where does the company's own tolerance line sit? The sample uses +25%, a setting between +15% and +40%. And how does the shape change with each scenario?
The last question is the one that makes a histogram a decision tool. Comparing a scenario's bars with a ghost outline of the indicated shape shows which bands empty and which fill, which no pair of averages can do. It also exposes a side effect: moving territory to 60% of its indication increases the number of policyholders with decreases, from 40,536 to 48,151, because policies whose increase came mainly from territory lose most of it, and the other factors, such as the new roof-age curve's −10% for roofs under six years, now outweigh what is left. Whether to cap decreases too is one of the questions regulators ask, taken up in the rate change calculator guide.
Who is in the tail, and why: attributing each increase
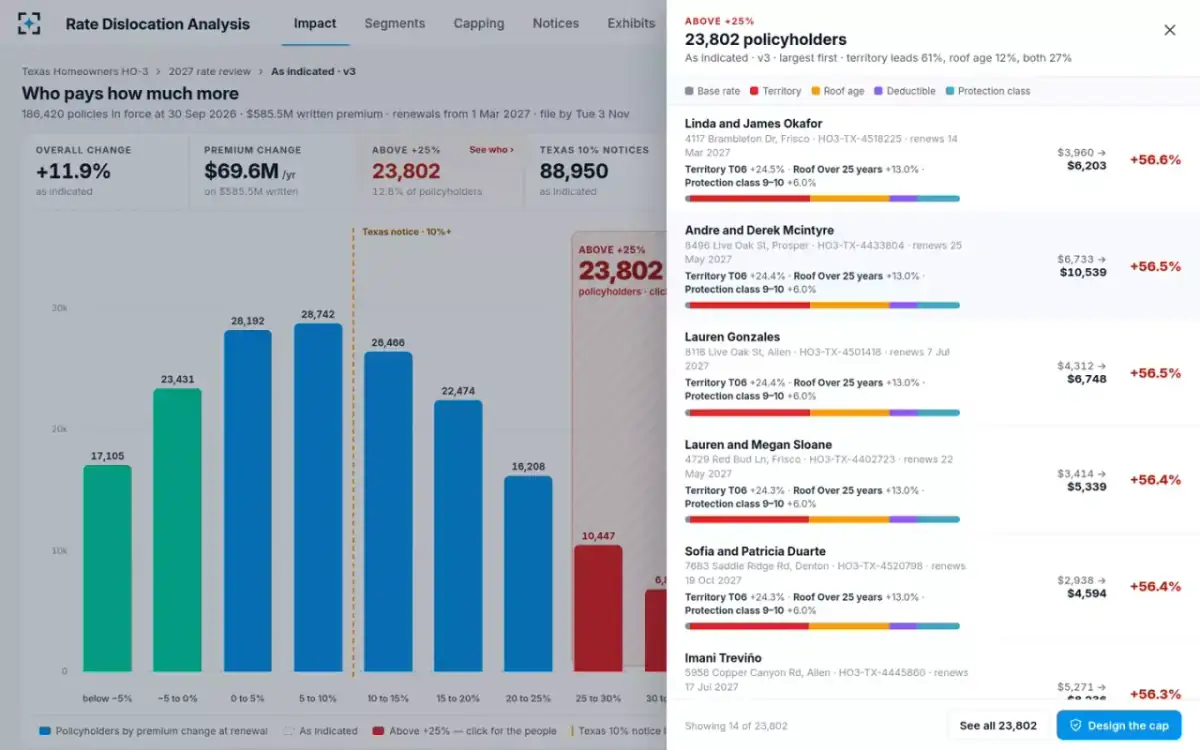
The tail is only actionable once each policy's increase is split into the rating factors that caused it. On the sample book, territory is the largest factor for 61% of the 23,802 policyholders above +25%, roof age for 12%, and the two together for 27%; more than half the tail is in one territory, T06, Dallas–Fort Worth north. That tells the pricing team the tail is mostly one variable's doing, and points to the scenario worth testing first.
At the level of one policy, attribution turns a percentage into a conversation. One Frisco homeowner goes from $3,960 to $6,203: the base rate adds $40, territory $980, a 27-year roof $647, the 1% wind and hail deductible $225, and protection class 9–10 $351. The NAIC asks for this too: its element C.7.a asks for "the top five rating variables that contribute the most to large swings in renewal premium, both as increases and decreases", and C.7.d for enough information to explain the change to each consumer (the element is quoted in full in the GLM pricing model guide).
The tail opened: largest increase first, each split by factor
Where the tail lives: dislocation by segment
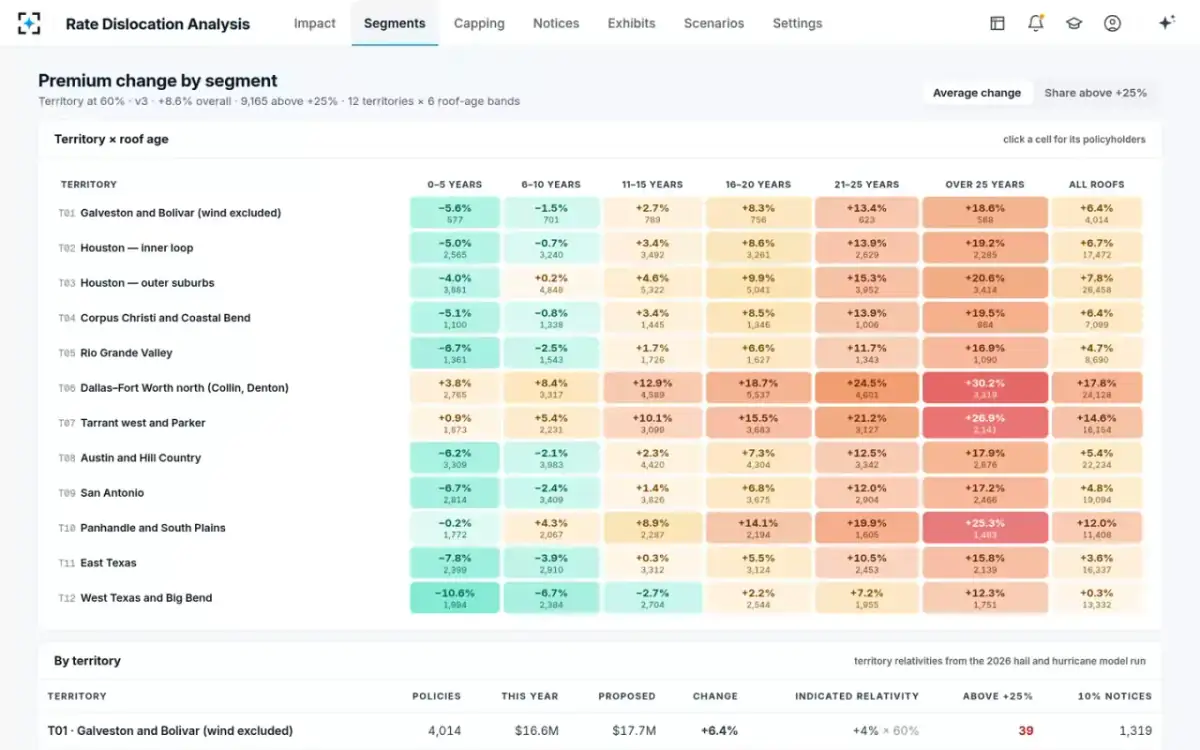
A segment view crosses the variables that drive the tail, so the pricing team and the product manager can see whether a problem is one cell or a whole column. The sample's heatmap crosses 12 territories with six roof-age bands. With territory at 60% of its indication, the hottest cell is Dallas–Fort Worth north with roofs over 25 years, averaging +30.2% across 3,319 policies; Tarrant west and Parker with old roofs averages +26.9%. The coolest is West Texas and Big Bend with roofs under six years, at −10.6%.
The segment view changes who acts. A tail that sits in one territory and one roof band is a territory selection question for the actuary and a roof eligibility question for the product manager, who also knows which agents will take the calls. The CAS text recommends sharing expected dislocation "with the sales channel and customer support units (e.g., call centers) in advance of the implementation", which is far easier when the tail has names, places and reasons.
Territory by roof age: the average change in every cell
Designing the cap from the histogram, not after it
A cap designed after the rate is set protects people nobody has looked at. Designed from the histogram, it is one more scenario: how many policies does it catch, what does it forgo, how long until each reaches its filed premium, and does it pass the state's standards? The sample team compared three scenarios side by side before choosing.
Three scenarios for the same Texas filing
| Scenario | Year-one overall | Above +25% before any cap | Capped | Premium foregone | Texas 10% notices | Largest |
|---|---|---|---|---|---|---|
| A. As indicated | +11.9% | 23,802 | — | — | 88,950 | +56.6% |
| B. Territory at 60% | +8.6% | 9,165 | — | — | 72,907 | +44.3% |
| C. Territory at 60%, capped at +25% | +8.4% | 9,165 | 9,165 | $1.51M | 72,907 | +25.0% |
The cap's last column is the point of the exercise: nobody above +25% in the first year, at a cost of 0.26% of written premium. The notice column is a reminder that the cap does not make the change invisible. Every policy at +10% or more still needs its Texas notice, and the count belongs in the same run; how it is made is in rate increase notices in California and other states.
Policyholder impact analysis: from the histogram to the people who answer the phone
A policyholder impact analysis is the dislocation analysis turned outward: who will notice, what will they ask, and who will answer. On the sample program it produces four things beyond the histogram. A list of the policyholders above the tail line, largest first, that the product manager can flag for an agent call before the notice is mailed. A segment map that tells the agency force where the calls will come from. A draft notice per policy with up to four reasons in dollars. And a count of nonrenewals under any eligibility rule change, 1,231 on the sample for wood-shake roofs over 25 years.
What changes when dislocation is seen before filing rather than at renewal
Found at renewal: Agents and policyholders, when the renewal arrives.
Seen before filing: The pricing team, on the histogram, weeks before.
Found at renewal: Designed after the rate, without seeing who it protects.
Seen before filing: Priced against the tail it is meant to catch.
Found at renewal: Assembled policy by policy when someone calls.
Seen before filing: Drafted for every policy from the factor attribution.
Found at renewal: Answered with a new extract and a new workbook.
Seen before filing: Answered from the run behind the filing.
Distribution of rate changes by state: what the public data does and does not show
No public source publishes the distribution of renewal changes inside a carrier's book; that is in the carrier's filing exhibits. What public data does show is that averages hide wide spreads at every level. Nationally, the Federal Insurance Office found premiums per policy rose 8.7% faster than inflation from 2018 to 2022, but at least 14.7% faster in the top fifth of ZIP Codes, while in the bottom fifth they fell at least 1.4% relative to inflation (FIO, January 2025). The NAIC's report on Market Conduct Annual Statement data found that, adjusted for inflation, average direct written premium has risen since 2018 by between 18% and 43% depending on the part of the country (NAIC, homeowners market dynamics report).
Inside a filing, the regulator asks for the distribution directly. The NAIC white paper's element C.7.d asks for the distribution of percentage and dollar impacts on renewal business, produced by re-rating the current book, and its comment adds that the analysis should show the largest dollar and percentage impacts of the filing. A sample template for the exhibit, and a way to test any tool against it, is in the rate change impact analysis template guide.
The histogram on this page is the core of Rate Dislocation Analysis; the guide to why "revenue neutral" filings still produce long tails is revenue neutral rate changes.
Questions people ask
What does dislocation mean in insurance pricing?
It means the change in individual policyholders' premiums caused by a rate or rule change, as distinct from the overall average. A dislocation analysis counts how many existing customers receive each size of change. Regulators also call it rate disruption or policyholder impact.
What threshold do insurers use for dislocation?
Each carrier sets its own; the CAS ratemaking text describes companies setting a threshold for the magnitude and dispersion of changes they consider acceptable for retention. Legal thresholds sit alongside it, such as Texas's 10% notice rule for residential property and California's 7% hearing trigger for personal lines rate applications. The sample program in this guide uses a +25% tail line.
Is there dislocation in a 0% overall rate change?
Yes, whenever relativities change. The CAS text notes that only a simple base rate change moves everyone nearly equally; a change in relativities moves different insureds by different amounts even when the overall change is zero. That is why a revenue neutral filing still needs a dislocation analysis.
What is included in a policyholder impact analysis?
A distribution of premium changes on renewal business, uncapped and capped; the largest percentage and dollar increases with the attributes that drove them; the same distribution by key segment and by each rating variable that changed; and the counts of notices and nonrenewals the change triggers. The NAIC white paper's element C.7.a adds the top five variables behind the largest swings, up and down.
How often should a dislocation analysis be run?
For every scenario considered, not only the one filed. The CAS text describes companies revising a proposed change when dislocation falls outside tolerance, which means comparing scenarios. When a re-rate takes seconds, as on the 186,420-policy sample book, the limit is the number of questions the team thinks to ask.