A portfolio monitoring dashboard is the screen a private equity sponsor uses to see all its portfolio companies at once: revenue, EBITDA, cash and the covenant metric for each, against budget, prior periods and the facility agreement's limits, with alerts for the companies that crossed a line. Most dashboards are good at drawing the lines and poor at the next question, which is always "where does this number come from?". A red tile that cannot show the page, the reading and the person behind it sends the operating partner back to the analyst, and the time the dashboard saved is spent again. Botminds' Private Equity Portfolio Monitoring draws one strip per company, and every point on every strip opens the page of the company's report it came from.
The screens and figures below come from the solution's sample data: Quillfield Capital, a fictional sponsor with 120 portfolio companies, on Monday, October 19, 2026, day 19 of its third-quarter close.
One Monday morning on the sample dashboard
10
companies needing attention, out of 120; the rest wait
11
open alerts: 3 covenant, 5 variance, 2 restatement, 1 liquidity
8
quarters on every strip, Q4 2024 to Q3 2026, each point linked to its page
104 of 120
third-quarter reports read by day 19; seven late, nine not yet due
What is a portfolio monitoring dashboard?
A portfolio monitoring dashboard is a single view of every portfolio company's key figures and their status against the lines that matter: budget, prior year, and the covenants in each facility agreement. Its purpose is triage. Out of a portfolio of dozens or hundreds of companies, it should tell an operating partner which few need them this week, and why.
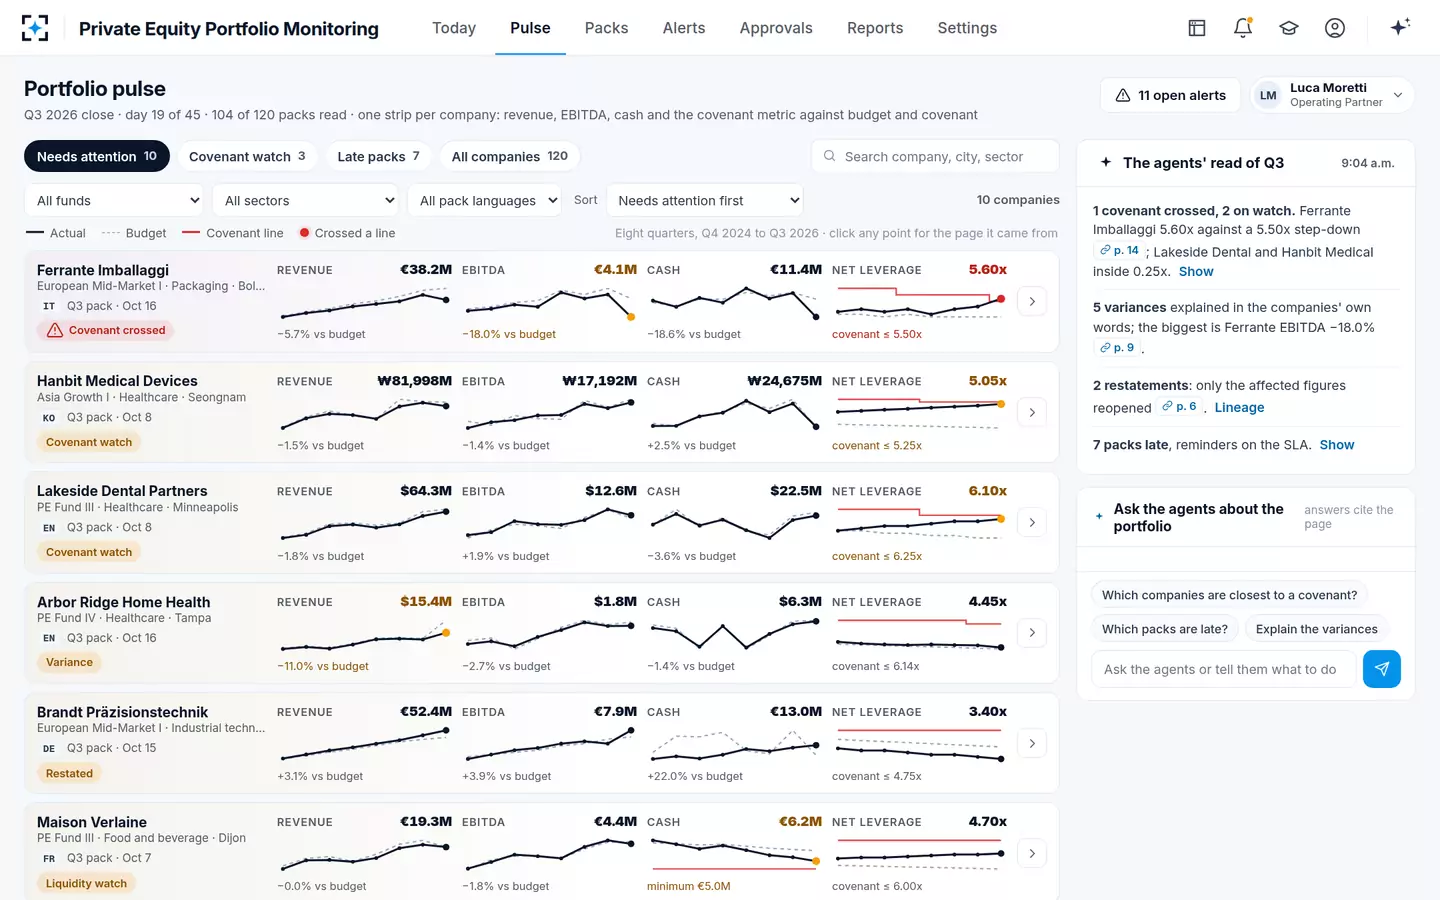
That purpose sets the design. A dashboard that shows every KPI for every company with equal weight is a database screen; one that sorts companies by how close they are to a line, and says which line, is a monitoring tool. In the sample, the default view is "needs attention first": ten companies of 120, starting with the one whose covenant has crossed.
One strip per company in Private Equity Portfolio Monitoring, sorted by what needs attention
What should a private equity portfolio dashboard show?
A private equity portfolio dashboard should show, for each company, four series over enough quarters to see a trend (revenue, EBITDA, cash and the covenant metric), each against its budget and, for the covenant metric, the limit in force on each test date. It should also show the state of the current quarter's reporting: received, read, approved or late.
The covenant line deserves care, because it moves. A leverage covenant that steps down from 5.75x to 5.50x at a test date makes a company that has not changed look worse, and a dashboard that draws only today's limit hides the step. Ferrante's strip draws the stepped line, which is why its crossing is visible as the line coming down to meet a ratio that had barely moved. The covenant metric should also be computed on the agreement's definitions, not from the income statement: Dichev and Skinner, measuring covenant slack directly in a large sample of private loan agreements, found the leverage ratios commonly computed from reported accounts to be a noisy guide to how close a borrower actually is to its covenants (Journal of Accounting Research, 2002).
A springing covenant adds a series. Where a company's maintenance covenant applies only when its revolving facility is drawn above a threshold, the dashboard should show revolver use against that threshold too. In a Philadelphia Fed study of leveraged loans, the median threshold was 17.5%, and 40% of the sampled deals had a threshold of zero, so a covenant can go live with a modest drawing (Berlin, Nini and Yu, Philadelphia Fed Working Paper 19-41).
A tile is a claim: what one click should open
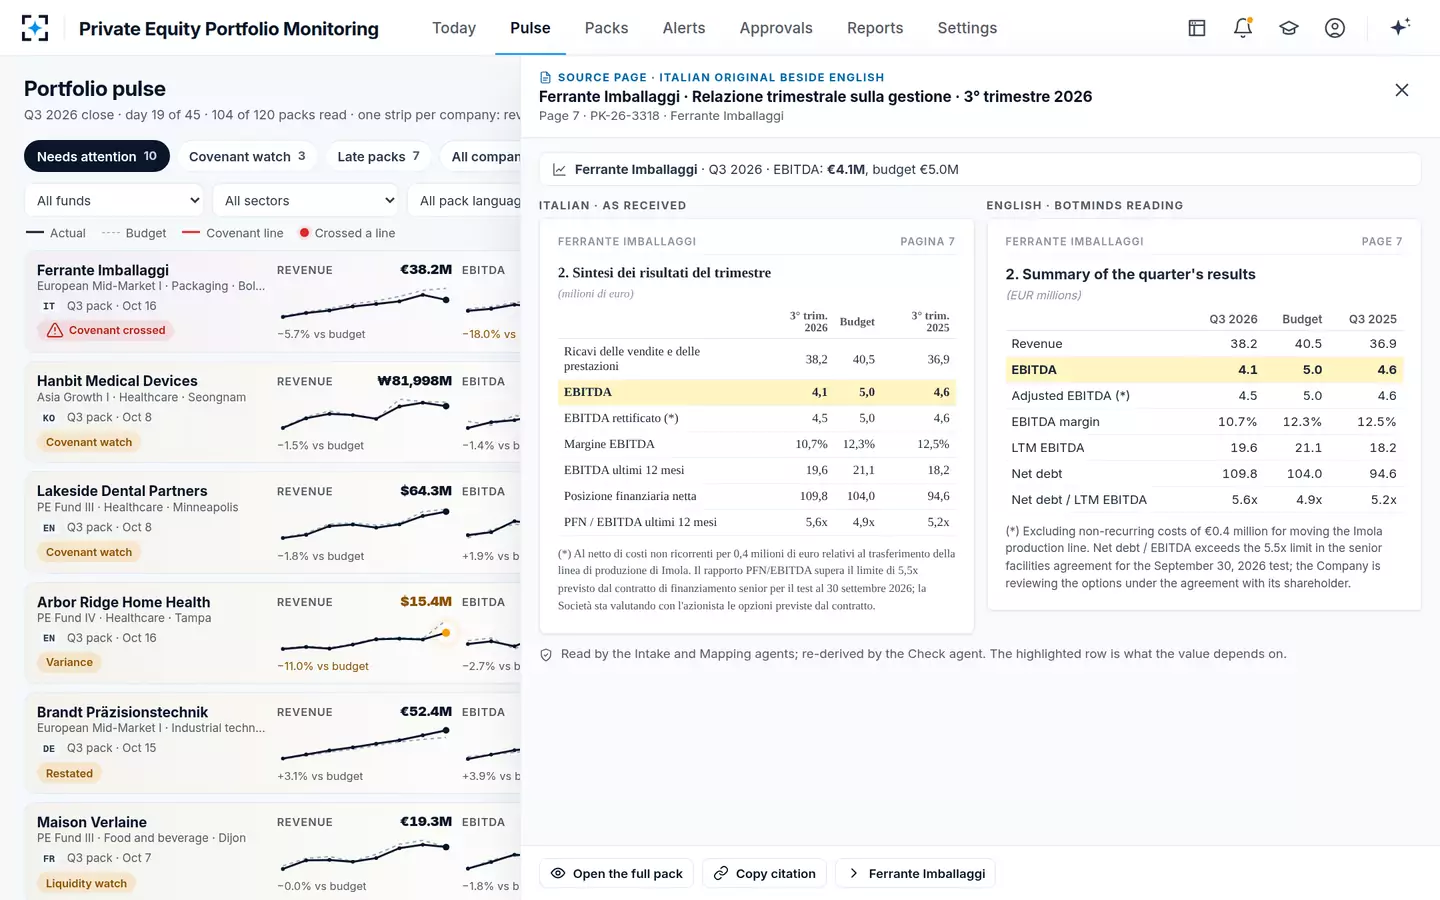
Every number on a dashboard is someone's claim about a company. One click on it should open the evidence: the page of the company's report it came from, in the original language, with the line highlighted; the second reading that confirmed it; and the person who approved it. If the click opens a spreadsheet cell, the claim is the analyst's memory.
Two dashboards showing the same red tile
A tile without a source: EBITDA €4.1M, red, 18% under budget.
A tile that opens its page: The same, plus page 7 of the Italian report, the highlighted row, and "re-derived by the Check agent".
A tile without a source: "Is that reported or adjusted?" An email to the analyst.
A tile that opens its page: Answered on the page: reported €4.1M; adjusted €4.5M on the next line, with its footnote.
A tile without a source: "Why?" Another email, or a call to the company.
A tile that opens its page: Drivers from page 9 in the company's words: resin, volumes, energy.
A tile without a source: Wait for answers, then decide.
A tile that opens its page: Confirm the alert, approve the drafted question to the CFO, escalate to the deal partner.
A tile without a source: Days, depending on the analyst's queue.
A tile that opens its page: One sitting, in the sample: alert confirmed and escalated the morning after the weekend.
One click on a point in Private Equity Portfolio Monitoring opens the company's page beside the English reading
What alerts should a portfolio monitoring system raise?
A portfolio monitoring system should raise alerts for covenant crossings, covenants within a watch band, liquidity near a minimum, variances from budget beyond a set tolerance, restatements of approved figures, and late reporting, each with a named person who must decide it. The thresholds are policy, not technology: they should be set by the firm, approved by compliance and changed only with an approval on the trail.
Six alerts, the threshold behind each, and who decides
| Alert | Threshold in the sample | Example on October 19 | Decided by |
|---|---|---|---|
| Covenant crossed | A covenant result on the wrong side of its limit, on the agreement's definitions | Ferrante: net leverage 5.60x against 5.50x | Operating partner confirms; deal partner owns the lender |
| Covenant watch | Headroom under 0.25x of leverage (5 points of loan to value; 0.10x of debt service cover) | Hanbit Medical: 5.05x against 5.25x; Lakeside Dental: 6.10x against 6.25x | Operating partner; deal partner told |
| Liquidity watch | Cash under 125% of a minimum liquidity covenant | Maison Verlaine: €6.2M, 124% of a €5.0M minimum | Operating partner |
| Variance | Revenue or EBITDA more than 10% from budget; margin more than 2 points | Arbor Ridge: revenue 11.0% below budget; Wisła: EBITDA 13.0% below | Operating partner, with the company's stated drivers |
| Restatement | Any change over 1% to an already approved figure | Brandt: Q2 EBITDA €7.6M restated to €7.3M | Operating partner and Head of Valuation |
| Late reporting | Reminder on day 1; operating partner copied day 5; deal partner day 10 | Seven companies late on day 19 | Analyst; escalates on the clock |
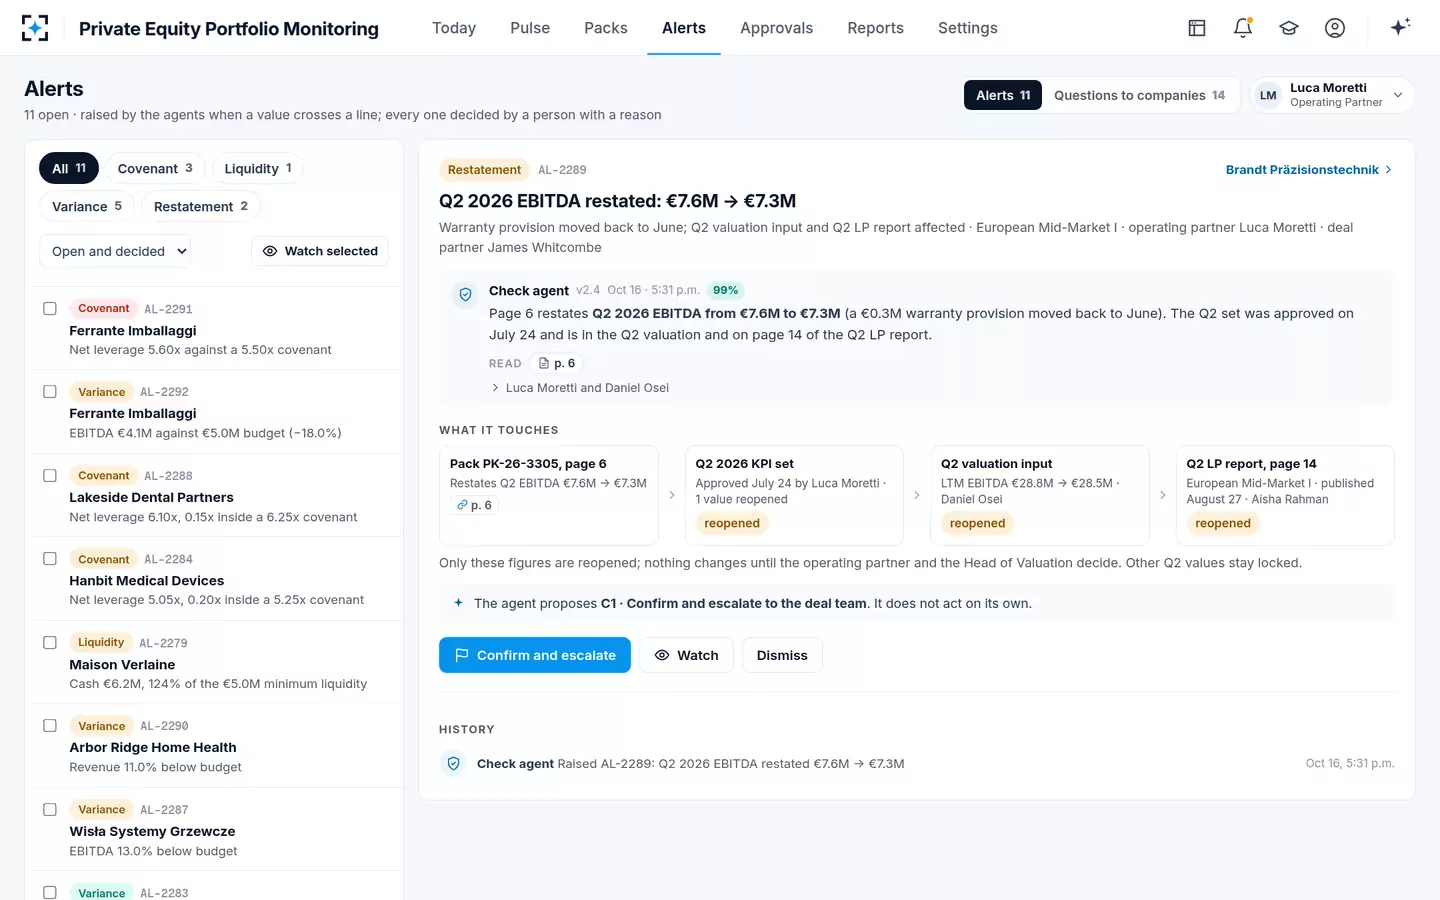
Two design rules keep alerts useful. Every alert should carry its evidence and a proposed next step, not just a colour: Ferrante's covenant alert arrives with the test, the clauses, the levers in numbers and a drafted note to the company's CFO. And every alert should be decided, not just seen, with a reason: confirmed and escalated, watched, or dismissed. An alert that can be scrolled past is a dashboard decoration.
How do you trust the numbers on a dashboard?
You trust dashboard numbers when each one has been read from the company's own report, checked a second way and approved by someone independent, and when the dashboard shows which figures have not been through all three. Trust is a property of the pipeline behind the tile, not of the tile.
In the solution, the pipeline is fixed: the Mapping agent reads each value with a confidence; anything under 95% goes to the analyst; the Check agent re-derives every value without seeing the first answer; the operating partner approves the set and cannot be the person who mapped it. Downstream, the investor report draft shows nothing for a company whose figures are not yet accepted into the valuation. How one figure moves through each hop is traced in the guide to private equity KPIs.
The same discipline matters because dashboard figures do not stay on the dashboard. They become valuation inputs, and SEC examiners have reported private fund advisers whose holdings were not valued as their disclosures said, with management fees and carried interest charged on overvalued holdings as a result (SEC Risk Alert, June 23, 2020). The company figures on a dashboard sit upstream of those values and those fees.
When should a dashboard alert trigger an out-of-cycle valuation?
When a company-specific event or a market move is large enough that the last valuation may no longer be fair, and the firm's valuation policy defines that threshold in advance. Few firms do. In its 2025 review of private market valuation, the FCA reported that "only a minority of firms reported having defined quantitative or qualitative thresholds for triggering ad hoc valuations", and added: "Most firms did not conduct ad hoc valuations and waited for changes to flow through at the next valuation cycle" (FCA, Private market valuation practices, March 2025).
The FCA described what good triggers look like: at the asset level, a large move in the peer group's average multiple or an event at the company itself, noting they are "especially important where the fund's NAV is reported more frequently than it is valued". A covenant crossing, a large restatement or a liquidity alert is exactly the company-specific event a monitoring dashboard sees first. Linking those alerts to the valuation policy's trigger list turns the dashboard into the early half of an ad hoc valuation process. The valuation itself belongs to Botminds' Private Markets Valuation, and the trigger list to the committee's own valuation committee terms of reference.
The alerts list: each one decided, with what it touches
The tile nobody tested: late and partial reporting
The most dangerous tile on a dashboard is the one that still shows last quarter. A late report says nothing yet about the quarter, and a tile that keeps last quarter's figure, in the same colour as every verified one, says something it cannot know. The honest display is the state: late, held as an exception, or read and waiting for approval.
In the sample, seven companies were late on day 19 and six reports were held as exceptions: scanned pages that could not be read, a report covering August only instead of the quarter, units that changed between thousands and millions. Each appears on the dashboard as what it is, late or held, with the reminder clock running: day 1 to the company, day 5 copying the operating partner, day 10 the deal partner. None of them shows a figure for the quarter until one has been read and checked.
How do you build a private equity KPI dashboard?
Build it from the bottom up: the company map first, the checks second, the alerts third, the picture last. A dashboard built picture-first ends up displaying whatever the spreadsheets underneath contain, and inherits their errors with a better font.
Building a portfolio monitoring dashboard that can be trusted
- Define the four series and their definitions
Revenue after eliminations, reported and adjusted EBITDA apart, cash, and the covenant metric on each agreement's terms.
- Map every company before drawing anything
Which line of each company's report supplies each series; units, period and accounting standard.
- Put a second reading behind every point
And show unverified points differently, or not at all.
- Draw the limit in force on each test date
Step-downs, and the springing threshold where a covenant only applies when the revolver is drawn.
- Write the alert thresholds as policy
Covenant watch, liquidity, variance, restatement, late reporting: set, approved by compliance, changed only with a second person's approval.
- Give every alert an owner and a decision
Confirm, watch or dismiss, with a reason; link company events to the valuation policy's ad hoc triggers.
- Make every point open its page
In the original language, with the line highlighted. This is the feature that saves the operating partner's time.
The thresholds are the part teams argue about longest, and they should. A covenant watch band set too wide fills the screen with companies that are fine; too narrow, and the alert arrives with the breach. The sample sponsor's band, headroom under 0.25x of leverage, flagged two companies at 0.15x and 0.20x inside their limits. The process that produces the figures behind the dashboard, and what it costs, is in the portfolio monitoring process guide.
Questions people ask
How often should a portfolio monitoring dashboard update?
Each time a company's report is read and checked, not on a fixed refresh. In the sample, a company's report is read, mapped and re-derived the afternoon it arrives; approval and acceptance into the valuation follow on their own timetable, and the investor report draft shows a company's figures only once they are accepted.
Should a portfolio dashboard show adjusted or reported EBITDA?
Both, clearly labelled, because they answer different questions. Reported EBITDA shows the trend; adjusted EBITDA on the facility agreement's terms drives the covenant test. In the sample, Ferrante's reported €4.1M and adjusted €4.5M sit on separate lines, and the covenant strip uses the agreement's definition.
Who should see the portfolio monitoring dashboard?
Operating partners and portfolio operations for their companies, deal partners for theirs, and the valuation team for inputs. In the sample, deal teams see only the companies in their own funds, and public-markets teams never see private company reporting, an information barrier the dashboard enforces rather than trusts.
Can a dashboard replace the quarterly portfolio review meeting?
It can change what the meeting is for. When every alert has already been decided with its evidence, the review can spend its time on the few companies whose plans need to change, rather than on establishing what the numbers are.
What is the difference between a portfolio dashboard and a portfolio report?
A dashboard is live and internal, built for triage and decisions during the quarter. A report is a fixed account for a period, sent to investors or a committee after the figures are approved. The same verified figures should feed both, so that the dashboard and the report never disagree.