To read a CIM well, read it out of order: go first to the few pages that can end the deal (the transaction summary, the revenue split, the historical financials, the adjusted EBITDA bridge and any financing page), test them against your fund's limits and the target's own statutory accounts, and only then read the rest as the seller's argument it is. A confidential information memorandum is written by the seller's banker to win bids, and a private equity team closes only a few of the companies it reads about, so the reader's job is a fast, page-cited yes or no. Botminds' Private Equity Deal Screening does that first read with agents: they test each CIM against the fund mandate, rebuild EBITDA from the target's filings, and show the page behind every finding, while the associate decides.
The examples on this page come from fictional sample data as it runs through the solution: Quillfield Private Equity, its flagship buyout fund Quillfield Capital Partners V, and an 84-page CIM called Project Atlas for a Rotterdam valve maker, Anvara Industrial Group B.V. The research figures come from peer-reviewed studies and SEC rule text, linked where they appear.
Three numbers that shape how a deal team reads a CIM
20%
median and average discount private equity investors apply to management’s EBITDA forecasts
96%
of surveyed investors model five years of cash flows, so a CIM’s five-year plan is the one that gets priced
6in 100
opportunities a private equity investor considers end in a closed deal, on average
What is a CIM in private equity?
A CIM, or confidential information memorandum, is the selling document for a private company: the banker running the sale writes it with management and sends it to buyers who have signed a non-disclosure agreement. It typically describes the business, its markets and customers, its management, its historical financial statements, management's adjustments to earnings, a multi-year forecast and the process: who to contact and when indications of interest are due. For Project Atlas that is 84 pages from Harcourt Lane Advisors, with indications due eleven days after the CIM arrived.
Three features of the document decide how it should be read. It is advocacy, prepared by the seller's adviser to support a price. It is unaudited as a whole, even where it reproduces audited statements, and its adjusted figures are the seller's own definitions. And it is selective: the CIM gives the analysis the seller wants priced, while the evidence a buyer needs to test it, the statutory accounts of each operating company, often sits in an appendix or arrives separately. A good first read therefore runs two documents side by side, the CIM and the filings, and treats every difference as a question.
For a fund manager there is a fourth feature. Once the NDA is signed and the company is named, the CIM may be material non-public information about any listed securities the company or its parent has issued, including bonds. That question comes before page one, and the barrier check a CIM needs before anyone opens it is a guide of its own.
What is the difference between a teaser and a CIM?
A teaser is a short, usually anonymous summary sent to many buyers to test interest; the CIM is the full document, released once a buyer signs the NDA. The difference matters for screening because the two carry different decisions. A teaser can be declined on a hard limit (a sector the fund cannot own, a size outside its range) without anyone learning the company's name. A CIM names the company, which brings in the information barrier, the file of what the firm was told and, if the fund passes, a decline note that must say nothing learned from it.
Four documents in a sale process, and what each lets a buyer decide
| Document | When it arrives | What it usually holds | What a buyer can decide from it |
|---|---|---|---|
| Teaser | Before any NDA | Anonymous summary: sector, region, size range, headline financials | Decline on a hard limit; ask for the NDA |
| CIM | After the NDA | The company named; business, markets, management, history, adjustments, forecast, process | Decline with a reason, or advance to a first look and an indication of interest |
| Management presentation | After a first-round bid | Management in person, updated trading, the plan defended | Whether the plan and the team hold up; whether to bid again |
| Data room | Second round | Contracts, statutory accounts, tax, legal and HR files | Confirmatory diligence; the binding bid and its conditions |
Which pages of a CIM decide a first screen?
Five or six pages decide most first screens, and they are rarely the first pages of the document. The narrative chapters (the investment highlights, the market overview, the growth story) are where the seller makes its case; the screen is decided by the pages that hold numbers a fund's limits are written in. Read those first, note the page of each figure, and the decline or the first look writes itself.
The pages of the Atlas CIM that decided its screen, in the order to read them
| CIM page | What it holds | What it is tested against | What it showed |
|---|---|---|---|
| p. 6 · Transaction summary | Perimeter, seller, process dates, enterprise value guidance | Fund size range and the cap on one deal | Guidance $640M–$700M; an equity check of about $300M, 4.4% of the fund |
| p. 23 · Revenue by region | Revenue split by country and region, FY2025 and last twelve months | Concentration limits in the LPA | Turkey 41.0% of LTM revenue against a 25% single-country cap |
| p. 31 · Historical financials | Reported revenue and EBITDA | Minimum EBITDA margin | $58.4M EBITDA on $412.6M revenue: 14.2% |
| pp. 38–41 · Adjustments | Management’s bridge from reported to adjusted EBITDA | The firm’s own view of earnings | $13.5M of add-backs, 23.1% of reported EBITDA |
| p. 8 · Financing | Staple financing offered by the banker | Maximum leverage at entry | $377.5M of debt: 5.76x on the firm’s EBITDA |
| p. 27 · Products and end markets | Sales by product and customer type | Exclusion policy and side letters | Naval valves 4.1% of revenue, conventional |
Order matters because a single failed limit ends the read. At Quillfield the geography limit sits in the fund's limited partnership agreement, so a 41.0% Turkish share cannot be argued away by a partner; only the fund's limited partners' advisory committee could waive it. An associate who starts with the investment highlights spends an hour on a company the fund cannot buy. One who starts with page 23 knows in minutes. How a fund's investment criteria become pass-or-fail tests sets out which limits can be overridden and by whom.
How do you read the adjusted EBITDA bridge in a CIM?
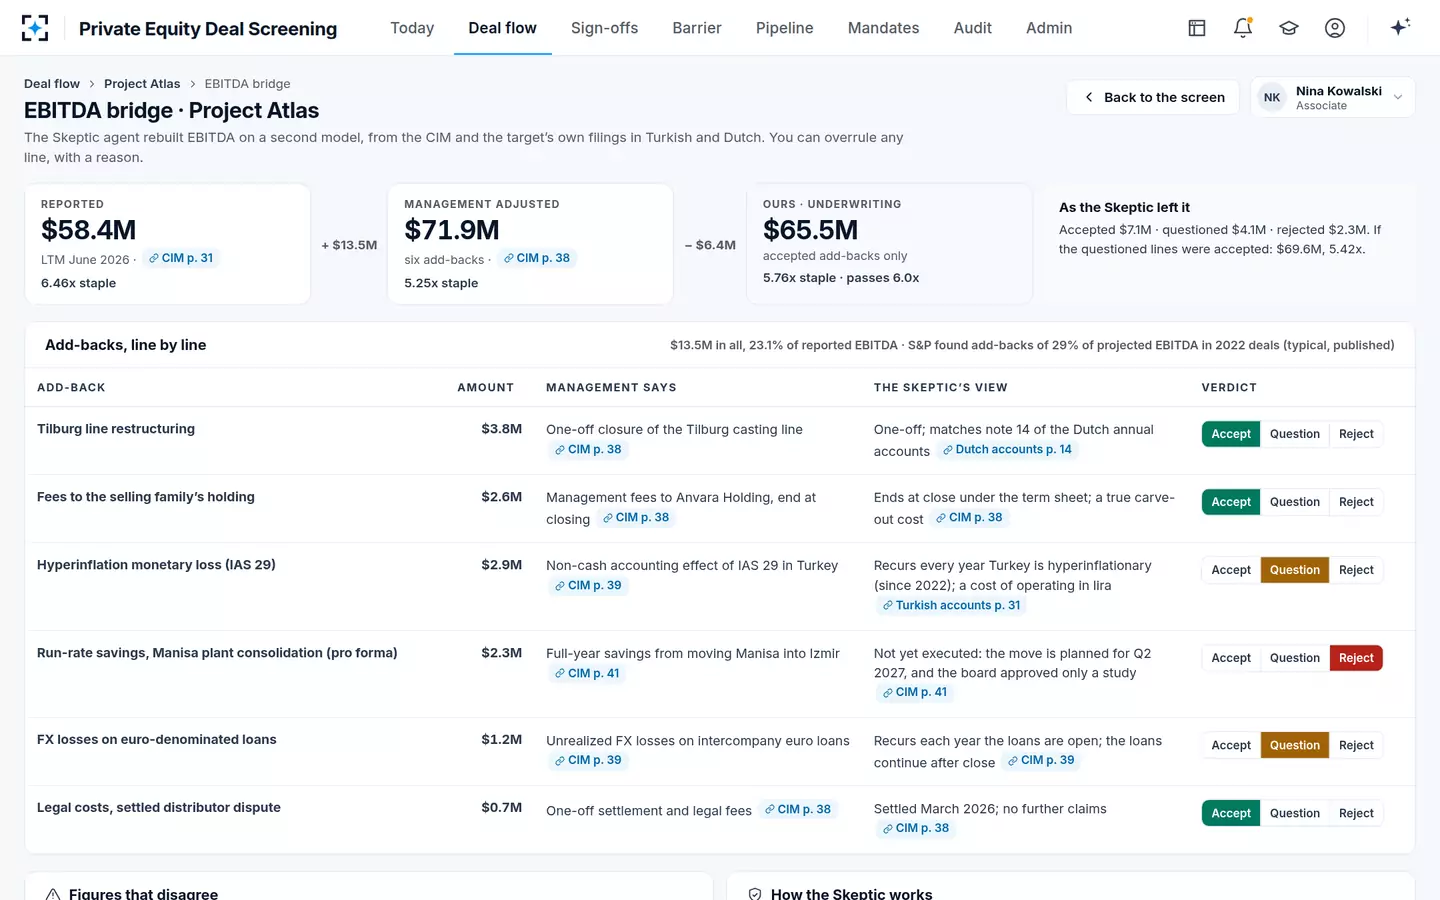
Read the bridge line by line and sort every add-back into one of three piles: one-off and evidenced, recurring but labelled one-off, and not yet earned. Then rebuild EBITDA with only the first pile, and price the deal on your number, not the CIM's. The bridge deserves the most time of any page because nothing obliges the seller to present it a particular way. If the deal goes ahead, the same piles become the buyer's quality of earnings work, and EBITDA add-back examples shows which kinds survive.
Public companies work under a rule here; a CIM does not. When an SEC registrant publicly discloses a non-GAAP measure, Regulation G says it must sit beside the closest GAAP measure, with a clear reconciliation of the two (17 CFR 244.100(a)). A private company's CIM is not a public disclosure by a registrant, so the reconciliation, and the judgment on each line, is the buyer's work.
Project Atlas: $13.5M of add-backs, sorted into the three piles
| Add-back | Amount | What management says | The firm’s view | Pile |
|---|---|---|---|---|
| Tilburg line restructuring | $3.8M | One-off closure of a casting line (CIM p. 38) | Matches note 14 of the Dutch annual accounts | Accept |
| Fees to the selling family’s holding | $2.6M | Management fees that end at closing (p. 38) | Ends under the term sheet; a true carve-out cost | Accept |
| Settled distributor dispute | $0.7M | One-off settlement and legal fees (p. 38) | Settled March 2026; no further claims | Accept |
| Hyperinflation monetary loss (IAS 29) | $2.9M | Non-cash accounting effect in Turkey (p. 39) | Recurs every year Turkey is hyperinflationary | Question |
| FX losses on euro loans | $1.2M | Unrealised losses on intercompany loans (p. 39) | Recurs while the loans stay open after closing | Question |
| Manisa plant savings (pro forma) | $2.3M | Full-year savings from a plant move (p. 41) | Planned for Q2 2027; the board approved only a study | Reject |
The research says the sorting is worth the time. In the survey of 79 private equity investors behind the figures at the top of this page, the typical deal team cut management's EBITDA forecast by a fifth before pricing (Gompers, Kaplan and Mukharlyamov). A Federal Reserve Bank of St. Louis working paper, not peer reviewed, studied the same habit from the lender's side: in syndicated loans, greater use of non-GAAP add-backs went with a higher likelihood of delinquency, default and rating downgrades (Faria e Castro, Gopalan, Pal, Sánchez and Yerramilli, 2022). The bridge in a CIM is where the gap between a seller's earnings and a buyer's earnings is decided.
The Atlas bridge in Private Equity Deal Screening: every add-back with its page and a verdict
Read the CIM against the target's statutory accounts
The statutory accounts of each operating company are the buyer's independent evidence, and the first read should tie at least the largest figure in the CIM to them. They are prepared under local law, often in the local language, for a full financial year; the CIM is in English, consolidated, and often for the last twelve months. The two will rarely match line for line, so the test is whether the difference can be explained.
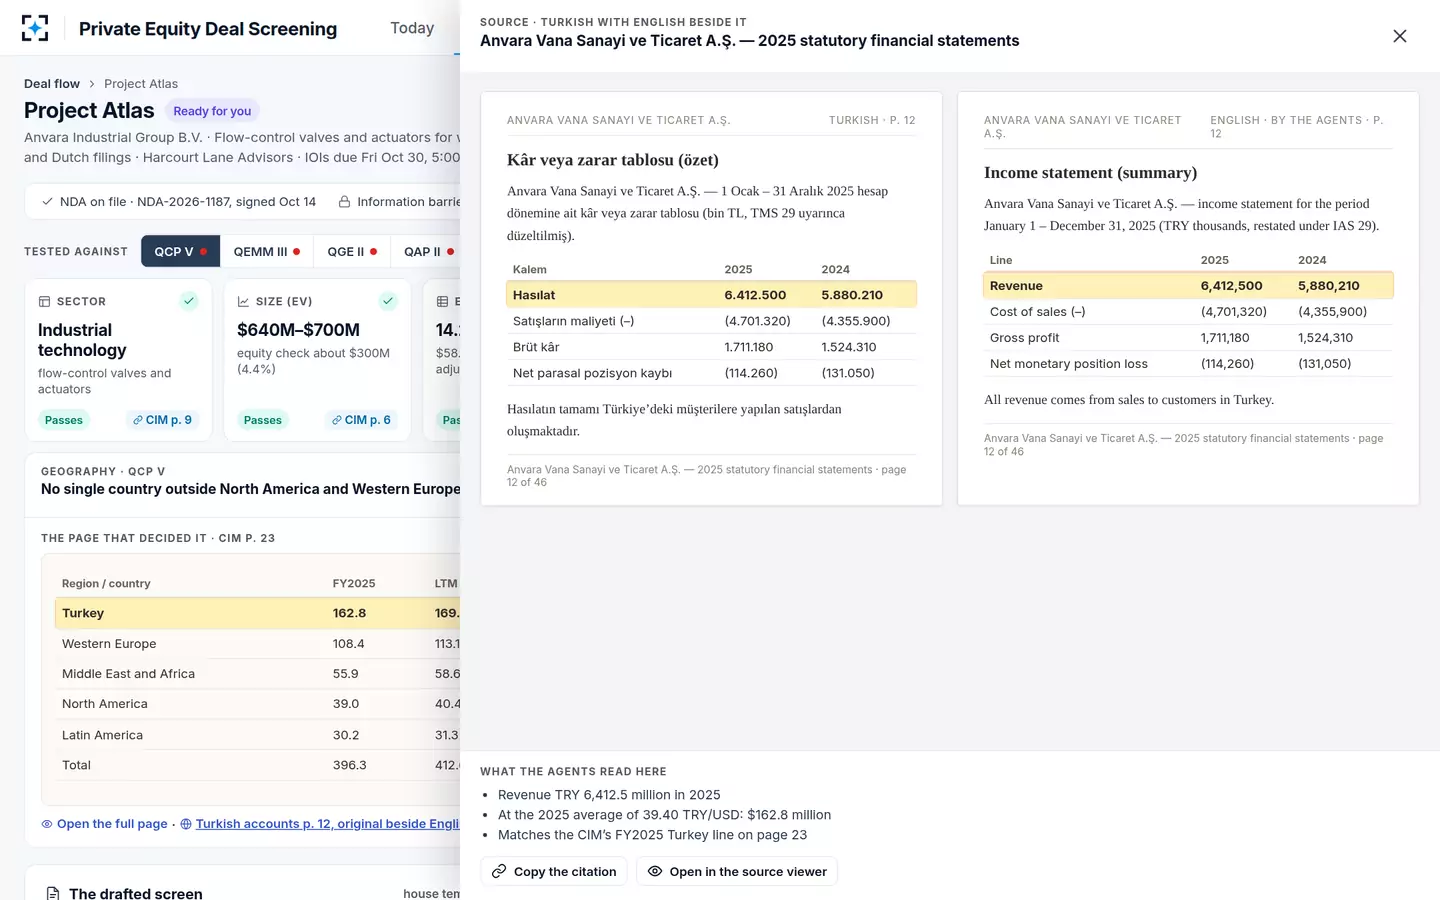
For Atlas, the Turkish subsidiary's 2025 accounts report revenue (hasılat) of TRY 6,412.5 million on page 12. At the 2025 average rate of 39.40 lira to the dollar that is $162.8 million, exactly the CIM's FY2025 Turkey line on page 23; the CIM's $169.2 million is the twelve months to June 2026, a later period. The same page explains a line in the bridge: a net monetary position loss of TRY 114.3 million, about $2.9 million, which is the IAS 29 hyperinflation add-back. Seen in the statutory accounts, it is a cost the Turkish business bears every year, not a one-off.
The original filing beside the English, with the CIM line it confirms
What should you look for in a CIM's revenue split?
Look for the denominator, the period and the share that breaks a limit. A revenue split is where concentration hides: by country, by customer, by product, by end market. Each share needs its total and its period, because a CIM may give regional shares on one revenue figure and the headline on another. At Atlas, Turkey is 41.0% of last-twelve-months revenue and 41.1% of FY2025 revenue: the limit fails on either period, which is why the finding is safe to act on.
Then ask what the split does not show. The Atlas CIM gives Middle East and Africa as one line, so no reader can say whether a second country is near the cap, and it gives no EBITDA for the business without Turkey. When the associate asked what a sale without the Turkish business would look like, the answer was a perimeter of $243.4 million of revenue in which no single country outside North America and Western Europe exceeds 25%, together with a note that the CIM gives no EBITDA for the remainder, so the banker should be asked before anyone relies on it. A first read should end with that kind of question list as well as a verdict.
A CIM is the seller's argument. The statutory accounts are the evidence. A first read that never opens the second has only heard one side.
Check the CIM against itself, and the forecast against the history
Inconsistencies inside a CIM are common and cheap to find. The Atlas CIM gives an adjusted EBITDA margin of 17.6% in its executive summary on page 6 and 17.4% in the financials on page 31. The difference is small, but it means at least one figure was not updated after the adjustments changed, and the reader should use the one that ties to the bridge.
The financing page is where a single number does the most work. The banker's staple financing offers $377.5 million of debt. On reported EBITDA that is 6.46 times; on management's adjusted EBITDA, 5.25 times; on the firm's own underwriting EBITDA, 5.76 times. Quillfield's leverage guideline is 6.0 times its own EBITDA, so the same debt package passes or fails depending on which EBITDA the reader divides by. Always state leverage on your own number.
The forecast deserves the same suspicion, aimed at its shape. Almost 96% of the surveyed private equity investors use a five-year forecast horizon, which means the CIM's five-year plan feeds directly into the entry price and the return (Journal of Financial Economics, 2016). Set the forecast's growth and margin path beside the last three years of history; a plan whose margin expands faster than it ever has, beginning the year after the sale, is the place to apply the haircut deal teams already apply.
How long should a first read of a CIM take?
No regulator or independent study publishes how long a first read of a CIM takes; it depends on the length, the language and what the firm's screen requires. The useful number is your own. Time the first passes your associates make for a month, split into reading, testing the fund's limits, rebuilding EBITDA, searching for prior looks and writing the screen, and you have the baseline any change can be measured against.
For a mid-size buyout CIM, Botminds estimates about six hours of associate time for that first pass by hand, two of them reading and an hour and a half rebuilding EBITDA, and under an hour with the solution, including the associate's own review. That is our estimate, not a measured result. On the sample deal, the time from dropping the Atlas CIM into the solution to a proposed decline with its reason code was four minutes; the design target for any CIM is a cited first screen within fifteen minutes of receipt. What one CIM costs to screen turns those hours into money.
A first-read checklist for any CIM, in the order that saves the most time
- Clear the barrier before opening it
Check the target, its parent and any listed bonds or shares against the restricted and watch lists and the firm’s public holdings.
- Read the transaction summary for size and perimeter
Enterprise value guidance, the equity it implies as a share of the fund, and exactly what is for sale.
- Test every concentration limit on the revenue split
Country, customer, product; note the period and the total each share is taken from.
- Tie the largest figure to the statutory accounts
Read the filing in its original language; explain any difference by period, perimeter or currency.
- Sort every add-back into accept, question or reject
Cite the page for each; rebuild EBITDA on the accepted lines only.
- Restate leverage and margin on your own EBITDA
The staple financing passes or fails on the number you divide by.
- Check the CIM against itself
The same metric on two pages should give the same figure.
- Search for a prior look at the same company
Match on registry numbers and addresses, not the project code name.
- End with a verdict and a question list
What would change the answer, and what to ask the banker before relying on it.
Where Private Equity Deal Screening reads a CIM, and where it stops
The solution reads the CIM and its filings in any language, but it reads them for a deal team, not instead of one. An Intake agent identifies the project, target, banker, deadline and NDA and flags any file it could not read in full. A Wall agent clears the barrier before anyone opens the document. A Screener agent tests the CIM against each of the fund's limits and shows the page that decided each; below 90% confidence on any one, it hands that test to a person. A Skeptic agent, on a second and independent model that cannot see the Screener's score, rebuilds EBITDA from the CIM and the statutory accounts. A Drafting agent writes the one-page screen with every figure cited.
What the agents do not do is decide. They never decline, advance, send a note to the banker or waive a limit. The associate decides with a reason code, a vice president confirms every decline on a scored deal, and a deal partner approves every first look. Who decides each step of a screen follows those signatures seat by seat, and Private Equity Deal Screening shows the whole sample deal from inbox to confirmed decline.
Questions people ask
What is a CIM in M&A?
In mergers and acquisitions a CIM, or confidential information memorandum, is the document a sell-side adviser prepares to market a company to prospective buyers, released after they sign a non-disclosure agreement. It describes the business, its financial history, management's adjustments and forecast, and the sale process. Private equity firms read it to decide whether to submit an indication of interest.
How long is a CIM?
There is no standard length; it is the banker's choice and depends on the size and complexity of the business. The fictional Project Atlas CIM in this guide runs to 84 pages, with 77 more pages of Dutch and Turkish statutory accounts behind it. What matters for screening is not the length but the half-dozen pages that hold the figures a fund's limits are written in.
Who writes the CIM?
The seller's investment bank or M&A adviser writes it, working with the company's management, who supply and approve the figures. That is why a buyer reads it as advocacy: the adjustments and the forecast are the seller's, and the buyer's own number is built from them and from the statutory accounts.
Should you trust management's projections in a CIM?
Treat them as a starting point to be discounted. In a peer-reviewed survey of private equity investors, the 44 who gave a figure discounted management's EBITDA forecasts by 20% at the median and on average, and 11 more said the discount depends on the deal. Compare the forecast's margin path with the company's history before deciding how far to cut it.
Is a CIM confidential information?
Yes: it is released under a non-disclosure agreement that limits its use to evaluating the deal and often requires its return or destruction if the buyer withdraws. If the company or its parent has listed shares or bonds, the CIM can also be material non-public information for a manager whose other funds trade those securities, which is why the barrier check comes before page one.
What is the difference between a CIM and a management presentation?
The CIM is a written document sent to every buyer who signs the NDA; the management presentation is a meeting, usually offered only to buyers who pass the first round of bids. The presentation updates trading since the CIM was written and lets buyers test the plan with the people who will run it.