There is no single published average insurance renewal increase, but regulators' data gives the shape of it. Homeowners premiums averaged $1,600 a policy in 2024, and average premium per policy rose between 44% and 74% from 2018 to 2024 depending on the region, most of it in 2023 and 2024. Auto premiums rose 14.42% on average from 2022 to 2023. Behind those averages, individual renewals range from decreases to increases of a third or more, and every large one produces the same question: why? For a carrier, the average matters less than what each unexplained increase costs in calls, complaints and lost renewals. Botminds' Premium Increase Explanation is software that splits every renewal increase into its reasons and drafts the explanation before the notice mails; this page sets out how to measure what that is worth.
The market figures below come from the NAIC, the U.S. Treasury's Federal Insurance Office and the Texas Department of Insurance, linked where they appear. The renewal-book figures come from a fictional sample carrier, Tallowmere Mutual, as it runs through the solution, and are sample data; the per-call minutes are Botminds' estimates.
What regulators’ data says about renewal increases
$1,600
average homeowners premium per policy, 2024
44–74%
rise in average homeowners premium per policy, 2018–2024, by NAIC zone
+14.42%
average auto premium per vehicle, 2022 to 2023
3.4×
Texas home and auto premium complaints, 2025 against 2019
What is the average insurance renewal increase? What regulators' data shows
For homeowners, the newest national figures come from the market conduct data state regulators collect. In 2024, 715 homeowners insurers wrote 103,289,334 policies and $165.2 billion of premium, “or an average of $1,600 per policy”, with the Southeast highest at $1,818 and the Northeast lowest at $1,396 (NAIC Center for Insurance Policy and Research). From 2018 to 2024, average premium per policy rose from 44% in the Northeast zone to 74% in the Western zone, before inflation; after adjusting for inflation the rises are smaller, about 18% to 43%. The authors note that the increases “were most significant in 2023 and 2024.”
The Treasury's Federal Insurance Office, working from a separate regulators' data call covering 2018 to 2022, found the same direction and a wide spread. Nationally, inflation-adjusted premiums per policy reached $1,737 in 2022. In the fifth of ZIP codes with the steepest rises, premiums per policy rose at least 14.7% faster than inflation; in the fifth with the smallest, they fell by at least 1.4% relative to inflation (FIO, Analyses of U.S. Homeowners Insurance Markets, 2018–2022). The increase a homeowner sees depends heavily on where the home is.
For auto, the NAIC's database report gives a national combined average premium per issued vehicle of $1,438 in 2023, “a 14.42% increase from 2022 to 2023”, and an average expenditure per insured vehicle of $1,281, up 19.24% from 2019 (NAIC, 2022/2023 Auto Insurance Database Report). Those are averages across all insured vehicles, not the renewal change on any one policy, but they show a year in which a mid-teens auto increase was ordinary.
How much does home insurance increase yearly?
On the NAIC figures, between about 6% and 10% a year on average from 2018 to 2024, before inflation, depending on the region: a 44% rise over six years compounds to about 6.3% a year, and 74% to about 9.7% (our arithmetic). That smooth rate is misleading in two ways. The rises were bunched in 2023 and 2024, so many households saw several quiet years and then one or two large renewals. And an average per policy includes the rising amounts of coverage on each home, so part of it is more insurance, not a higher price for the same insurance.
Some states limit how far a renewal can rise because of a rate change, and some require notice above a threshold; those rules are set out on the Personal Lines page on whether there is a limit on how much insurance can increase per year. Most of what moves a single renewal, though, is not capped: a roof crossing an age band, a claim ending a discount, a new driver, a higher dwelling amount.
Home insurance renewal increase vs car insurance renewal increase
They rise for different reasons, so they need different explanations. Homeowners premiums have been driven by catastrophe risk and rebuilding costs: the FIO found that consumers in the fifth of ZIP codes with the highest expected annual losses from climate-related perils paid average inflation-adjusted premiums of $2,321 a policy, 82% more than the lowest fifth, and that average claim severity over 2018 to 2022 was $18,206. Research using 74 million premiums inferred from mortgage escrow payments finds that premium increases are capitalized into home values, “reducing home price growth by over $40,000 in the most exposed zipcodes” (Keys and Mulder, NBER working paper 32579).
Auto premiums have followed claim costs on the road. The NAIC reports that the average incurred loss per collision claim rose 17.6%, from $6,113 in 2021 to $7,191 in 2022, and that liability premiums grew 19% from 2019 to 2023 while the number of vehicles insured grew 5.5%. At the policy level, the auto renewal is also more exposed to the household's own year: a teen driver, an accident, a ticket or a new car. In the sample carrier's window, a new teen driver added $388 to one Washington auto renewal; an at-fault accident added $241 to one in New York.
Why the average hides the renewal your customer got
Because a renewal book is a distribution, not an average. The sample carrier's renewal window from November 15 to December 31, 2026 held 18,460 renewals. About one in six went down. Of the 14,212 that went up, 7,281 rose less than 10%, 5,747 rose 10% to 25%, and 1,184 rose 25% or more. A head of customer experience who plans around a mean increase will staff for the wrong calls: the questions come disproportionately from the tail.
One renewal window, by size of change
18,460 renewals, Nov 15 – Dec 31
- Decrease · 17%
- No change · 6%
- Up under 10% · 40%
- Up 10–25% · 31%
- Up 25% or more · 6%
The reasons differ across the distribution too. In the sample window, rate revisions supplied $1,912,400 of the $6,154,200 of added premium, about a third. The other two-thirds were exposure, property, loss, driver, discount and coverage changes particular to each policy. That is why one market-wide script cannot explain a book: it explains a third of the dollars and none of the household-specific ones.
What is driving increases across one renewal window
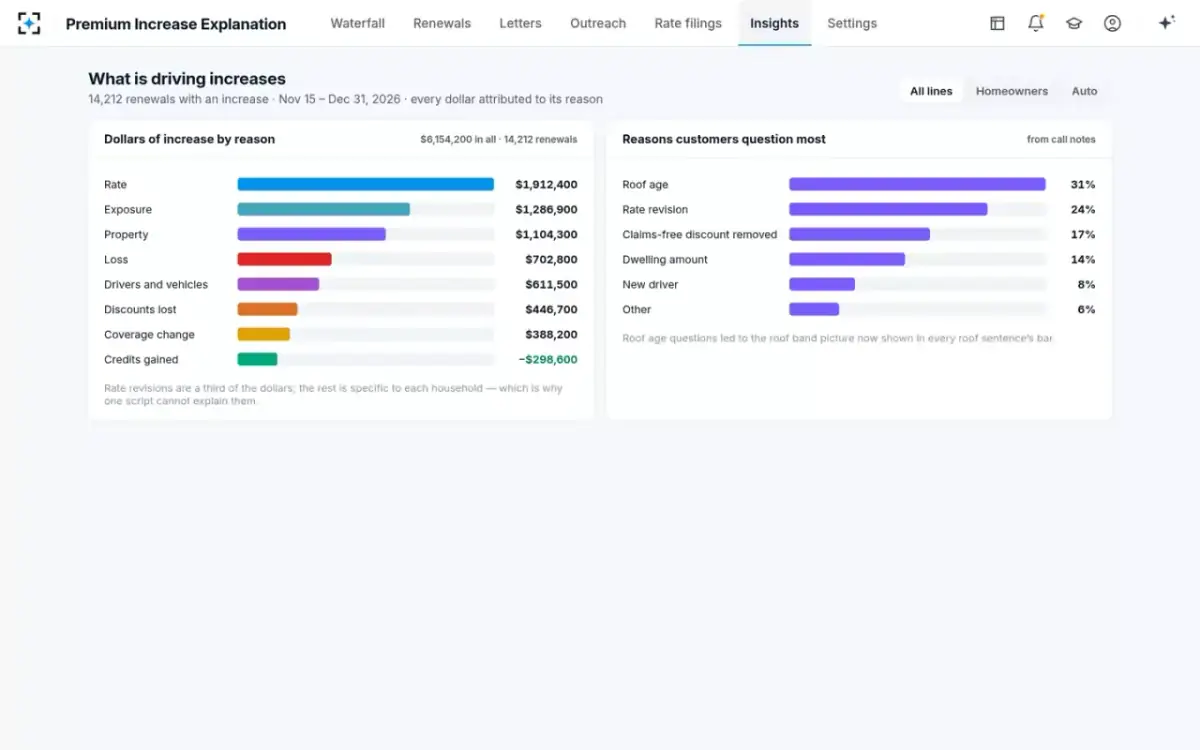
When increases rise, the “why” call becomes a volume line
Large increases produce questions, and unanswered questions produce complaints. Texas publishes every complaint its Department of Insurance handles. On our count of that data, complaints about automobile or homeowners coverage that cite premium and rating rose from 334 closed in 2019 to 1,127 in 2025, while their share of all auto and home complaints rose from 5.2% to 7.2%. Most did not find the insurer at fault: in 2025, 18% were confirmed and 72% closed with the department noting that information had been furnished.
Texas premium and rating complaints on auto and home policies, by year closed
A complaint is the expensive end of the line. Before it come the calls: the policyholder who rings the service desk, then the agent, then the service desk again. None of those are counted publicly, which is why a carrier has to count its own. What the Texas data does show is that the line moved with the premiums, stepping up in 2023 when homeowners premiums did, and that the commonest regulatory outcome is an explanation delivered months late.
Four numbers that put a value on explaining
The value of explaining increases is measured in calls that do not happen, minutes saved on calls that do, complaints that are not filed, and renewals that are kept. Each needs a definition a finance team will accept and a baseline taken before anything changes. Retention is the hardest, because many things move it at once; the honest way to measure it is a comparison group, not a before-and-after.
A KPI set for explaining renewal increases
| KPI | Definition | How to take the baseline | Sample figure |
|---|---|---|---|
| “Why” calls per 1,000 increases | Calls whose reason is the renewal premium, per 1,000 renewals with an increase | Call reason codes for the last renewal season, by increase band | Not measured in the sample |
| Minutes per “why” call | Handle time on those calls, including after-call work | Timed sample of calls before the change | ≈11 by hand, ≈4 with the split on screen (estimate) |
| Premium complaints per 10,000 policies | Complaints to the carrier or regulator citing premium or rating | Last two years, so a bad season does not set the baseline | Not measured in the sample |
| Renewal kept, by increase band | Policies renewed among those with an increase of 15% or more | A comparison group: households called before the notice against similar ones not called | Not measured in the sample |
| Letters approved before the notice mails | Share of letters due that a person approved on time | Count from the renewal calendar | 2,917 approved of 6,931 due, mid-window |
Where the minutes of a “why did my premium go up” call go
By hand · about 11 minutes
- Finding both declarations and worksheets · 18%
- Matching worksheet lines and factors · 27%
- Checking the filing and policy changes · 23%
- Explaining to the customer · 23%
- Finding ways to lower it · 9%
With the split on screen · about 4 minutes
- Finding the documents · 12%
- Matching lines · 12%
- Checking the filing · 13%
- Explaining to the customer · 38%
- Finding ways to lower it · 25%
Building the business case without borrowed statistics
The business case adds four terms and subtracts one, and every input should come from the carrier's own data. Industry surveys of how explanations change shopping behaviour are tempting to borrow, but their populations and questions rarely match a carrier's book, and a case built on them falls apart at the first question from finance. A carrier that runs the measurement for one renewal season has a number it can defend.
What explaining renewal increases is worth in one season
Calls avoided
Increases × (baseline − new “why” calls per increase) × minutes × cost per minute
From call reason codes, by band
Service operations
Minutes saved
Remaining “why” calls × (minutes before − minutes after) × cost per minute
From timed samples
Service operations
Complaints avoided
(Baseline − new premium complaints) × cost to handle one
Including regulator correspondence
Compliance
Renewals kept
(Kept rate with − kept rate without) × policies in band × margin
From a comparison group only
Retention and finance
Cost to run
Software + review time per letter × letters + set-up
Approval time is a real cost
Finance
Two terms deserve care. Renewals kept is the largest and the least certain; it should be measured only by comparing households that got the new treatment with similar households that did not, in the same season, and only in states where the treatment is a choice. In New York and Washington an explanation on request is a legal duty, and in New York a written explanation must go with the bill above 10% (N.Y. Ins. Law §2356; WSR 26-15-007), so the comparison there is between kinds of explanation, not explanation and none. Cost to run includes the time a person spends approving each letter, which is the part the solution deliberately does not remove.
What Premium Increase Explanation changes in the numbers, and what it cannot
The solution moves the minutes and the coverage of explanations. It splits every renewal with an increase overnight, so every “why” call starts with the reasons on screen rather than a search; on the sample window that is 14,212 renewals split and 6,931 letters due at 10% or more. It ranks households for a call before the notice, so the largest increases are explained by a person first. And it records which reasons customers question most, from call notes, so the carrier can see where explanation work pays.
Every renewal in the window, with its letter status
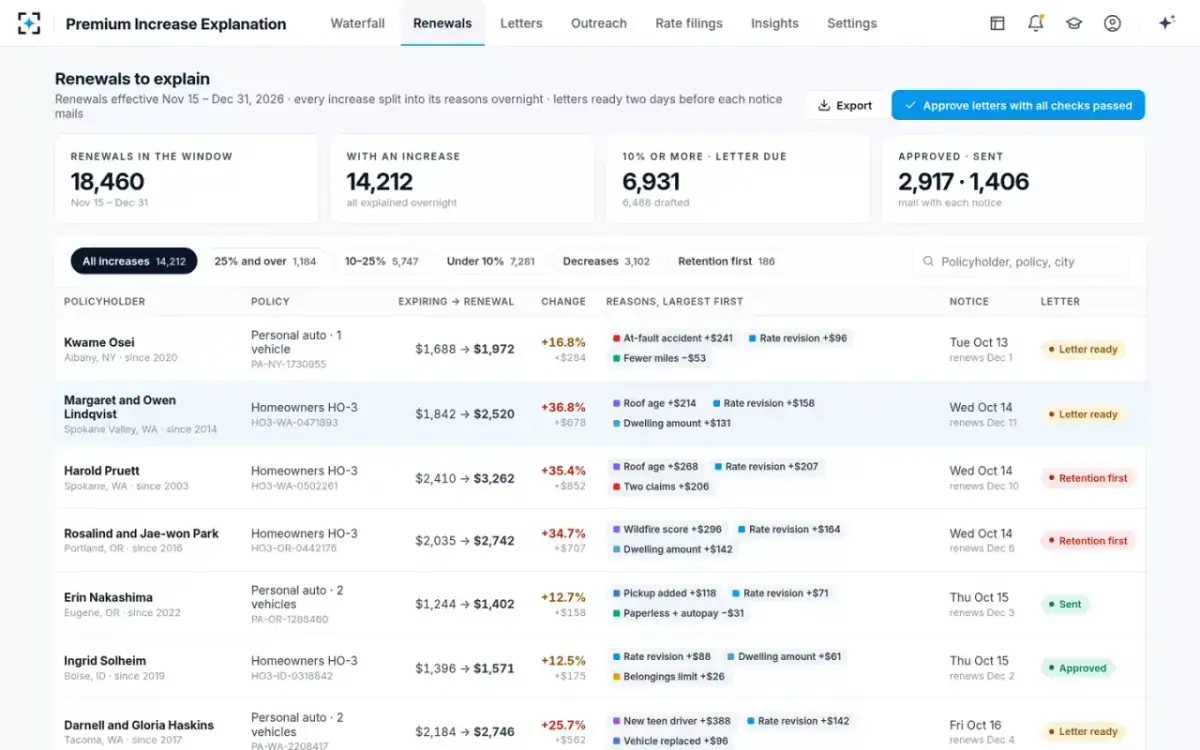
It cannot make a premium smaller, and it does not decide prices; the options it re-rates are only those the household already qualifies for. It cannot tell a carrier how many renewals an explanation keeps; only the carrier's own comparison can. And it does not remove the person: every letter is approved and e-signed by a representative, which is a cost in the formula above and the reason the letters can be trusted. The page on how to explain an insurance rate increase to clients shows what that person says; why homeowners insurance goes up so much shows the same increase from the policyholder's side. To see the screens, start from Premium Increase Explanation.
Questions people ask
What is the average homeowners insurance increase for 2026?
No regulator has published a national 2026 figure yet; the newest national data runs to 2024. On it, the average homeowners premium was $1,600 a policy, and average premium per policy had risen 44% to 74% since 2018 by region, with the largest increases in 2023 and 2024. A household's own renewal can be far from the average in either direction.
Is it normal for car insurance to go up at every renewal?
Over recent years, increases were common: the NAIC's combined average auto premium per vehicle rose 14.42% from 2022 to 2023, as collision claim costs rose. But a single renewal moves for the household's own reasons too, such as a new driver, a claim or a new vehicle, and it can go down when a driver ages, a ticket drops off or miles fall.
Why do insurance premiums increase every year?
Partly because the cost of claims rises: the FIO found average homeowners claim severity of $18,206 over 2018 to 2022, and the NAIC found collision claim severity up 17.6% in one year. Partly because insured values rise with rebuilding costs. And partly for reasons on the policy itself, which an explanation should name in dollars.
How big an increase should trigger a call before the renewal notice?
It is a carrier's choice. The sample carrier ranks every household with an increase of 15% or more by size, tenure and other policies held, and sends those over 30% and $700 to a retention call before the letter is approved. New York's written-explanation threshold of more than 10% and Washington's 10% for automatic notices from 2029 are natural floors for a letter.
How do you measure whether explaining premium increases keeps customers?
With a comparison group in the same season: households that got a call or a letter against similar households that did not, by increase band, in states where the treatment is optional. A before-and-after comparison mixes in price changes, competitors and the economy. Track the result for at least one full renewal cycle.