A transcription error in pharma is a value correctly recorded in one place and wrongly carried into another — a liver weight typed into a report table as 14.12 instead of 14.21, a group mean copied into a results sentence a digit short. It matters because manual data entry has a measured error rate rather than an occasional one, and because a repeat-dose toxicology study report carries 9 sections, 10 to 20 tables and between 400 and 4,000 numbers that have to get from a raw data export into a document. Preclinical Study Report Automation builds those tables cell by cell from the source sheets and inserts every number in the text as a reference to its file, sheet and cell, so the class of error this page is about has no keystroke to start from.
The two published rates below were measured in clinical data management, not in toxicology report writing; nobody has published a per-field rate for the second job, and saying so is more useful than borrowing a number and pretending it transfers. The study, the people and the compound in the screens — VLT-TOX-028, a humanised antibody, and the team around it — are invented sample data in the solution.
Two measured error rates, and the size of the job they are being read against
0.34%
of fields wrong on single data entry, measured over 104,720 fields
10per 10,000
fields: the accepted error rate for paper-based double data entry
400–4,000
numbers in one repeat-dose toxicology report
demo
88.3%
of single-entry errors found by double entry with a different operator
What is a transcription error, and why does pharma count them?
A transcription error is a failure of carriage, not of measurement. The balance read 14.21 g, the technician recorded 14.21 g, and somewhere between the raw data file and the report the number became something else. Nothing was mis-measured and nobody was careless in the ordinary sense; a finger moved two keys instead of one, or an eye returned to the wrong row of a long table.
Regulated industries count them because the record is the product. In a nonclinical study the raw data is defined as what is necessary to reconstruct and evaluate the report, so a report number that does not match its raw data breaks the link the whole document rests on. The UK regulator states the expectation in one sentence: “where manual transcriptions occur, these should be verified by a second person or validated system” (MHRA GXP data integrity guidance, section 6.11). Note the structure of that sentence — it does not say transcription is forbidden. It says that if you do it by hand, somebody else has to check it, and the cost of the check is the cost of the method.
The same guidance explains why the profession prefers to avoid the step altogether where it can, listing among its enablers of good behaviour the “accessibility of records at locations where activities take place so that informal data recording and later transcription to official records does not occur”. Every transcription is an opportunity the original record did not have.
How many numbers get re-keyed into one toxicology report
More than most people estimate, because the count is not the number of distinct results. A 28-day repeat-dose study in two sexes at four dose levels produces group means and standard deviations for body weight at weekly intervals, food consumption, clinical pathology panels of twenty or more analytes, organ weights absolute and relative, and incidence counts for macroscopic and microscopic findings. Each of those appears in a table; many reappear in the results text; the important ones reappear again in the summary and the conclusion, often with a percentage change calculated from them.
In the sample study the drafted report carried 156 traced numbers at first opening and 166 by the time the recovery data had been added — and that is one study with ten animals per sex per group. A larger study, a longer dosing period or a report that carries individual animal data into appendices reaches four thousand without difficulty. The range the sample team works across is 400 to 4,000 per report.
Slips you should expect in one report at the measured single-entry rate
What the measured data-entry error rates actually are
Two numbers are worth knowing, and both come with conditions. Kawado and colleagues compared verification methods on 560 case report forms in the Japanese Registry of Renal Transplantation. Their baseline is the one most often quoted out of context: “single data entry errors were detected in 358 of 104,720 fields (per-field error rate = 0.34%)”. That is roughly one field in three hundred, on routine registry data entry.
The second comes from Shelby-James and colleagues, who set handheld data capture against paper in a palliative care trial and reported “error rates from the handheld computers were 67.5 error per 1000 fields, compared to the accepted error rate of 10 per 10,000 field for paper-based double data entry”. Two things in that sentence repay attention. The accepted rate for paper double entry — one field in a thousand — is the benchmark a well-run double-checked process is held to, an order of magnitude better than single entry. And the headline finding is that moving to a screen made things far worse — 67.5 against 1 per thousand — with the errors clustered where the device supplied a value: “error rates were highest in field containing a default value”. Technology is not automatically an improvement over paper. It is an improvement when it removes a decision, and a regression when it supplies one.
What the two published measurements actually measured, and what transfers
| The study | What it measured | What transfers to report writing | What does not |
|---|---|---|---|
| Kawado et al., 2003, Controlled Clinical Trials | 104,720 fields of clinical case report form data entered singly by two operators, then verified four ways. | The order of magnitude of hand-keying: about one field in three hundred, and the share each verification method recovers. | The field types. A report table cell with a decimal point and a significance marker is not a tick box or a date of birth. |
| Shelby-James et al., 2007, Trials | Parallel paper and handheld data capture by clinical nurses in a randomised trial. | The accepted benchmark of 10 errors per 10,000 fields for paper double data entry, and the warning about default values. | The setting. Nurses capturing data at the bedside are not a writer transcribing a finished export into a template. |
| Neither study | — | — | A per-field error rate for toxicology report drafting. We could not find one published; a laboratory that wants the figure has to measure its own. |
How much does double data entry catch, and what does it cost?
The same paper answers both halves, which is why it is worth reading rather than citing. Double entry performed by a different operator detected 88.3% of single-entry errors. Double entry by the same operator detected 69.0%. The reading-aloud method, where one person reads the keyed values while another follows the source, detected 59.5% with a different operator and 39.9% with the same one. The ordering is intuitive and the gaps are larger than most people guess: having the same person check their own work recovers barely two thirds.
The cost side is equally concrete. The total expended times were 74.8 hours for double entry and 57.9 hours for reading aloud, on the same body of forms. The authors' own conclusion is that reading aloud “is inferior to the DDE method, while its time cost is lower” — a trade, not a free choice. Applied to report writing, double-checking every number in a 2,000-number report roughly doubles the hours spent handling numbers and still leaves about one in nine of the original slips in the document.
That residue is the uncomfortable part. Checking is sampling with a very high hit rate, not elimination. If the first pass puts an expected 6.8 slips into a 2,000-number report, an independent second pass at 88.3% leaves about 0.8 — better, and not zero, and bought with a second full pass over every number.
What a transcription slip becomes at a GLP audit
It becomes a finding, because the Quality Assurance unit's job is precisely to compare the two documents. 21 CFR 58.35(b)(6) requires the unit to review the final study report and assure that the reported results accurately reflect the raw data of the study. A number that does not match is not a style point; it is the one thing the review exists to detect.
The agency's own summary of what it cites bears this out. Among the common Good Laboratory Practice inspectional observations in its fiscal year 2024 metrics, the FDA lists “study director failed to assure that all experimental data, including observations of unanticipated responses of the test system, were accurately recorded and verified”. The duty named there is 21 CFR 58.33(b), and it belongs to the study director — the person whose signature is on the report, not the person who typed the table.
Where a slip reaches the raw data rather than the report, the handling is prescribed too: 21 CFR 58.130(e) requires that any change in entries “shall be made so as not to obscure the original entry, shall indicate the reason for such change, and shall be dated and signed or identified at the time of the change”. A corrected number is a dated, attributed, visible correction — never a silent overwrite. In the sample team's own figures, a report built by hand drew 4.6 Quality Assurance findings for transcription, against a design target of 0.3; both are the solution's own numbers on its own sample studies, not an industry rate.
The errors a second reader does not catch
Three kinds survive review reliably, and they are not random keystrokes.
The first is the plausible digit. A reviewer comparing 14.12 with 14.21 is comparing two numbers that both look like liver weights; the eye accepts them. Kawado's 88.3% is the detection rate for errors as a class, and the ones that hide are the ones that look right.
The second is the wrong row. Transposing two groups' means, or reading week 3 where week 4 was meant, produces numbers that are all individually correct and collectively wrong. Checking cell against cell catches it only if the checker also checks the label, which is a different act of attention.
The third is the stale number. A table is corrected and the sentence that quotes it is not, or the summary keeps the figure the results section has since changed. Nothing is mistyped — the document simply disagrees with itself. This is the error a table-by-table check misses, because a reviewer who checks the tables against the raw data often checks the summary only against the results section, and the two agree with each other.
Where one wrong key ends up, and which check would have caught it
| Where the number sits | What it is | What a check against the raw data sees |
|---|---|---|
| Raw data cell | The measured value, recorded contemporaneously and signed for by the person who took it — the only number in the chain that was observed. | Nothing to check: this is the reference. A change here needs a dated, attributed correction under 21 CFR 58.130(e). |
| Report table cell | The value re-keyed into the house template, with the precision rule and the significance marker applied. | A mismatch, if the checker compares the label as well as the value. |
| Results sentence | The group mean quoted in prose, usually beside the control value. | A mismatch — but only if the sentence is checked too, and many reviews stop at the tables. |
| Derived percentage | The change against control, calculated from the two quoted numbers. | Nothing. The arithmetic is right; it is the inputs that are wrong, and the document does not record which cells were meant. |
| Summary and conclusion | The figure that reaches the reader who will never open an appendix, and the dose statement built on it. | Nothing, if the summary was written from the results section rather than from the raw data. |
Why the derived number is the dangerous one
A percentage change is the most-read number in a toxicology report and the hardest to audit, because it is not in the raw data at all. It is calculated from two cells, and a checker who verifies that the arithmetic is right has verified nothing about the inputs. If the treated mean was keyed a digit short, the percentage is wrong, internally consistent, and quoted in the summary.
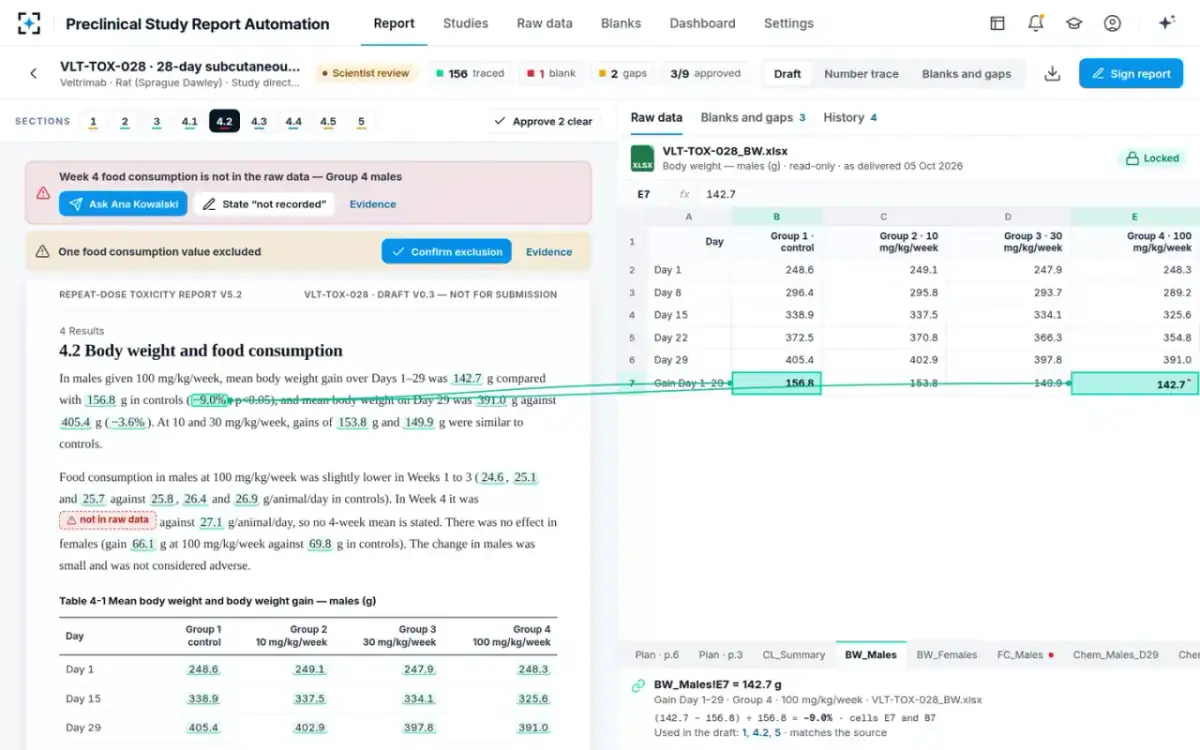
In the sample study, male body weight gain over days 1 to 29 at the top dose was 142.7 g against 156.8 g in controls, a fall of 9.0%. Pointing at that −9.0% in the draft lights both source cells — E7 and B7 of the body weight sheet — along with the calculation and every section that uses them: the summary, the results section and the conclusion. The check available to the study director is therefore not “does the arithmetic work” but “are these the right two cells”, which is the question that actually has an answer.
One derived number, both its source cells, and everywhere it is used
Removing the keystroke instead of checking it twice
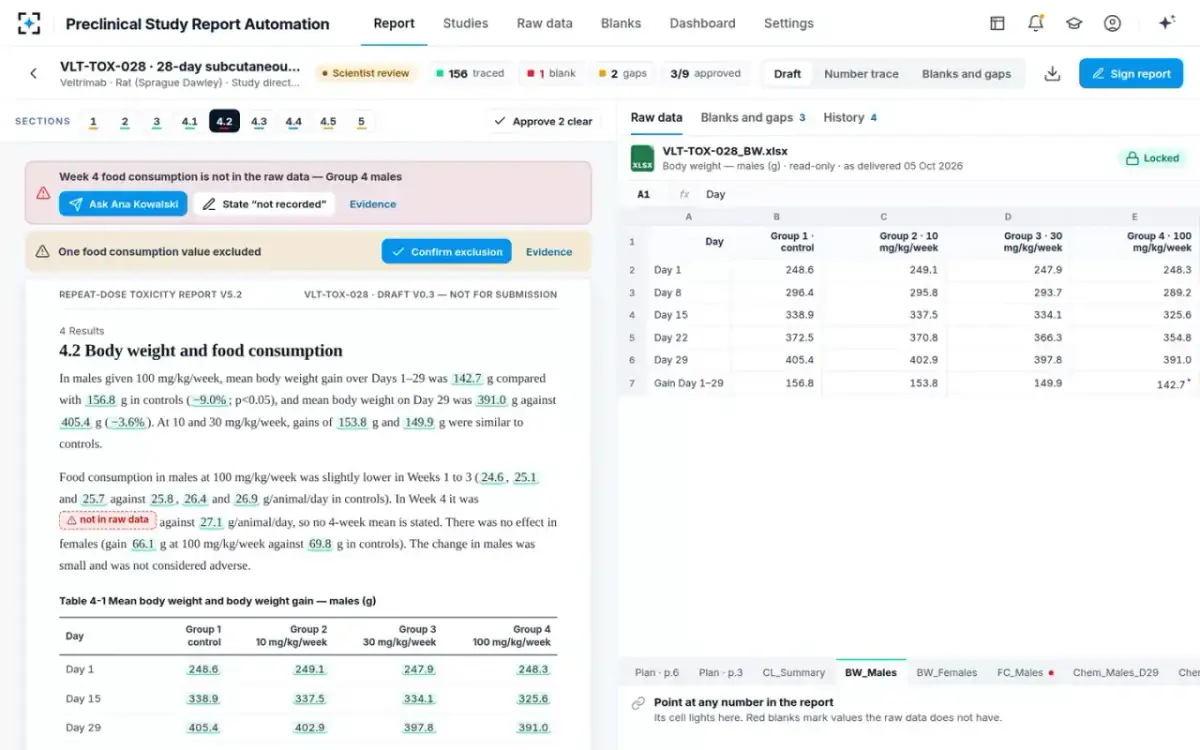
The MHRA sentence quoted earlier offers two routes for manual transcription: a second person, or a validated system. Most laboratories take the first because it needs no change to the toolchain, and then spend the hours. The second route is different in kind, because it removes the class of error rather than sampling it: if the number in the report is a reference to a cell rather than a copy of its contents, there is no keystroke to go wrong, and the question “does this match the raw data” has become true by construction rather than true by inspection.
Two ways to get 4,000 numbers into a report without getting them wrong
Re-key, then check twice: Reads the export, types the value into the table, applies the precision rule and the significance marker.
Carry a reference to the source cell: Chooses the source sheet and the statistic; the table is built cell by cell from it with the house precision rule applied.
Re-key, then check twice: Every keystroke, plus every re-use of the value in text, summary and conclusion.
Carry a reference to the source cell: In the mapping of a sheet to a report table — one decision to check, not several thousand.
Re-key, then check twice: A second person comparing two documents, recovering about 88% of slips at roughly the cost of the first pass.
Carry a reference to the source cell: Re-reading every number against the cell it points at, which is arithmetic rather than attention.
Re-key, then check twice: Two inputs to verify and an arithmetic step, with nothing in the document recording which cells were meant.
Carry a reference to the source cell: The calculation and both source cells travel with the number; checking it is opening it.
Re-key, then check twice: Every place the value was used has to be found again, by memory or by search.
Carry a reference to the source cell: The sections fed by that cell are known, and only those are redrafted.
Re-key, then check twice: The interpretation, after the arithmetic — usually with less time for it than planned.
Carry a reference to the source cell: The interpretation, the adversity call, the conclusions and the signature.
Two honest limits. A reference removes transcription error; it does not remove a wrong mapping, so the first table a new template produces still deserves a careful human read. And it does nothing about a value that is wrong in the raw data itself, which is a different problem with a different answer — what to do when a value is missing or wrong at source takes that one. What signature covers which claim, once the draft is finished, is in the guide to the compliance statement and the signatures.
The draft and the locked export, side by side in Preclinical Study Report Automation
How to measure your own report's transcription rate
Nobody has published a per-field error rate for toxicology report writing, so the only defensible figure for your laboratory is your own. It is a half-day exercise on a closed study, and the result is worth more in a resourcing conversation than any borrowed percentage.
A five-test audit of your own transcription rate, on one closed study
- Count the numbers in the report, honestly
Every table cell, every figure quoted in the text, the summary and the conclusion, and each percentage change. Count re-uses separately — they are separate keystrokes.
- Draw a random sample across the whole document, not just the tables
Stratify by section so the summary and conclusion are represented; those are the numbers a reader is most likely to carry away.
- Check each sampled number against the raw data cell, with its label
The label matters as much as the value: a right number from the wrong group or the wrong week is the error a value-only check cannot see.
- Classify what you find, not just how much
Plausible digit, wrong row, stale after a correction, rounding against house style. The mix tells you which check to add; the count alone does not.
- Record the hours the second check took
A detection rate without its cost cannot be compared with anything. Kawado and colleagues reported 74.8 hours for double entry against 57.9 for reading aloud on the same forms.
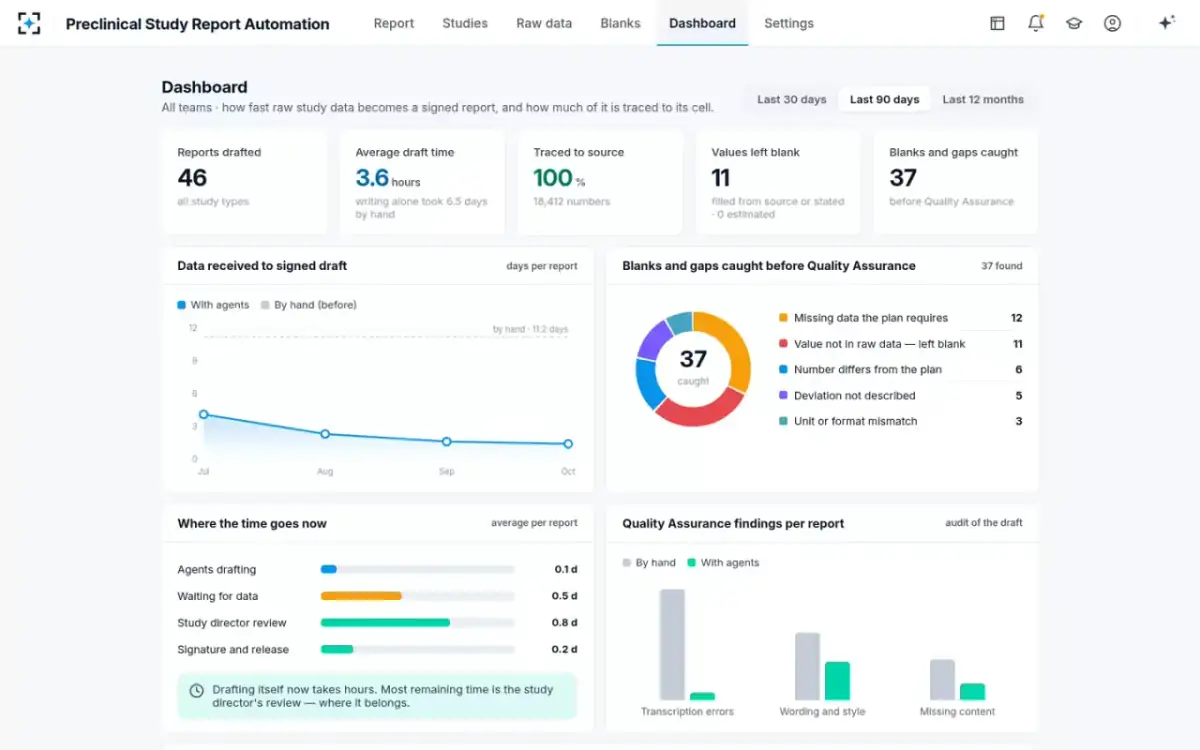
What a team tracks once the keystroke is gone
To see a report whose every number points at the cell it came from, start from Preclinical Study Report Automation.
Questions people ask
How many numbers are in a toxicology study report?
For a repeat-dose study, somewhere between a few hundred and several thousand once re-uses are counted. The sample team's own range is 400 to 4,000 across 10 to 20 tables, and the sample 28-day study carried 166 traced numbers in nine sections for ten animals per sex per group. Reports with individual animal data in appendices run far higher.
How does double data entry reduce errors?
By having the same source entered twice and comparing the two, so a slip in one pass shows up as a mismatch. Kawado and colleagues measured 88.3% of single-entry errors detected when the second entry was done by a different operator, and 69.0% when it was the same operator. It costs roughly a second full pass: 74.8 hours against 57.9 for the cheaper reading-aloud method on the same forms.
What happens when a transcription error is found at a GLP audit?
It is raised as a finding, because 21 CFR 58.35(b)(6) requires the Quality Assurance unit to assure that the reported results accurately reflect the raw data. If the report has already been signed, correcting it means an amendment by the study director under 58.185(c) rather than a quiet re-issue. The FDA's fiscal year 2024 metrics list failure to assure that data were accurately recorded and verified among its common GLP observations.
Why do transcription errors get missed in review?
Because the ones that survive are the plausible ones. A digit swap inside a realistic range looks like a result; a value read from the wrong row or the wrong week is individually correct; and a figure left stale after a table was corrected contradicts nothing a reader can see. A careful check of the tables against the raw data catches the first two; only a check that also takes every sentence back to the raw data catches the third.
How do you check numbers in a study report against raw data?
Either with a second person comparing the document to the export field by field, which is what MHRA's guidance asks for where manual transcription occurs, or by not transcribing: inserting each number as a reference to its file, sheet and cell so the comparison is mechanical. In the sample study every number in the draft carries its source, and any mismatch stops the signature.
Is a rounding difference a transcription error?
Not usually, but it produces the same finding. If a table states a mean to one decimal and the summary quotes it to two, or one section follows house style and another does not, the document disagrees with itself and an auditor must resolve it. The fix is a single precision rule applied where the number is produced rather than where it is typed.