Transaction vs holdings based attribution is a question of what the calculation can see. Holdings-based attribution takes the portfolio's positions at the start of each period and applies the period's returns, so any trade made during the period, and the price it was made at, is invisible. Transaction-based attribution follows each trade at its own price and date, so buying, selling and cash flows within the period are scored. The difference shows up as a residual: the part of the portfolio's real return that the holdings-based effects do not add up to. A residual of a few basis points looks reassuring, but it can hide errors that cancel each other out, which is why Botminds' Performance Attribution Analysis checks every figure in an answer against the official returns before anything is explained.
The worked trade below is illustrative arithmetic, built to show the mechanism; the strategy figures quoted later come from the solution's sample data, on the fictional Quillfield Capital and its Global Equity strategy.
One mid-quarter sale: what a holdings snapshot sees, and what actually happened
What is holdings based attribution, and what can't it see?
Holdings-based attribution is the Brinson calculation run on positions as they stood at the start of each period, typically each day or each month, with the period's security returns applied to them. It is simple, it needs only holdings and prices, and over short periods with little trading it is accurate. Over a month, or in a strategy that trades actively, it attributes the whole period's return to the starting weights, so a position cut in the middle of the month is scored as if it had been held to the end.
Central bank reserve managers raised the same limit in their own reporting two decades ago. A paper by the Central Bank of Brazil's risk team in a 2004 European Central Bank volume, summarising earlier work by Dynkin and colleagues and by Ramaswamy, noted that a model "which assumes a static portfolio over the reporting period and does not account for intra-period trading and cash flows in and out of the portfolio constrains the ability to analyse actively traded portfolios", and that "many of the existing software platforms do performance attribution on the basis of securities held at the beginning and end of the month" (de Almeida da Silva Junior, in Risk Management for Central Bank Foreign Reserves, ECB, 2004).
Transaction based performance attribution: what the trades add
Transaction-based attribution captures each purchase and sale at its execution price and time, and scores the position at the weight it actually had while it was held. The difference it captures is often called a trading or timing effect: in the illustration above, the 14bp the manager lost by selling after the fall rather than before it. It needs more data, the full transaction history with prices, fees and settlement dates, and more processing, but it is the only form in which a quarter's effects can add up to the return the client actually earned. The trading effect is not the same as the cost of trading measured against an arrival price, which is implementation shortfall, a trading desk's measure. Plan committees face the same choice of lens when they check a manager's style: returns-based vs holdings-based style analysis.
Holdings-based and transaction-based attribution, side by side
Holdings-based: Positions at the start of each period, security and benchmark returns.
Transaction-based: Positions plus every trade with its price, time, fees and settlement, and cash flows.
Holdings-based: What was held at each snapshot.
Transaction-based: What was held at every moment, and the price paid or received.
Holdings-based: Intra-period trades, trading costs, cash flows within the period.
Transaction-based: Little, if the transaction data and prices are complete.
Holdings-based: Appears when trading within the period matters; grows with turnover and period length.
Transaction-based: Close to zero by construction; a residual signals a data problem.
Holdings-based: Low-turnover strategies, daily snapshots, index-like portfolios.
Transaction-based: Active strategies, fixed income with frequent trading, funds with large flows.
Why does attribution have a residual?
Attribution has a residual when the effects it calculates do not add up to the difference between the portfolio's official return and the benchmark's. The usual causes are trades inside the period, cash flows, fees and accruals treated differently in the attribution and the official return, prices from different sources, and the way daily or monthly effects are combined into a quarter. Some systems report the leftover as its own line; others force it into an effect.
Národná banka Slovenska's reserve managers described the two schools in the same ECB volume: "there are simple models based on complete decomposition of return without any residual variable. On the other hand, many institutions use very complex and sophisticated procedures. These systems typically use a residual variable for calculating an unexplained proportion of returns of the decomposition procedure" (Simicak and Zajac, ECB, 2004). A model with no residual has not explained everything; it has put the unexplained part somewhere, for example into a selection effect calculated as the remainder.
In fact, performance attribution in a dynamic portfolio cannot exactly identify each source of return. Since deals during the intra-period do not permit an exact calculation, the performance attribution approach is a sort of “differential return sharing”.
de Almeida da Silva Junior, Central Bank of Brazil, in Risk Management for Central Bank Foreign Reserves (ECB, 2004)
A small residual is not proof: errors that cancel
A residual is a single number for the whole portfolio, and errors of opposite sign cancel inside it. A holdings-based report can misattribute 14bp in one sector and 13bp the other way in another, and show a residual of 1bp. Every sector line is wrong by more than a typical materiality threshold, and the total looks clean. Valid in sum, inaccurate in every row that a commentary will quote.
Two timing errors, one tidy residual: every row wrong, the total almost right
| Sector | What happened | Holdings-based effect | Transaction-based effect | Error in the row |
|---|---|---|---|---|
| Health Care | Cut a position after it fell, missed the rebound | −36bp | −50bp | 14bp too kind |
| Industrials | Bought into a dip before the recovery | +20bp | +33bp | 13bp too harsh |
| Portfolio residual | Reported return minus the sum of effects | −1bp |
That is why the test of an attribution report is not the size of its residual but whether its sector effects reconcile to independently calculated sector returns, and whether its effects for each sub-period link to the official return for the whole period. A residual is a symptom; reconciliation is the test.
What is the return gap? Evidence from 2,500 funds that unseen trades matter
The return gap is the difference between a fund's reported return and the return of its previously disclosed holdings, adjusted for expenses: the part of performance that a holdings snapshot cannot see. Marcin Kacperczyk, Clemens Sialm and Lu Zheng defined it in a study of more than 2,500 US equity mutual funds from 1984 to 2003, as "the difference between the reported fund return and the return of a portfolio that invests in the previously disclosed holdings after adjusting for expenses" (NBER Working Paper 11766; published in the Review of Financial Studies 21(6), 2008).
Their findings matter for anyone reading a holdings-based report. The gap was not noise: they document "substantial cross-sectional heterogeneity and time-series persistence in the return gap", showing that "unobserved actions of some funds persistently create value, while such actions of others destroy value", and that the return gap "helps to predict future fund performance." In attribution terms, what happens between snapshots is a real, repeatable part of a manager's results, and a report that cannot see it is leaving out something a consultant may want to know.
Multi period performance attribution: why quarters don't add
Arithmetic attribution effects add up exactly within one period, but not across periods, because returns compound and differences do not. In the solution's sample, Global Equity led its benchmark by 31bp in the first quarter of 2026 and by 23bp in the second, then trailed by 142bp in the third, all before fees. Adding the quarters gives −88bp. The year-to-date gap the solution reports, compounding the returns, is −97bp.
The 9bp difference is not an error in any quarter; it is the arithmetic of compounding. A quarter's effects are measured on a larger or smaller base depending on what happened earlier in the year, so the same 142bp shortfall is worth more after two good quarters than it would be in isolation. A peer-reviewed description of the Brinson model notes why this cannot be ignored: "In practice, analyzing a single-period portfolio is meaningless as portfolio managers and their clients are more interested in the performance of a portfolio over multiple periods" (Lu and Kane, The R Journal, 2013).
Global Equity, 2026 to date: the quarters sum to −88bp, the year compounds to −97bp
| Period | Gap to benchmark, before fees | How it is combined |
|---|---|---|
| Q1 2026 | +31bp | Official quarterly attribution |
| Q2 2026 | +23bp | Official quarterly attribution |
| Q3 2026 | −142bp | Official quarterly attribution |
| Simple sum of the quarters | −88bp | Adds differences that were measured on different bases |
| Year to date, compounded | −97bp | Portfolio and benchmark returns compounded, then compared |
| Linking difference to distribute | −9bp | Shared across the quarters' effects by a linking method |
Carino linking method and the alternatives
A linking method distributes the compounding difference across the periods' effects so that they add up to the multi-period gap. David Cariño's "Combining Attribution Effects over Time" (Journal of Performance Measurement, 1999) and José Menchero's optimized linking (2000) are two published ways to do it; both adjust each period's effects so that, added together, they equal the compounded gap. The R Journal paper describes the choice for multi-period Brinson as "three methods for this – arithmetic, geometric, and optimized linking" (Lu and Kane, 2013).
The choice matters less for the total, which every method forces to the right answer, than for the effects a commentary quotes. Two systems that link differently can show different sector effects for the same year from the same quarterly figures. The Central Bank of Brazil's paper made the same point about fixed income effects, which "may not be compounded on a geometric or arithmetic basis, and so some calculus approximation is necessary, such as a normalisation procedure" (ECB, 2004). An answer for a year should quote the official linked figures, not a sum of quarters typed from three reports.
Geometric vs arithmetic performance attribution: −142bp or −138bp?
Arithmetic attribution explains the difference between two returns; geometric attribution explains their ratio. For Global Equity's third quarter, the arithmetic gap is 1.84% − 3.26% = −142bp. The geometric excess is 1.0184 ÷ 1.0326 − 1 = −1.375%, or about −138bp: what the portfolio earned per dollar the benchmark would have earned. Both are correct; they answer slightly different questions.
Geometric excess returns compound across periods, because ratios do, so they link without a leftover. Arithmetic attribution is easier to explain and is the natural reading of "by how many basis points did you lag?" The rule for an answer is consistency: the gap quoted in the first sentence and the effects quoted after it must come from the same method, and the method should match the firm's official report. A −142bp headline explained with geometric effects that sum to −138bp invites the question nobody wants on a board call.
Reconcile first, explain second: how Performance Attribution Analysis uses the official returns
The solution never calculates its own attribution. Its Attribution reader takes the official grid from the performance measurement system, along with the period status, and its Consistency agent ties every figure an answer quotes back to the official, signed-off returns within a 0.5bp tolerance. In the Global Equity sample the grid is calculated daily, and its effects add to the official gap: allocation −39, selection −94, interaction −1 and currency −8, or −142bp.
A daily Brinson-Fachler grid whose effects add to the official gap
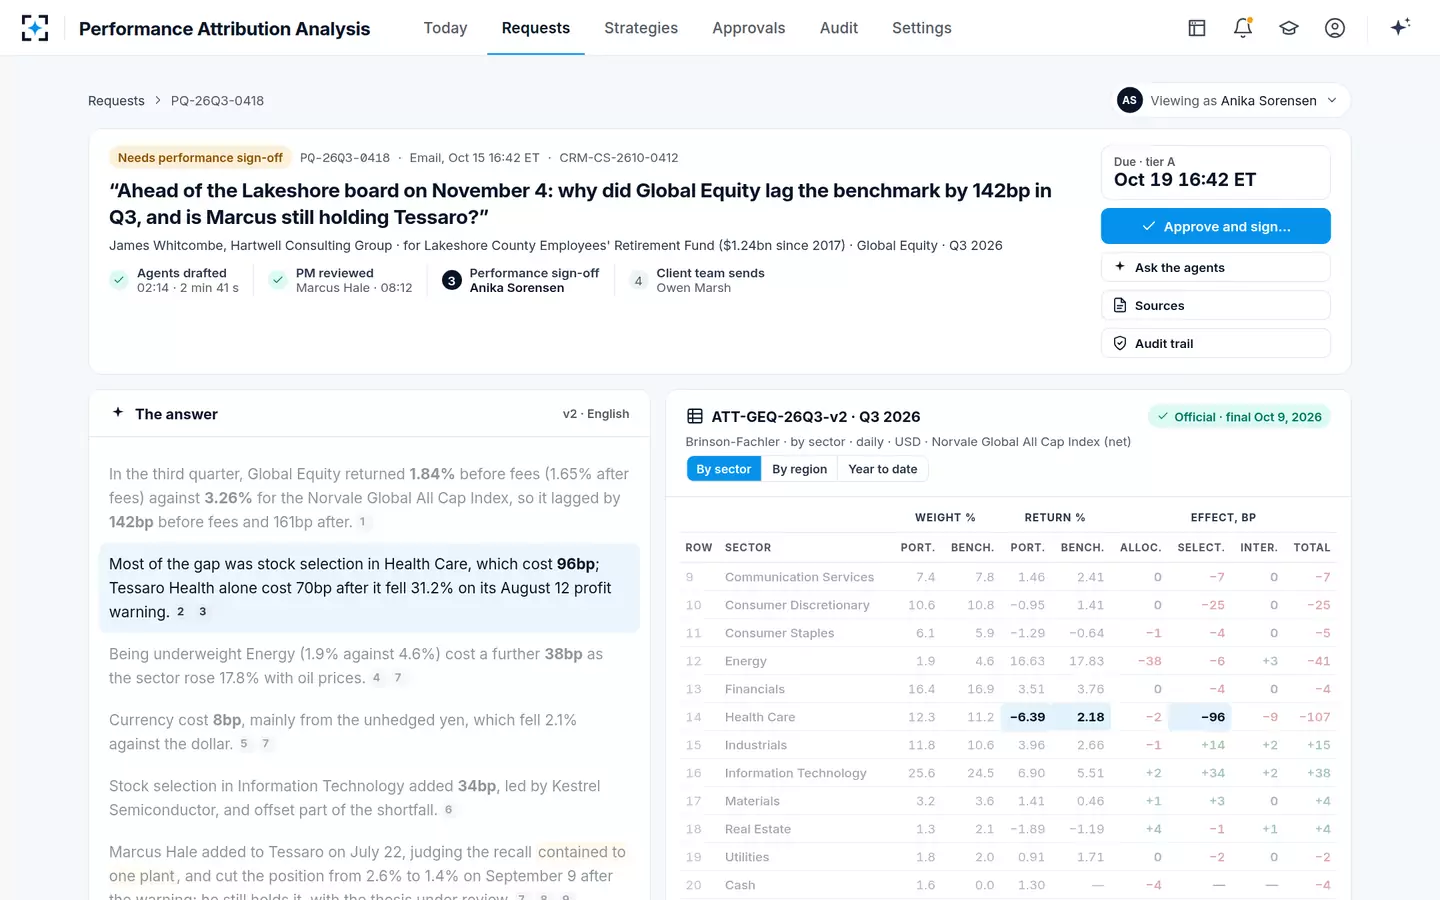
The context the grid cannot give comes from elsewhere. In the sample, the Context reader found two Tessaro Health trades in the blotter, alongside the portfolio manager's notes on adding to the position in July and cutting it from 2.6% to 1.4% on September 9. A monthly holdings-based report would have scored the position at its September 1 weight for the whole month, as if the cut had not happened; the trades say when, and the notes say why.
Before trusting an attribution report's residual, test these
- Effects add to the official return, not to the system's own
Reconcile to the signed-off portfolio and benchmark returns for the period.
- Sector effects reconcile to sector returns
A clean total can hide offsetting errors; check the rows an answer will quote.
- The snapshot frequency matches the turnover
Monthly holdings for a strategy that trades daily will leave timing effects unexplained.
- Linking is the official method
Year-to-date effects should come from the linked report, never from summed quarters.
- Arithmetic and geometric are not mixed
The headline gap and the effects that explain it use one method.
- Restated periods replace old figures everywhere
A restatement changes the effects too; every sent answer that quoted them needs a correction.
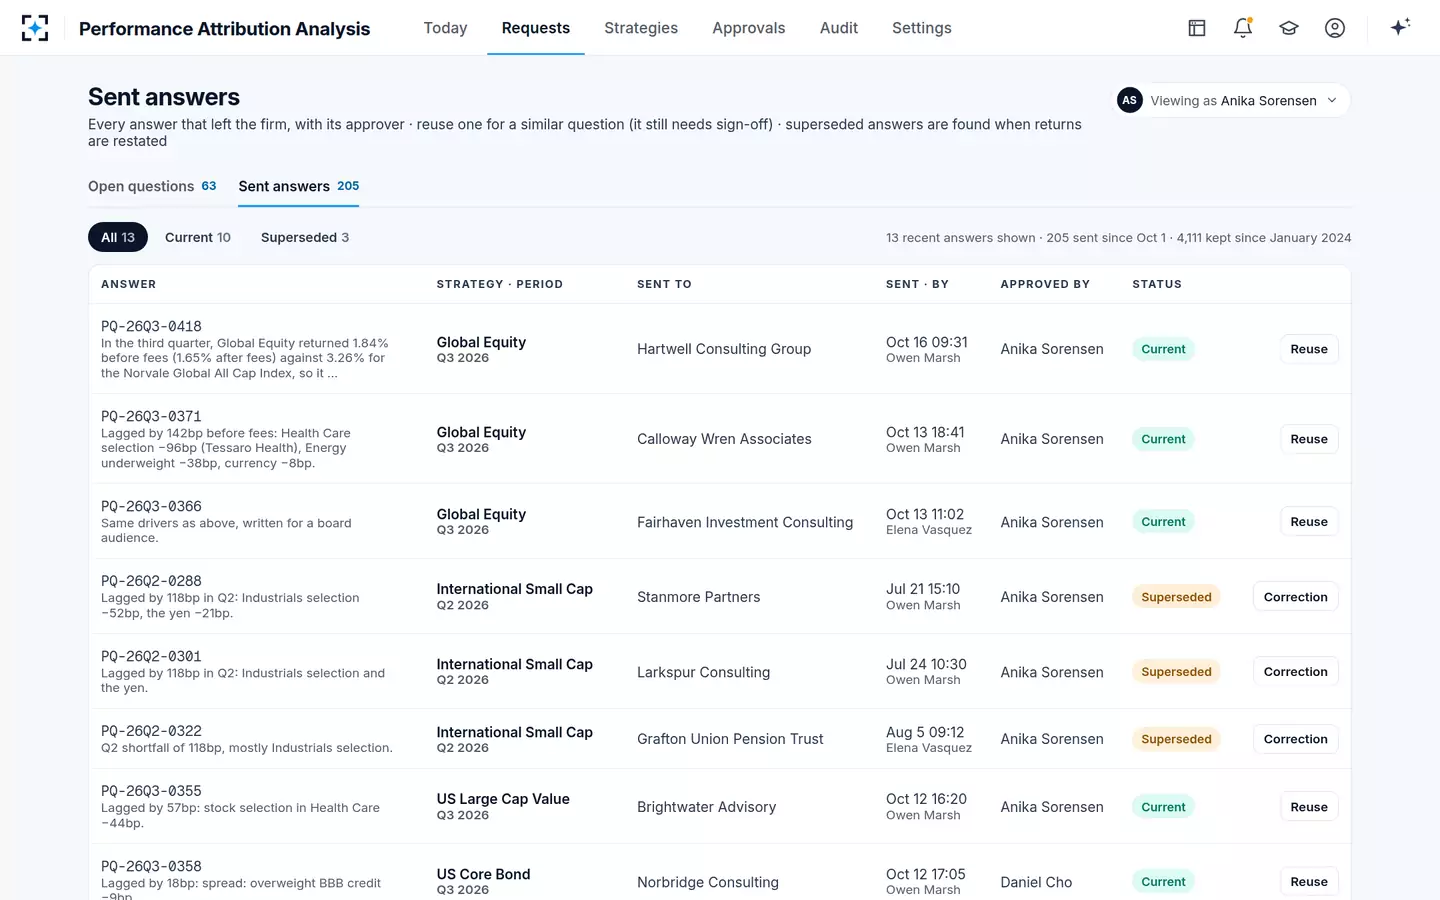
The last check is the one that reaches clients. In the sample, International Small Cap's second quarter was restated in October after a spin-off was booked late, moving its gap from −118bp to −137bp, and the solution found the three answers already sent that quoted the old figure and drafted corrections for the head of performance to approve.
Sent answers in Performance Attribution Analysis, and the ones a restatement made wrong
How the effects in a single grid are calculated is worked through in the performance attribution analysis example, and how a bond model's selection line can absorb the same timing effects is in fixed income attribution models. The agents and checks are at Performance Attribution Analysis.
Questions people ask
Is transaction-based attribution always better?
It is more complete, not always more useful. For a low-turnover strategy measured daily, holdings-based attribution is nearly identical and needs far less data. For an active strategy, a fixed income book that trades often, or a fund with large flows, transaction-based attribution is the only way the effects will add up to the client's actual return.
What residual is acceptable?
No regulator sets one; firms set their own tolerance, and the solution's own tie-out tolerance for figures in an answer is 0.5bp. The more important test is that the rows an answer quotes reconcile, because a small total residual can hide larger offsetting errors.
What is a trading or timing effect?
It is the part of return that comes from when trades were made within the period: buying before a rise or selling after a fall. Transaction-based attribution measures it; holdings-based attribution leaves it in the residual or in selection.
Does daily holdings-based attribution solve the problem?
Mostly, for equities. A daily snapshot means a trade is mis-scored for at most one day, which is why a daily grid usually reconciles closely. Intraday trading, trading costs and cash flows still need transaction data to be measured exactly.
Can the return gap be calculated from public data?
For US mutual funds, roughly, from the holdings funds disclose in their regulatory filings and their reported returns, which is how Kacperczyk, Sialm and Zheng built theirs. For a separate account or a firm's own strategies, the firm already has better data: its full transaction history.