The interaction effect in performance attribution is the part of a sector's excess return that comes from holding a different weight of the sector and picking different stocks inside it at the same time: the weight difference multiplied by the return difference. It exists because allocation is scored at the index's sector return and selection at the index's sector weight, so the product of the two gaps is left over. In one sample quarter it was −9 basis points (bp) in Health Care and −1bp across the whole portfolio, and it is the one number in an attribution report that no single decision produced. Botminds' Performance Attribution Analysis drafts answers to "why did we lag?" from the official attribution; it shows interaction when the report does, and only gives it a reason when the portfolio manager's own notes contain one.
The figures on this page come from the solution's sample data: Global Equity, a fictional strategy of the fictional Quillfield Capital, third quarter of 2026, against the fictional Norvale Global All Cap Index. Its attribution report shows allocation −39bp, selection −94bp, interaction −1bp and currency −8bp, a total of −142bp.
Where the interaction effect sits: one sector holds almost all of it
What is the interaction effect in performance attribution?
The interaction effect is the joint result of a weight decision and a stock decision in the same sector. A peer-reviewed description of the Brinson model puts it plainly: after allocation and selection, "The residual can then be attributed to an interaction between allocation and selection – the interaction effect" (Lu and Kane, The R Journal, 2013). Arithmetically it is a cross term, the product of two differences, and it appears in any attribution that scores the two decisions one at a time.
That definition matters for the reader of a report more than for the person who calculates it. Allocation answers "what did the weights do, if we had held the index's stocks?" Selection answers "what did the stocks do, if we had held the index's weights?" Interaction answers neither question. It is what happened because the manager did both, and the manager may not have decided to do both on purpose.
The interaction effect formula, worked on one row
The formula is the weight gap times the return gap: (portfolio weight − benchmark weight) × (portfolio sector return − benchmark sector return). In the sample, Health Care was 12.3% of the portfolio and 11.2% of the index, a gap of +1.1 points. The portfolio's Health Care stocks returned −6.39% against 2.18% for the index's, a gap of −8.57 points. Interaction is 1.1% × −8.57%, or −0.094%: −9bp.
Set beside the other two effects in the same row, the interaction cell is small, which is typical. Selection, the index weight times the return gap, is 11.2% × −8.57% = −96bp. Allocation, the weight gap times the sector's return relative to the whole index, is 1.1% × (2.18% − 3.66%) = −2bp. The three add to −107bp, the row total. Interaction is less than a tenth of it, but it is not zero, and it has a sign a reader can misread.
Why is there an interaction effect at all? The 2×2 behind every row
There is an interaction effect because a row is built from two weights and two returns, and four combinations of them. The decomposition Brinson, Hood and Beebower published in 1986 (Financial Analysts Journal 42(4)) can be laid out as a grid of those four: the benchmark's weight and return in one corner, the portfolio's in the opposite corner, and a mixed combination in each of the other two. Each effect is the move from one corner to another, and the cross term is what the two single moves do not account for.
The Health Care row as four contributions: interaction is the corner the two single moves miss
A +24bpthe benchmark
C −72bpselection only
Fund weight, 12.3%B +27bpweight only
D −79bpwhat the fund held
Read the grid as two routes from A to D. Changing the stocks first (A to C) costs 96bp; then changing the weight (C to D) costs another 7bp, because the extra 1.1 points were invested in stocks that fell. Changing the weight first (A to B) gains 2bp, because the extra weight went into stocks that, in the index, rose; then changing the stocks (B to D) costs 105bp. The order changes the story. Interaction is the 9bp that the two orderings disagree about, and attribution conventions exist to decide who gets it.
Can the interaction effect be negative? Four signs, one rule
Yes: the interaction effect is negative whenever the weight gap and the return gap point in opposite directions. Overweight a sector whose stocks lagged the index's, as Health Care did here, and interaction is negative: more money went into worse stocks. Underweight a sector whose stocks beat the index's, and it is negative too: less money went into better stocks.
The positive cases are less intuitive. Energy in the sample was underweight by 2.7 points and its stocks trailed the index's by 1.2 points, and interaction was +3bp. The manager did not pick well in Energy; he simply held less of the stocks he picked badly, and the formula credits that. A commentary that called the +3bp "skill in Energy" would be describing an accident of two separate decisions as if it were one good one.
The interaction sign follows the two gaps, not the quality of either decision
| Weight gap | Stocks vs the index's | Interaction | In the sample |
|---|---|---|---|
| Overweight | Better | Positive | Industrials +2bp, IT +2bp |
| Overweight | Worse | Negative | Health Care −9bp |
| Underweight | Better | Negative | Materials, under 1bp |
| Underweight | Worse | Positive | Energy +3bp, Real Estate +1bp |
Brinson-Fachler and the interaction effect: three conventions, one total
Firms deal with the cross term in one of three ways, and all three give the same row total. Some Brinson-Fachler implementations do not report it at all: a 2024 paper on AI agents for attribution notes that "In the Brinson-Fachler methodology the Interaction Effect is added to the Selection Effect" (de Melo and Sheikh, arXiv 2403.10482, not peer reviewed). Others show it as its own column, as the sample report does. A third choice folds it into allocation instead.
Health Care under three conventions: the row is always −107bp, the story is not
| Convention | Allocation | Selection | Interaction | What a reader concludes |
|---|---|---|---|---|
| Shown separately | −2bp | −96bp | −9bp | Stock picking cost 96bp; holding a little more of it cost a further 9bp. |
| Folded into selection | −2bp | −105bp | — | Stock picking cost 105bp. |
| Folded into allocation | −11bp | −96bp | — | The overweight cost 11bp, and stock picking 96bp. |
Each convention is defensible, and each changes the sentence. Folded into selection, the stock pickers carry 105bp. Folded into allocation, the person who set the sector weight carries 11bp instead of 2bp. The argument for folding into selection, quoted in the same paper from Carl Bacon's 2019 history of the method, is that "combining selection with interaction allows the analyst to appropriately measure the impact of both the asset allocation and security selection decisions in the investment process." It is a reasonable choice for a manager whose stock picks and sector weights come from the same bottom-up process. It is a poor one where a strategist sets the weights and analysts pick the stocks, because it charges one of them for a joint outcome.
Should interaction be shown separately?
Show it separately when the people reading the report hold different people responsible for weights and for stocks, or when interaction in a sector is large enough to change the sentence. Fold it, and say so in the report's notes, when one person or process owns both decisions and the reader will not act on the split. What does not work is folding it in one report and showing it in another for the same strategy, because the selection figure will then differ between the factsheet and the consultant's answer, and someone will ask why.
The size test is simple. In the sample, interaction is −1bp for the portfolio and −9bp in one sector against −96bp of selection there. Folding it into selection would change "96bp" to "105bp" in the answer's second sentence: a real difference in a figure a consultant will compare with the factsheet. Whichever convention a firm picks, the check that matters is that the factsheet, the commentary and every answer use the same one.
Who owns the interaction effect when two people made the decisions?
Nobody owns it, and a report should not pretend otherwise. In a single-manager fund the same person chose the Health Care weight and the Health Care stocks, so the interaction is theirs in the sense that both inputs were, but it is still not a decision they made. In a multi-manager or team structure, where an asset allocator sets the sector or manager weights and specialists pick within them, the interaction belongs to the overlap of two mandates, and assigning it to either is a judgment the firm makes once, in its attribution policy, not afresh in each commentary.
There is a second reason to be careful with it. Every effect in a Brinson report is an estimate built on a model, and the effect that absorbs the model's imperfections is usually the one calculated last. A performance team at the Central Bank of Brazil, describing its own framework, made the point about selection, which in its own fixed income framework was calculated as a remainder.
Finally, it is important to highlight the fact that, in general, selection effect is calculated as a difference result, so it comprises the results of the skill in selecting assets and all the errors owing to modelling approximations.
Antonio Francisco de Almeida da Silva Junior, Central Bank of Brazil, in Risk Management for Central Bank Foreign Reserves (ECB, 2004)
A folded interaction effect is the equity version of the same thing: a number that is partly skill and partly arithmetic, presented under a heading that sounds like skill. A firm that folds it should at least know how much of each sector's "selection" is the cross term before the selection figure is used to praise or blame anyone.
The reason nobody gave: how commentary misuses the leftover
The risk with interaction is not the arithmetic; it is the sentence written about it. Because no one decided it, there is no note, minute or trade that explains it, and a writer filling a paragraph will invent a reason. The temptation is greatest when it is positive.
Two sentences about the same cells: one invents a decision, one reports the arithmetic
A reason nobody gave: "We deliberately concentrated in Health Care where our conviction was strongest."
What the cells support: "Health Care selection cost 96bp; the fund's slight overweight added a further 9bp to that loss."
A reason nobody gave: "Our Energy positioning showed disciplined stock selection."
What the cells support: "The fund held less Energy than the index, which limited the cost of its Energy stocks lagging the index's."
A reason nobody gave: "Interaction effects were negligible, confirming our process."
What the cells support: Usually nothing: a −1bp total is below any sensible materiality line and need not be mentioned.
The first sentence on the left may even be true, but nothing in the report says so; only the portfolio manager's notes could. In the sample, the manager's July note, as the solution shows it, covers adding to Tessaro Health, the stock behind most of the Health Care loss, staying underweight Energy and leaving the yen unhedged. It states no sector-level conviction in Health Care. A commentary that turned a 9bp cross term into a statement of intent would be quoting a decision that is not on file, which is exactly the kind of sentence a consultant repeats to a board.
How Performance Attribution Analysis writes about an effect no one decided
The solution's Narrator agent binds every sentence to the attribution cells it relies on, and its Context reader quotes the portfolio manager's notes rather than paraphrasing them. Interaction cells are treated like any other: named only when they are material, and given a reason only if a note, minute or trade supplies one. When a material effect has no explanation on file, the agents ask the manager rather than writing one.
The answer and the grid side by side: the interaction column is visible, and no sentence claims it
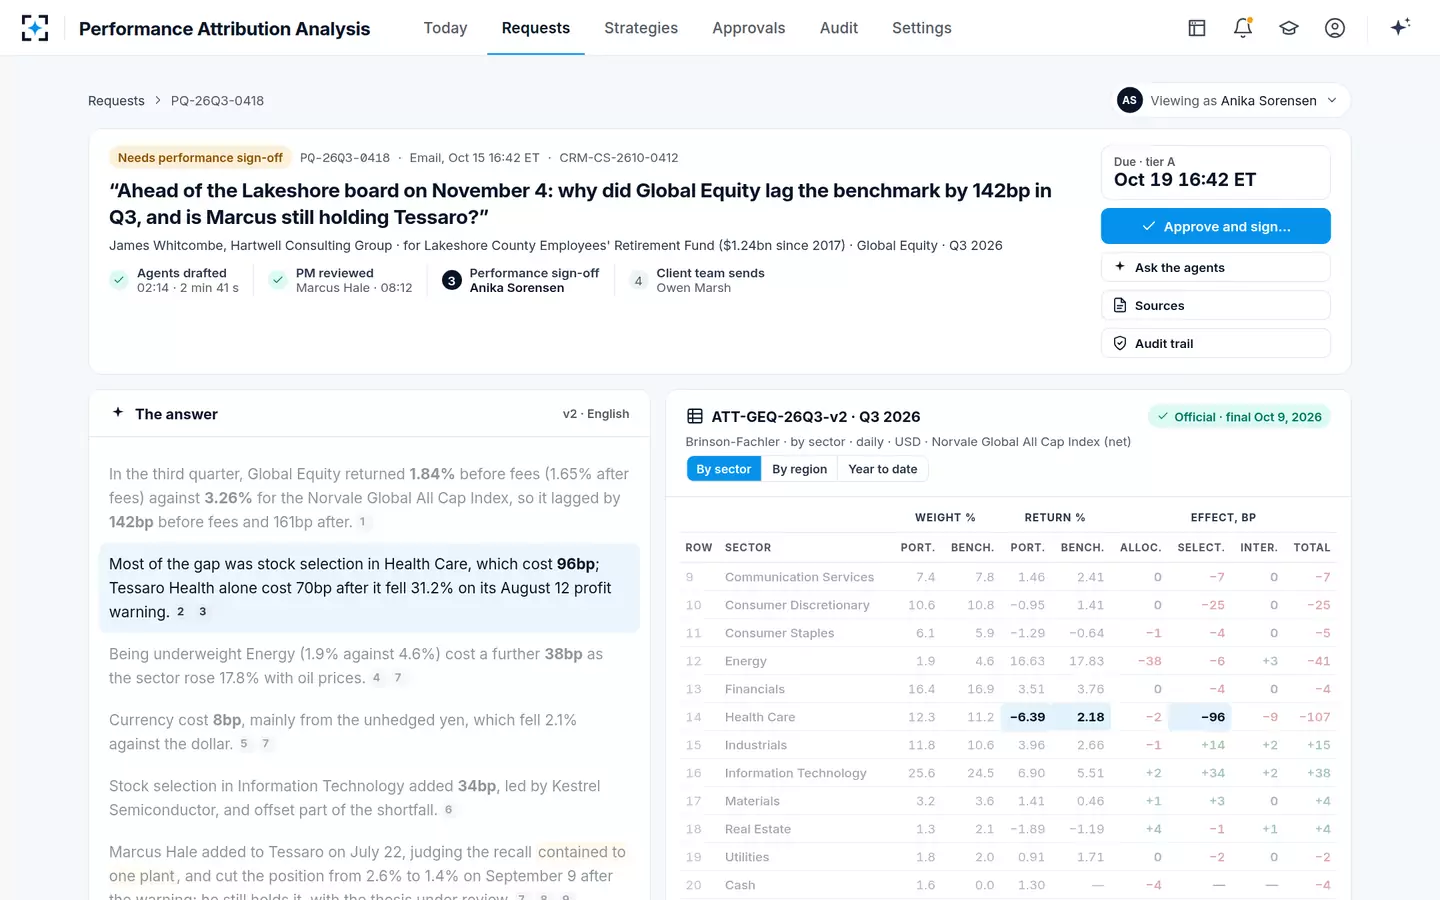
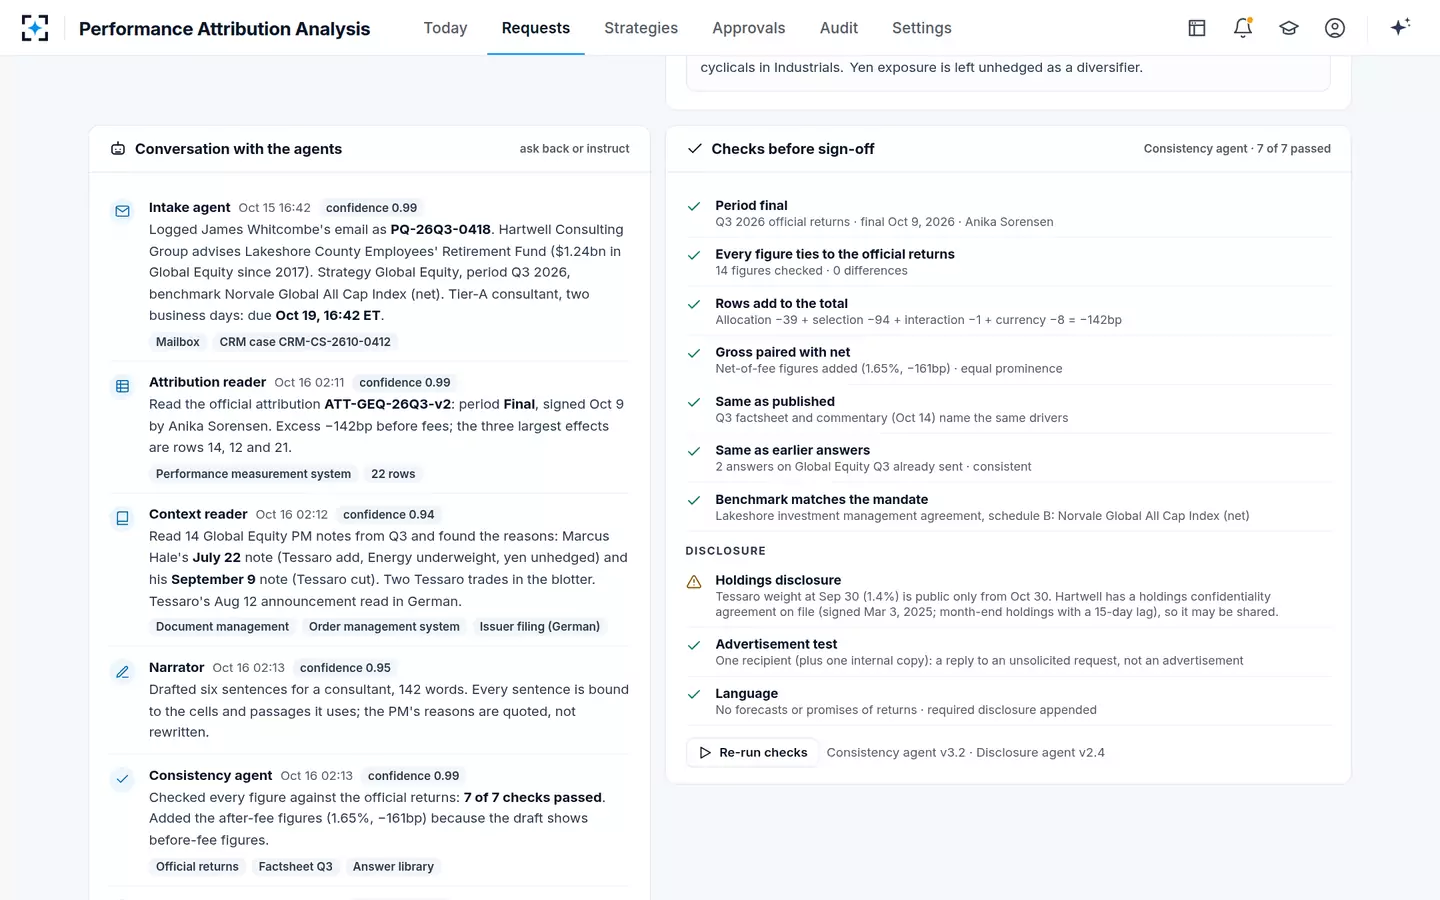
Before an answer can be signed, the Consistency agent checks that the effects it cites add up to the total with nothing double-counted or dropped. In the sample: allocation −39, selection −94, interaction −1 and currency −8, −142bp. That check is what catches an answer that quotes a folded selection figure from one source and a separate interaction figure from another, a mistake that adds 9bp of loss that never happened.
Seven checks in Performance Attribution Analysis before sign-off, including that the effects add to the total
How the full report is read cell by cell is set out in the performance attribution analysis example; why a small remainder in a report is not proof that it is right is the subject of what the residual hides. The agents, checks and sign-off are described at Performance Attribution Analysis.
Questions people ask
Is the interaction effect the same as the residual?
No. Interaction is an exact cross term, the weight gap times the return gap, and with it the Brinson effects add up to the active return precisely for a single period. A residual is an unexplained difference between the attribution total and the reported return, caused by trading within the period, pricing or linking, and it signals that the report does not fully reconcile.
Why is my interaction effect so large?
Because both gaps are large in the same sector: a big overweight or underweight combined with stocks that did very differently from the index's. A manager who runs concentrated sector bets with few holdings per sector will see large interaction cells; a sector-neutral manager will see almost none, because the weight gap is close to zero everywhere.
Does geometric attribution remove the interaction effect?
Not by itself. A cross term appears whenever a weight and a return both differ from the benchmark's, whether the effects are combined arithmetically or geometrically; geometric methods change how effects compound and link over time. Where the cross term is reported is still a convention the firm chooses.
How do I explain the interaction effect to a client?
As the extra gain or loss from holding a different amount of a sector whose stocks also did differently: "we held a little more Health Care than the index, and our Health Care stocks fell, so the overweight added 9bp to the loss." Avoid giving it a motive unless the manager's own notes state one.
Should a consultant care about the interaction effect?
Mainly to check consistency. A consultant comparing a manager's selection figure across reports needs to know whether interaction was folded in, because the same quarter can show −96bp or −105bp of selection depending on the convention, and the difference is not a change in skill.