Performance attribution vs contribution comes down to the question asked. Contribution to return answers "what did each holding or sector add to our return?": weight times return, adding up to the portfolio's own return, with no benchmark involved. Performance attribution answers "why did we beat or lag the benchmark?": it splits the gap between portfolio and benchmark into allocation, selection and interaction, and its cells add up to the active return. In one sample quarter Energy contributed +32 basis points (bp) to a fund's return and cost it 41bp against its index, so a sentence built from the wrong table says the opposite of the truth. Botminds' Performance Attribution Analysis drafts answers to "why did we lag?" from the official attribution, and keeps contribution figures out of sentences that need attribution.
The figures come from the solution's sample data: Global Equity, a fictional strategy of the fictional Quillfield Capital, in the third quarter of 2026, against the fictional Norvale Global All Cap Index. In local currency the portfolio returned 2.33% and the index 3.66%, a gap of 134bp before currency and fees.
The same portfolio, the same quarter: ranked by contribution, then by attribution
Contribution to return
What did each sector add to our return?
Information Technology+177
Financials+58
Industrials+47
Energy+32
Communication Services+11
Four smaller rows+6
Consumer Staples−8
Consumer Discretionary−10
Health Care−79
Adds to the portfolio's return+233
Performance attribution
Which decisions beat or lagged the index?
Information Technology+38
Industrials+15
Materials, Real Estate+8
Financials−4
Four smaller rows−18
Consumer Discretionary−25
Energy−41
Health Care−107
Adds to the active return−134
Contribution vs attribution, in one sentence each
Contribution measures a holding's share of the portfolio's return; attribution measures a decision's share of the portfolio's excess over its benchmark. Contribution is absolute and needs only the portfolio. Attribution is relative and is meaningless without a benchmark, because every one of its cells compares the portfolio with something else.
The two tables in the figure agree at the extremes and disagree in the middle. Information Technology tops both lists: it was a quarter of the portfolio and its stocks beat the index's. Health Care is at the bottom of both: the fund's Health Care stocks fell 6.39% while the index's rose 2.18%. Between those two, the rankings scramble. Financials was the second-largest contributor and a small loss in attribution. Energy was the fourth-largest contributor and the second-worst attribution line.
What is the contribution to return formula?
For a single period, the contribution to return of a holding or sector is its weight at the start of the period multiplied by its return over the period, and the contributions add up to the portfolio's return. Energy held 1.9% of Global Equity and returned 16.63%: 1.9% × 16.63% = 0.32%, or +32bp. Information Technology held 25.6% and returned 6.90%: +177bp. Across all eleven sectors and cash, the contributions add to 2.33%, the portfolio's local-currency return.
Over longer periods the arithmetic needs care. Weights move every day as prices move and trades are made, so a quarter's contribution is built from daily or monthly contributions that have to be linked, not from one quarter-average weight multiplied by one quarter return. A factsheet that shows "top contributors" for a year has made a linking choice whether it says so or not, and two systems can rank the same holdings differently for that reason alone.
Two measures, two questions: what each one adds up to and what it needs
Contribution to return: What did each holding or sector add to our return?
Performance attribution: Which decisions made us beat or lag the benchmark?
Contribution to return: The portfolio's own return: 233bp in the sample.
Performance attribution: The active return, portfolio minus benchmark: −134bp before currency.
Contribution to return: No.
Performance attribution: Yes, and the answer changes if the benchmark does.
Contribution to return: Weight × return.
Performance attribution: Weight gaps × return gaps: allocation, selection, interaction.
Contribution to return: +32bp: the fund's Energy stocks rose 16.63%.
Performance attribution: −41bp: the fund held 1.9% of a sector that was 4.6% of the index and its best performer.
Contribution to return: An investor asking what drove their own return.
Performance attribution: A consultant or board asking why the strategy trailed its index.
What is performance attribution, and what does it need that contribution doesn't?
Performance attribution is the decomposition of a portfolio's excess return over a benchmark into the decisions that produced it. In the common Brinson-Fachler form, allocation scores the weight the manager gave each sector against the index's weight, selection scores the stocks picked inside each sector, and interaction scores the overlap. Its inputs are four per sector: the portfolio's weight and return, and the benchmark's weight and return. The full calculation, cell by cell, is in the performance attribution analysis example.
The two benchmark columns are what contribution never needs and attribution cannot do without. They also make attribution depend on a choice that has nothing to do with the manager's skill: which index, in which currency, net or gross of withholding tax. The sample index is quoted net, and the solution checks that the benchmark in each answer is the one in the client's investment management agreement, because an answer measured against the wrong index is a correct calculation of the wrong thing.
One quarter, two stories: Energy added 32bp and cost 41bp
Energy is the clearest case of the two measures disagreeing. The fund's Energy stocks rose 16.63% in the quarter and, at a 1.9% weight, added 32bp to its return: by contribution, a good quarter for the Energy book. But Energy was 4.6% of the index and the index's best sector, up 17.83%. By attribution, holding 2.7 points less of it cost 38bp of allocation, and picking stocks that rose a little less than the index's cost another 6bp, offset by 3bp of interaction: −41bp in all.
Both statements are true, and they are answers to different questions. "Energy contributed positively" is the right sentence for a client asking what drove their return. "The Energy underweight cost us 38bp" is the right sentence for a consultant asking why the strategy lagged. The wrong sentence in the wrong place is not a rounding error; it reverses the meaning of the answer.
The reverse case sits in the same report. Real Estate's stocks fell 1.89%, a −2.5bp contribution, but the fund held less of a sector that fell while the index rose, and attribution scores that at about +4bp. A sentence that says "Real Estate hurt" is right by one measure and wrong by the other.
Why subtracting contributions is not attribution
A common shortcut is to take each sector's contribution in the portfolio, subtract its contribution in the index, and call the difference attribution. It is close, and it is not the same. The difference of contributions equals Brinson-Beebower attribution, where allocation is the weight gap times the sector's own return; Brinson-Fachler subtracts the whole index's return first, which moves basis points between rows.
Contribution difference vs attribution: close in total, different by sector
| Sector | Portfolio contribution | Index contribution | Difference | Brinson-Fachler total | Fachler adjustment: −(weight gap × 3.66%) |
|---|---|---|---|---|---|
| Energy | +32 | +82 | −50 | −41 | Underweight 2.7 points: +10 |
| Health Care | −79 | +24 | −103 | −107 | Overweight 1.1 points: −4 |
| Information Technology | +177 | +135 | +42 | +38 | Overweight 1.1 points: −4 |
| Cash | +2 | 0 | +2 | −4 | Cash held, 1.6 points: −6 |
| All rows | +233 | +366 | −134 | −134 | Weight gaps sum to zero: 0 |
The difference matters most for cash and for the sectors with large weight gaps. Cash earned 1.30% and contributed +2bp, so the contribution difference calls it a small gain; attribution calls it a 4bp drag, because money held in cash would have earned 3.66% in the index. A commentary built on contribution differences will praise the cash buffer in a rising market. One built on attribution will not.
Absolute or relative: the question each one answers
One central bank's reserve managers drew the same line in their own reporting. Národná banka Slovenska's team, writing in a 2004 European Central Bank volume, separated the two analyses by the question each serves.
Whereas the absolute performance attribution aims to establish how the portfolio achieved the return, the relative performance attribution looks for the answer to a different question: namely, why the portfolio outperformed/underperformed the benchmark.
Simicak and Zajac, Národná banka Slovenska, in Risk Management for Central Bank Foreign Reserves (ECB, 2004)
What they call absolute attribution is close to contribution: how the return was made. Relative attribution is what most performance teams simply call attribution: why the return differed from the benchmark. The two use the same holdings and the same returns. They are reported separately because they answer different people.
When should you use contribution analysis?
Use contribution when the reader owns the return and does not hold a benchmark: a private client asking what made money this year, a fund's shareholders reading a "top contributors" table, a portfolio manager reviewing which positions earned their risk. Use attribution when the reader is judging the manager against an index: a consultant, an investment committee, a board or a manager research team.
Five checks before a contribution or attribution table goes into an answer
- Name the measure in the sentence
"Added 32bp to our return" and "cost 41bp against the index" are both true of Energy in the sample; a sentence that says neither is ambiguous.
- Match the measure to the question
Why we lagged → attribution. What made money → contribution. A "why" answer quoting top contributors answers a question no one asked.
- State the period and how it was linked
A quarter built from daily data and one built from a single quarter-end snapshot can rank holdings differently.
- Say before or after fees
If the table is before fees, say so; the answer still owes the after-fee return beside the before-fee one.
- Check the benchmark is the client's
Attribution against the wrong index is a correct calculation of the wrong thing; contribution is unaffected, which is why mixing them hides the error.
The benchmark decides the attribution answer
Because attribution is relative, changing the benchmark changes the answer, sometimes completely. A study of active money managers by Louis Chan, Stephen Dimmock and Josef Lakonishok compared the most widely used ways of benchmarking performance and concluded that "Estimated abnormal returns display large variation across approaches" (NBER Working Paper 12461, published in the Review of Financial Studies, 2009). Contribution has no such problem; it has a different one, which is that it says nothing about whether the manager did better than the alternative.
In practice that means two disciplines. The benchmark in an attribution answer has to be the one the client agreed to, not the one the firm markets against. And when a consultant asks for attribution against their own preferred index, the answer is a new calculation, not a re-labelled copy of the official one, with the index named in the first sentence.
The effects a strategy page shows are attribution, not contribution
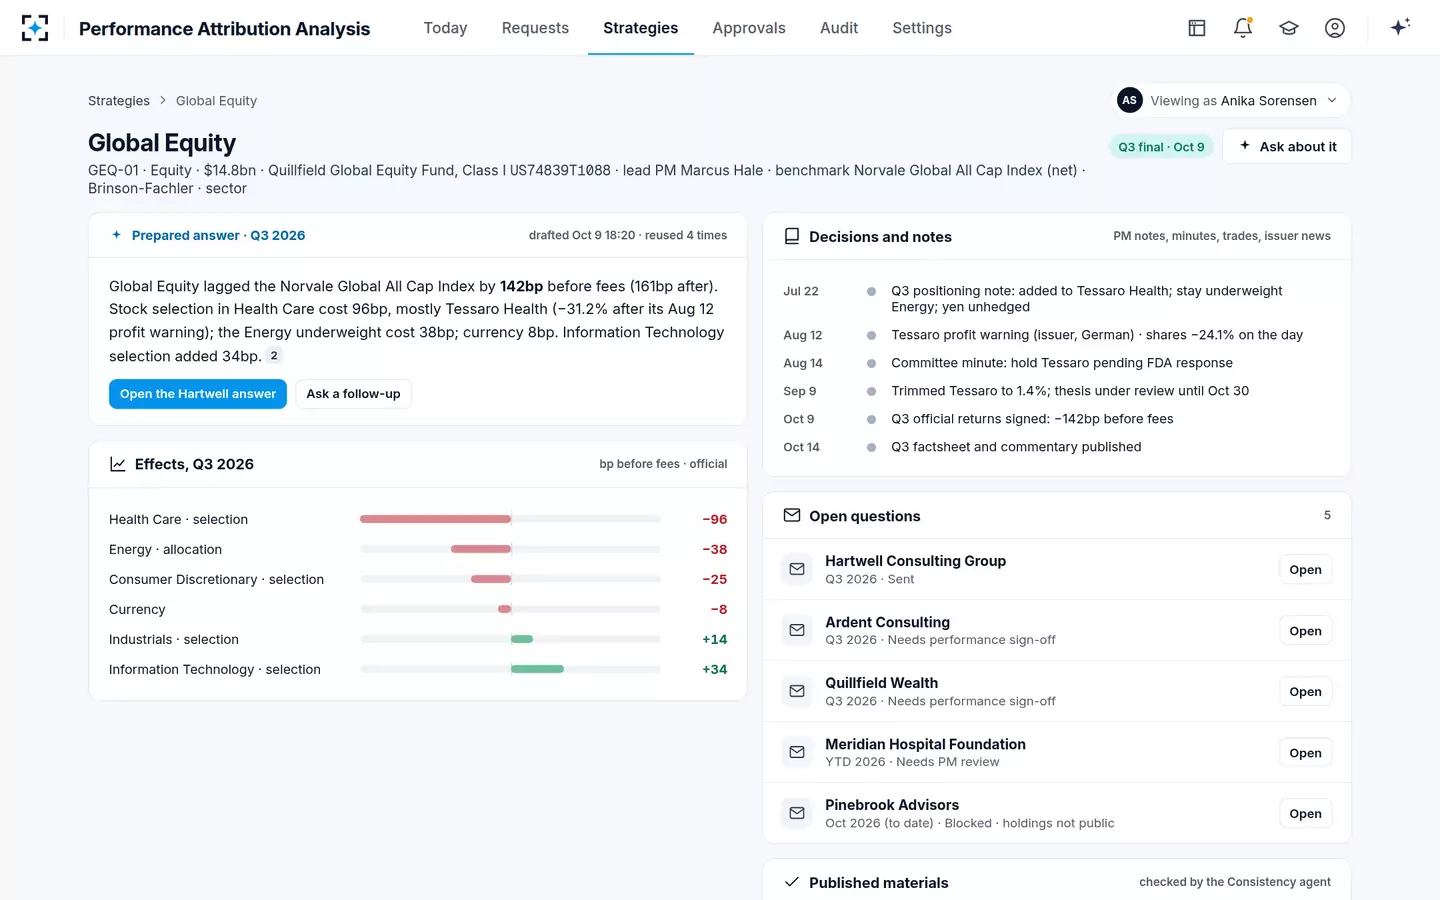
Are contribution and attribution performance under the Marketing Rule?
Possibly, and the SEC staff have chosen not to decide. In a March 19, 2025 answer in its Marketing Compliance FAQ, the staff list "contribution to return" and "attribution analyses" among portfolio characteristics that advisers "may be unsure" are performance under Rule 206(4)-1, and say they would not recommend enforcement if such a characteristic is shown gross of fees in an advertisement, provided the total portfolio's gross and net performance is shown with it under stated conditions (SEC staff, Marketing Compliance FAQ, page updated January 15, 2026).
The practical effect is that both tables travel with the same obligation when they appear in something that is an advertisement: the whole portfolio's gross and net returns, at least as prominent, over a period that covers the table's. The conditions, and the question of when a one-to-one answer becomes an advertisement, are worked through in the SEC Marketing Rule's gross and net test for attribution.
How Performance Attribution Analysis keeps the two apart in an answer
The solution's agents draft from the official attribution, so the cells they cite are attribution cells, each labelled by sector and effect. When an answer needs a holding's own return or contribution, such as Tessaro Health's fall of 31.2% over the quarter, it comes from a different cited source, the price history or the holdings report, and the sentence says which it is.
Asking Performance Attribution Analysis in plain words: the answer comes back as effects, each from the official attribution
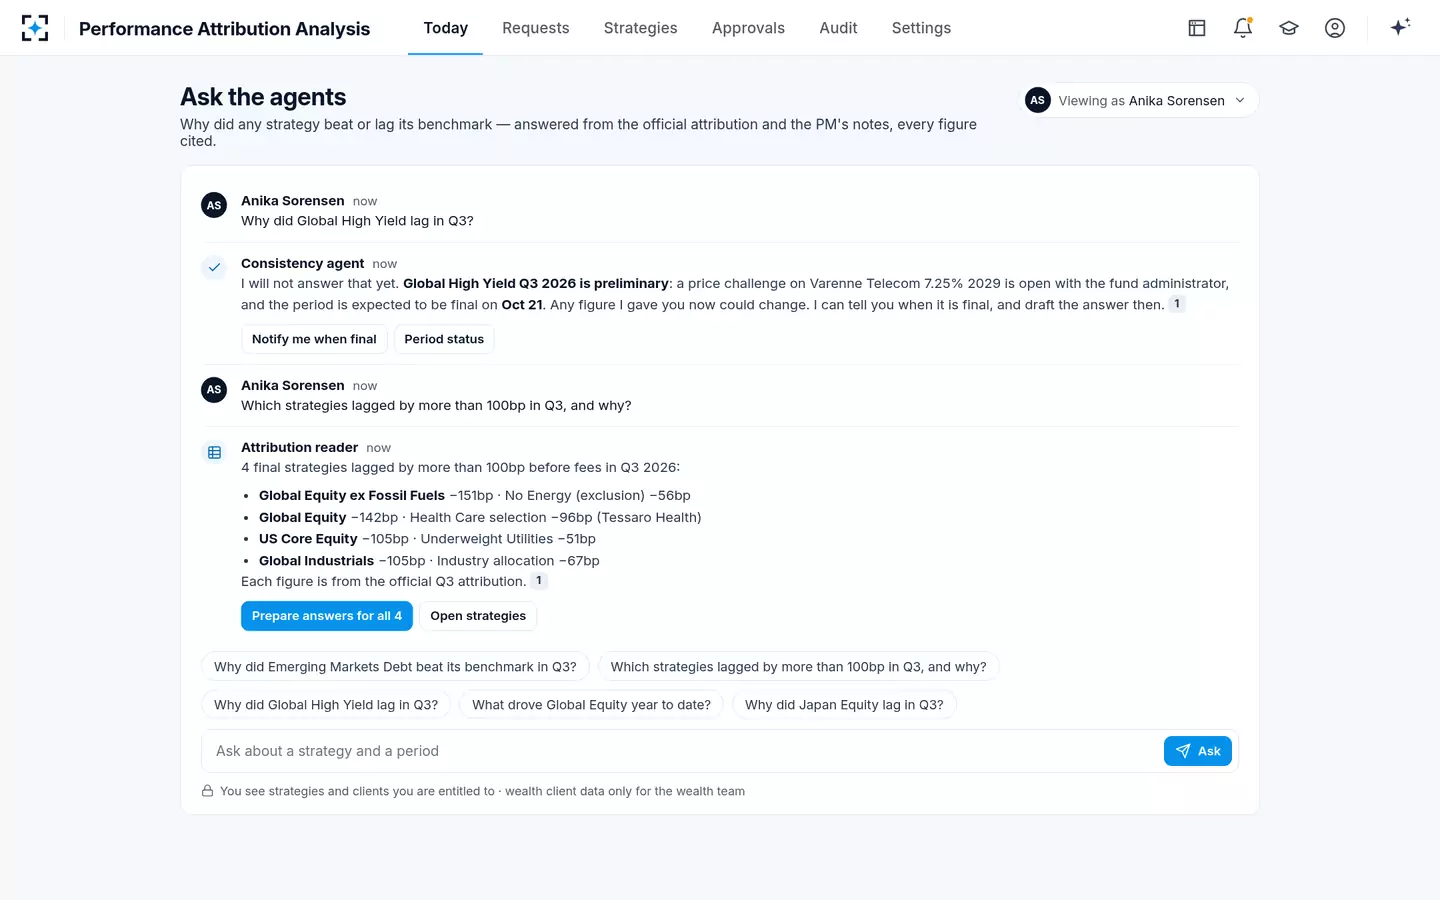
The first line of the list shows why the distinction matters beyond wording. Global Equity ex Fossil Fuels lost 56bp to Energy, not because anyone chose to avoid it that quarter, but because the client's mandate excludes it. In attribution that is an allocation loss; in contribution it does not exist, because a sector the fund cannot hold contributes nothing. An answer that explains the shortfall has to say the exclusion caused it, and only attribution shows it. More on how the solution's agents draft and check such answers is at Performance Attribution Analysis.
Questions people ask
Does contribution to return need a benchmark?
No. Contribution is weight times return for each holding, and the contributions add up to the portfolio's own return. A benchmark only enters when you want to explain the difference between the portfolio and something else, which is attribution's job.
Can a sector have a positive contribution and a negative attribution?
Yes, and it is common in a sector the fund is underweight that rises strongly. In the sample, Energy contributed +32bp to the fund's return and cost 41bp against the index, because the fund held 1.9% of a sector that was 4.6% of the index and its best performer.
Return attribution vs contribution: which belongs on a factsheet?
A top-contributors table is easy to read and needs no benchmark. If the factsheet also shows performance against an index, a short attribution summary explains that comparison better, and the two should be labelled so a reader cannot confuse a holding's contribution with its effect against the index.
What is contribution to active return?
It is each holding's or sector's portfolio contribution minus its benchmark contribution. It adds up to the active return, like attribution, but it does not separate allocation from selection, and by sector it equals Brinson-Beebower attribution rather than Brinson-Fachler: −50bp for Energy in the sample against −41bp.
Is contribution to return the same over a year as over a day?
The idea is the same, the arithmetic is not. Daily contributions add up to the daily return, but daily returns compound over a year and contributions do not, so annual contributions are produced with a linking method; two systems using different methods can show slightly different top-contributor tables for the same year.