Portfolio attribution analysis software is worth buying if it shortens the time from a "why did we lag?" question to a signed answer and reduces the answers that have to be corrected after they were sent; the number of reports it produces says little about either. The measures that prove it are specific: elapsed hours to a signed answer, analyst hours per answer, the share of figures that tie to the official returns, corrections after sending, gross figures shown without net, reasons the portfolio manager never gave, and answers that contradict each other. Each can be baselined from last quarter's mail and CRM before a contract is signed. Botminds' Performance Attribution Analysis is built against those measures: it drafts cited answers from the official attribution, checks every figure, and leaves approval and sending to people. The pilot that produces these numbers on your own files is set out separately.
The product figures on this page are labelled by kind: sample data from the solution on the fictional Quillfield Capital, design targets, or the solution's own estimates on that sample firm's volume of about 1,100 questions a quarter. None is a customer's measured result; your baseline is the number that matters.
A KPI scorecard for portfolio attribution analysis software: fill in the baseline before buying
Elapsed time to a signed answer
DefinitionHours from the question's arrival to the analyst's signature, per answer.
BaselineYour CRM and mailbox timestamps for last quarter.
TargetSame day (the solution's target).
Analyst hours per answer
DefinitionTime spent finding, chasing, drafting, checking and sending.
BaselineA two-week time log, or the solution's estimate of about 2.5 hours.
TargetAbout 0.75 hours (estimate).
Figures tied to official returns at send
DefinitionShare of figures in sent answers that reconcile to the signed-off returns.
BaselineRe-check a sample of last quarter's sent answers.
Target100% (target).
Corrections after send
DefinitionAnswers re-sent because a figure changed: preliminary periods, restatements, typing errors.
BaselineCount from last year's sent mail.
TargetNone from preliminary periods; every restatement traced.
Gross shown without net
DefinitionSent answers with a before-fee figure and no after-fee figure beside it.
BaselineSample review of last quarter.
TargetZero.
Reasons not on file
DefinitionSentences giving a reason the PM's notes, minutes or trades do not support.
BaselinePM review of a sample of sent answers.
TargetZero; the agents ask the PM instead.
Answers that contradict each other
DefinitionSame strategy and period, different drivers to different readers or the factsheet.
BaselineCompare answers per strategy and quarter.
TargetZero.
What portfolio attribution analysis software should be measured on
Measure the software on what reaches the client: how fast a correct answer arrives and how often a wrong one has to be withdrawn. A performance team already produces its attribution; the cost it carries is the work between a correct grid and a sent answer, and the risk it carries is a figure or a reason that turns out to be wrong after a consultant has repeated it to a board.
That is why the scorecard has two halves. The first two lines are efficiency: elapsed time and analyst effort. The last five are quality, and each counts a failure that reaches clients: a preliminary figure later restated, gross shown without net, a reason the portfolio manager never gave, and two people telling the same consultant two different stories. A vendor that reports only the first half is selling speed; the business case rests on both.
What KPIs should a performance team track? A scorecard to fill in before buying
Track seven, and baseline each one from last quarter before any pilot starts. Elapsed time comes from timestamps the team already has: the email's arrival and the sent reply. Analyst hours need a short time log, two weeks after a quarter close is enough. The five quality measures come from re-reading a sample of last quarter's sent answers against the official returns and the portfolio manager's notes, which is also the best preparation for a pilot.
The quality measures are the ones teams skip, because nobody counts them until something goes wrong. Yet they are the ones a regulator's examiner would recognise. The Marketing Rule forbids an advertisement to state a material fact the adviser could not reasonably expect to prove if the SEC asked (17 CFR 275.206(4)-1(a)(2); how the SEC has enforced that clause). "Figures tied to official returns" and "reasons not on file" are that test, applied to every answer rather than only to advertisements.
How many hours does a consultant answer take?
No regulator or independent study publishes the hours a performance team spends per consultant answer, so the number has to be your own. The solution's estimate on its sample firm is about 2.5 analyst hours per answer by hand, spread across logging the question, finding the right attribution, getting the reason from the portfolio manager, drafting, checking every figure gross and net, and sending, and about 0.75 hours to review a cited, checked draft.
The solution's own figures for the business case, by kind
~2.5h
analyst time per answer by hand, estimated on the sample firm's volume
~0.75h
to review, approve and send a cited, checked draft (estimate)
1,100
questions a quarter at the fictional sample firm, across 148 strategies
100%
of figures tied to the official returns before an answer leaves (target)
At the sample firm's volume, the estimated difference is about 1,925 analyst hours a quarter: 1,100 answers × 1.75 hours. Multiplied by your loaded hourly cost, that is the efficiency half of the case. It is also the half most likely to be overstated, because hours freed are only worth money if they are used, so the case should say what the analysts will do with them: more attribution review, faster close, fewer late nights after quarter end.
Elapsed time, not effort: one sample answer, hour by hour
Elapsed time is the KPI clients notice, and it is mostly waiting. In the sample, a consultant's question arrived at 16:42 on a Thursday with a tier-A clock of two business days. The agents logged it at once and drafted overnight in 2 minutes 41 seconds of work. The portfolio manager reviewed the reasons at 08:12, the analyst signed at 09:23, and the client team sent it at 09:27 on Friday: under 17 hours from question to sent, against 96 hours allowed.
One sample answer: question to sent in under 17 hours, against a clock of 96
- Logged; drafted overnight9.5 h
- Waiting for the PM's review6 h
- Review to signature1.2 h
- Sent
- Thursday 16:42 to Monday 16:4296 h
The lesson for a business case is that elapsed time falls only if the waits fall. Faster drafting removes one queue; the portfolio manager's review, the analyst's sign-off and the client team's send still happen in working hours. A target of "same day" is realistic when the draft is ready before people start their day; it is not realistic if the software merely drafts faster when someone remembers to ask it.
How do you measure answer accuracy?
Measure accuracy at the level of the individual figure and the individual reason, by question type, against a ground truth you trust. For figures, the ground truth is the official, signed-off returns and attribution. For reasons, it is the portfolio manager's notes, minutes and trades, and the manager's own review. A single "accuracy" percentage hides which kind of error the software makes, and the kinds have very different costs.
Researchers testing a GPT-4 attribution agent on 140 exam-style questions show why the split matters: it answered 62 of 70 multiple-choice questions correctly (89%) and 59 of 70 calculation questions (84%), and followed the required output format in 139 of 140 answers (de Melo and Sheikh, arXiv 2403.10482, 2024, not peer reviewed). An 84% calculation score is a fail for a figure sent to a client; an 89% score on interpretive questions might be acceptable for a first draft that a person reviews. The same scorecard should apply to any tool you consider.
Accuracy by question type: what to count, and what a miss costs
| Question type | Ground truth | Count as an error | Cost of a miss |
|---|---|---|---|
| A figure: return, gap, effect | Official returns and attribution, signed | Any figure outside the rounding tolerance | A correction to every recipient |
| Gross and net pairing | Official gross and net returns | A before-fee figure with no after-fee figure | A Marketing Rule finding if it is an advertisement |
| A driver: which effect matters | The attribution grid and materiality rule | A material effect left out, or a small one led with | A misleading emphasis |
| A reason: why the PM did it | PM notes, minutes, trades, PM review | A reason not found on file | A statement the PM never made |
| Period status | Performance system period flags | An answer from a preliminary period | A restated figure in a client's hands |
Corrections avoided: the KPI that carries the risk
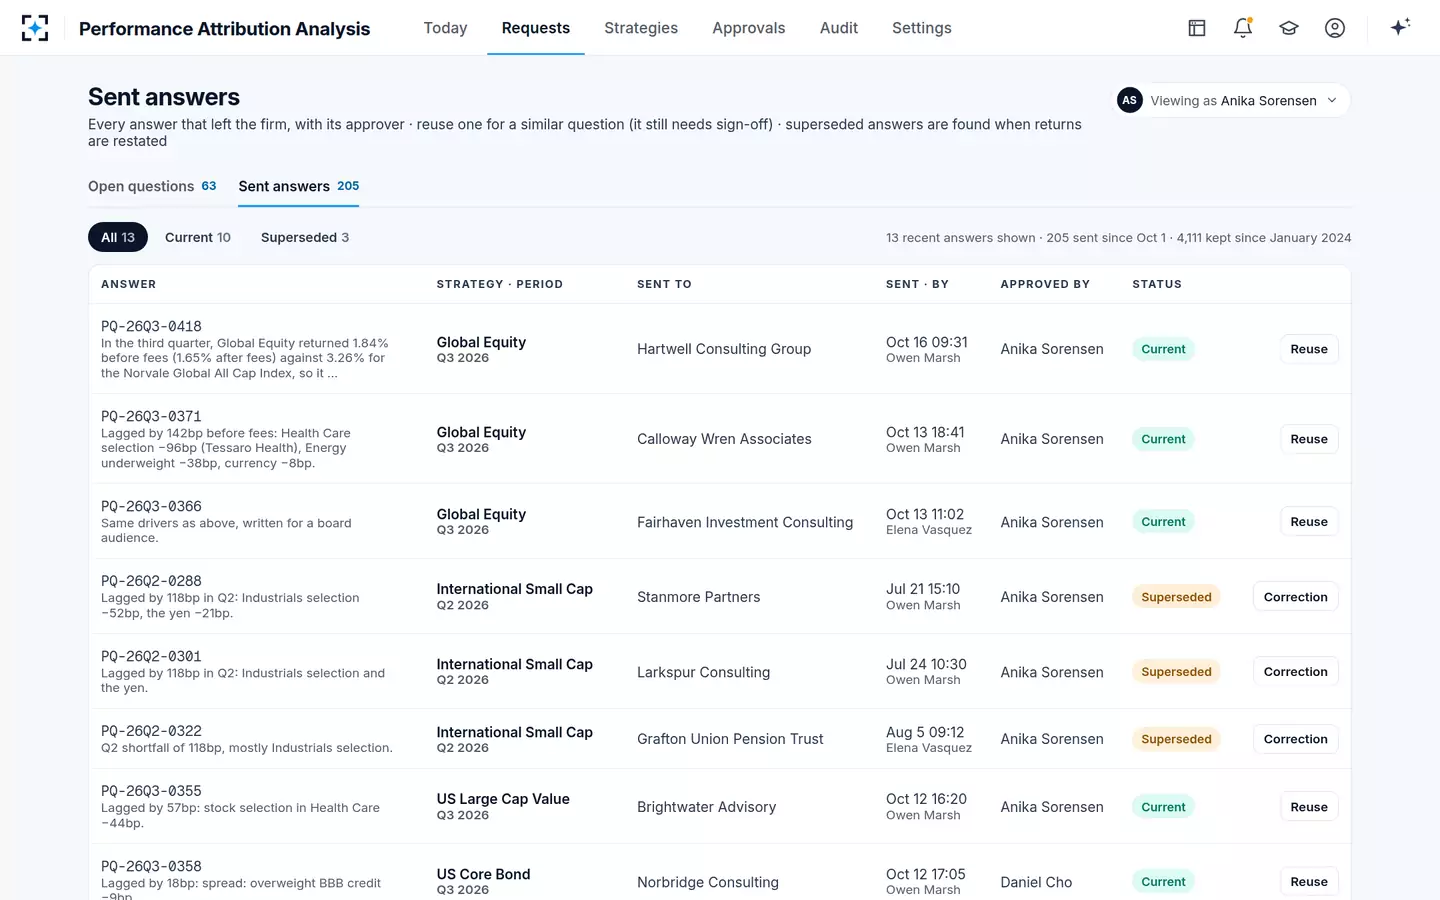
Count every answer that had to be re-sent last year because a figure changed, and why. The causes are few: an answer sent from a preliminary period, a restatement after an answer went out, a figure typed wrong, a gross figure sent without net and later corrected. Each correction costs the hours to find every recipient and re-send, and something harder to price with the consultant who has already used the first number.
Examiners look for the same failure from the other side. The SEC's April 2024 risk alert listed "Advertisements that did not disclose the time period or did not disclose whether the returns were calculated for the same time period as additional performance information included in the same advertisement" (Risk Alert, April 17, 2024), and one of five advisers settled in an April 2024 sweep was found to have been "unable to substantiate performance shown in its advertisements" (SEC Press Release 2024-46). A team that can show every figure tied to an official, final period has a short answer to both.
Sent answers and restatements in Performance Attribution Analysis: the corrections baseline, already counted
What does attribution software cost, and how to build the business case?
No regulator or independent study publishes what attribution software costs, and pricing depends on the scope, the number of strategies and the systems it connects to, so the cost side comes from the quotes you receive. The benefit side should be built from your own baseline, in four lines, and tested in a pilot before it is believed.
A business case for attribution software in four lines
- Hours returned
Questions a quarter × (baseline hours − hours with the software) × loaded hourly cost. Use your time log, not a vendor's estimate.
- Corrections avoided
Last year's corrections × hours each took to find recipients and re-send, plus the ones from preliminary periods that should never have happened.
- Elapsed time
Share of answers inside each consultant's service level, before and after. Hard to price, easy to show a client.
- Control evidence
Workings kept per answer for an examiner or auditor: versions, sources, checks, approvals. Count the hours your last exam request took.
Investment performance measurement software vs an answer layer: where each KPI lives
Investment performance measurement software calculates returns and attribution; an answer layer such as Performance Attribution Analysis explains them. The KPIs above live mostly in the second. If last quarter's re-read finds wrong official returns or attribution that does not reconcile, the investment is in measurement, and no answer software will fix it. If it finds correct grids turned into slow, inconsistent or unsupported answers, the investment is in the layer between the grid and the client.
The SEC's examiners frame fund oversight the same way. The fiscal 2027 priorities say exams of registered funds will check whether portfolio management practices match what the funds' strategies, filings and marketing say (SEC Division of Examinations, Fiscal Year 2027 Examination Priorities; the examiners' words, and the order evidence they imply). Alignment between what was done and what is said is the KPI an answer layer exists to move: the "answers that contradict each other" line, extended to the factsheet and the filings.
Reliability, accuracy, relevance: the same test in a central bank's words
The quality half of the scorecard is not new. A public investor running benchmarked reserves set the same standard for its own attribution reports two decades ago: the Central Bank of Brazil's performance team put it in three words.
Such reports need to have three key features: reliability, accuracy and relevance. Reliability is related to results that are true and not a consequence of information manipulation. Accuracy is related to the approach and methodology used in the calculations, while relevance is associated with the identification of sources of return that are relevant in the investment strategy process.
de Almeida da Silva Junior, Central Bank of Brazil, in Risk Management for Central Bank Foreign Reserves (ECB, 2004)
Mapped onto the scorecard: reliability is "figures tied to official returns" and "reasons not on file"; accuracy is the method behind the grid and its period status; relevance is whether the answer leads with the effects that matter for the strategy, which the solution handles with a driver materiality setting and the analyst's review.
How Performance Attribution Analysis reports against its own targets
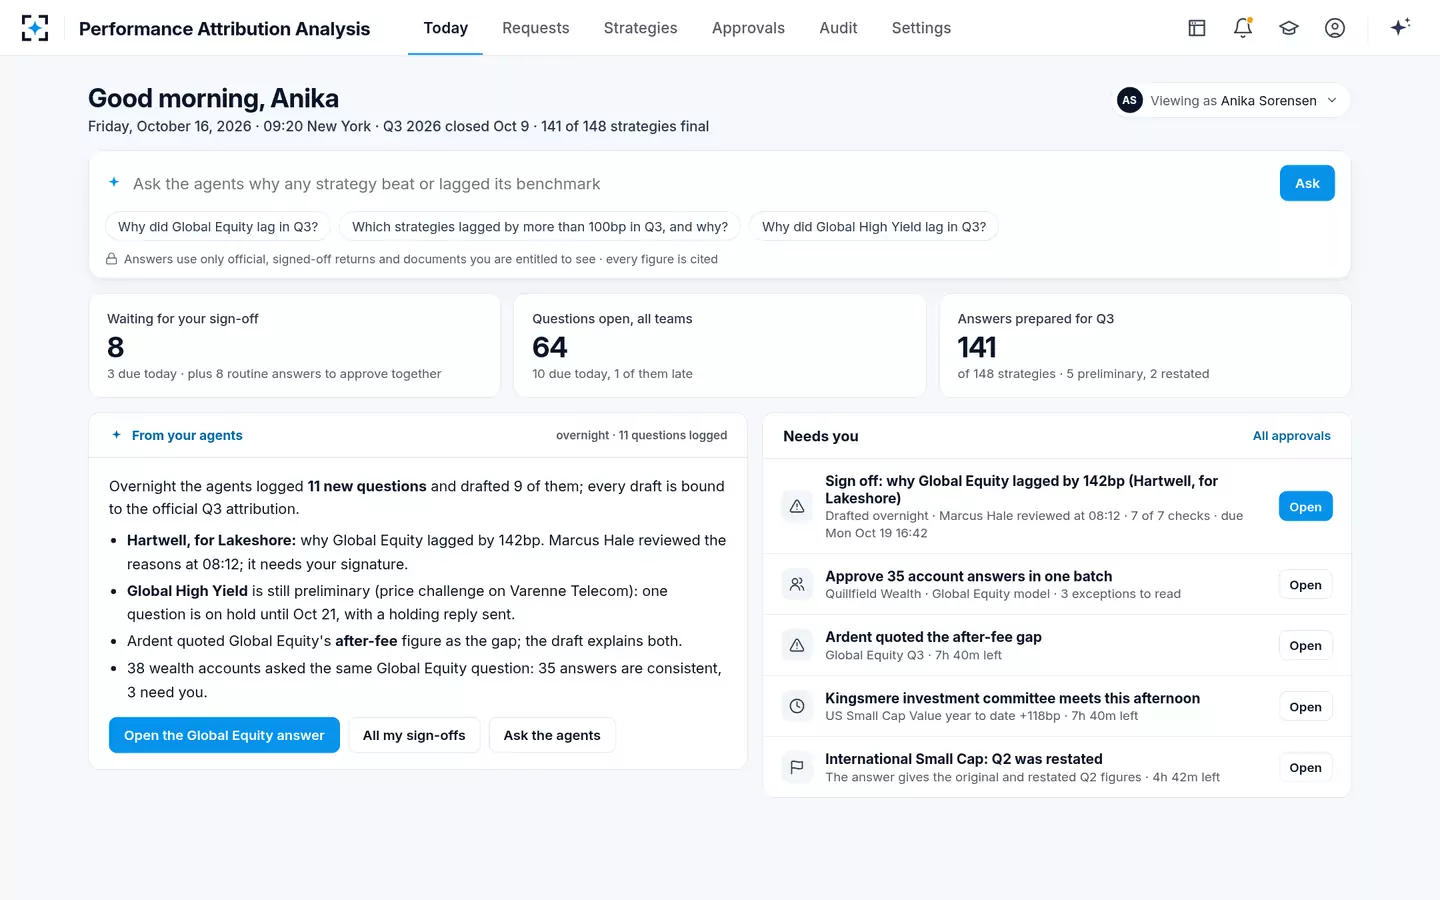
The solution keeps the evidence each KPI needs as a by-product of the work. Every question carries its arrival time and clock; every draft, check, review, signature and send is on an append-only trail with its time; every sent answer is kept with its figures and sources, so a restatement can be traced to the answers it affects. The analyst's home screen shows the live counts.
The analyst's morning in numbers: sign-offs waiting, questions open, answers prepared
Two targets are set in the solution's design: 100% of figures tied to the official, signed returns before an answer leaves, and a cited answer the same day rather than two or three days later. The way to test both on your own questions is a pilot on last quarter, described in how to pilot performance attribution software; the controls that make the quality targets possible are in why the writer is never the checker; and the people whose hours the case counts are in who answers "why did we lag?". The solution is at Performance Attribution Analysis.
Questions people ask
Who are the investment performance software providers?
They fall into three groups: performance measurement and attribution systems that calculate the official numbers, reporting tools that format them for clients, and answer tools that explain them. This guide does not compare vendors; score any of them on the same seven measures, on your own last quarter, before choosing.
What is the single most important KPI?
Figures tied to the official returns at the moment of sending, because every other failure, a correction, a contradiction, a Marketing Rule finding, starts with a figure that was not. The solution's design target is 100%.
How long does it take to see a return?
The efficiency half should show at the first quarter-end after go-live, when question volume peaks. The quality half needs a full year of sent answers to compare corrections and contradictions with the year before.
Should the business case count reports produced?
No. Producing more reports or more drafts is a cost if nobody reads them. Count answers signed and sent, the time they took, and the ones that never needed correcting.
Can the KPIs be measured without buying anything?
Yes, and they should be. Last quarter's sent mail, CRM timestamps and a two-week time log give every baseline on the scorecard, and the re-read of sent answers often finds the first business case on its own.