Fixed income attribution models explain a bond portfolio's return against its index by the decisions a bond manager actually makes: how much yield to hold (carry), how much interest-rate sensitivity (duration), where on the yield curve (curve), how much credit and which sectors (spread), and which individual bonds (selection). An equity-style Brinson model, which only knows sector weights and returns, cannot see most of those decisions, so it puts a duration bet and a credit bet into the same "allocation" box. In one sample quarter an emerging markets debt strategy beat its index by 61 basis points (bp): +6bp carry, −6bp duration, −1bp curve, +29bp spread and +33bp selection. Botminds' Performance Attribution Analysis answers "why did we beat or lag?" for bond strategies from that kind of grid, citing each effect and the portfolio manager's note behind it.
The figures come from the solution's sample data: Emerging Markets Debt, a fictional strategy of the fictional Quillfield Capital, third quarter of 2026, measured against the fictional Norvale EM Sovereign Index. The strategy returned 4.92% before fees (4.79% after) against 4.31% for the index.
Emerging Markets Debt beat its index by 61bp: what added and what cost
Effects that added, +68bp in all
- Selection, +33bp · 48%
- Spread, +29bp · 43%
- Carry, +6bp · 9%
Effects that cost, −7bp in all
- Duration, −6bp · 86%
- Curve, −1bp · 14%
What is fixed income attribution, and what does it measure?
Fixed income attribution measures how much of a bond portfolio's excess return came from each kind of risk the manager took relative to the benchmark. The risks are different from equity's. A bond's return over a quarter is mostly its income plus the price change caused by moving yields, and yields move for two reasons: the government curve shifts and twists, and the spread a borrower pays over that curve widens or tightens. The model's job is to put each basis point into one of those boxes.
Central banks that manage reserves against a bond benchmark describe the same structure in their own reporting. Národná banka Slovenska's reserve managers, in a 2004 European Central Bank volume, grouped the drivers of a fixed income portfolio's return as time, curve and spread. The "Time" group, they wrote, "covers any income (positive or negative) produced by the passage of time, i.e. it counts the change in value of a portfolio over time, provided other parameters (yield curve, spreads) remain constant" (Simicak and Zajac, in Risk Management for Central Bank Foreign Reserves, ECB, 2004).
Can Brinson attribution be used for bonds?
Only for part of the story. A Brinson model can say that a bond portfolio was overweight corporate bonds and that its corporates beat the index's, but it cannot say whether the corporate overweight earned money because spreads tightened or because the corporates happened to be longer-dated when yields fell. Those are different decisions, often made by different people, and Brinson puts both into allocation.
The point is made in a 2002 paper by Andrew McLaren, quoted in a 2024 study of attribution by de Melo and Sheikh: Brinson is insufficient for fixed income because "the allocation decision in equity models does not explicitly account for yield-curve positioning (duration) set by fixed-income managers" (de Melo and Sheikh, arXiv 2403.10482, not peer reviewed). The same study notes that a fixed income report needs, beyond allocation and selection, "at least two other effects": shift and twist of the yield curve.
Equity Brinson and a fixed income model, decision by decision
Equity Brinson: Sectors, countries or industries.
Fixed income attribution model: Risk factors: income, rate level, curve shape, spreads, then the bond itself.
Equity Brinson: Invisible: hidden inside allocation and selection.
Fixed income attribution model: Duration effect: the portfolio's duration gap times the parallel move in yields.
Equity Brinson: Invisible.
Fixed income attribution model: Curve effect: positions along the curve times its non-parallel moves.
Equity Brinson: Allocation to a "credit" sector, mixed with rate effects.
Fixed income attribution model: Spread effect: spread duration gaps times spread changes, by sector or rating.
Equity Brinson: Inside each sector's return.
Fixed income attribution model: Carry: yield earned with nothing else changing.
Equity Brinson: Selection and interaction.
Fixed income attribution model: Selection: the bonds chosen within each bucket, often calculated as the remainder.
The five effects in most fixed income attribution models
Most fixed income attribution models decompose the excess return into carry, duration, curve, spread and selection, sometimes with currency, roll-down or repo added as their own lines. The arithmetic for each is a first-order approximation built on the same idea: a sensitivity gap times a market move. The exact formulas vary; the five below are the common core.
Four market effects, each a sensitivity gap times a market move; selection is the rest
Carry
(yP − yB) × t
Extra yield earned over the period, if nothing else moved. Includes roll-down where the model shows it here.
EMD sample: +6bp
Duration
−(DP − DB) × Δy_parallel
The duration gap times the parallel shift in the government curve.
EMD sample: −6bp
Curve
−Σ (KRDP,k − KRDB,k) × (Δy_k − Δy_parallel)
Key-rate exposures times the twist and bend left after the parallel move.
EMD sample: −1bp
Spread
−Σ (SDP,s − SDB,s) × Δs_s
Spread duration gaps by sector, rating or region, times each spread change.
EMD sample: +29bp
How is carry measured in attribution?
Carry is measured as the income the portfolio earns from its yield over the period, compared with the benchmark's, holding the curve and spreads where they started. A portfolio that yields 24bp a year more than its index earns about 6bp of carry in a quarter: 0.24% × 0.25. In the sample, Emerging Markets Debt's carry was +6bp, made up of +3bp in Latin America, +2bp each in the Middle East and Africa and in frontier Africa, +1bp in emerging Europe, and −2bp from cash, which yields less than the bonds it replaces.
Two refinements matter in practice. Roll-down, the price gain as a bond ages along an upward-sloping curve, is income from time passing, and the Slovak central bank's framework put it there: "In case of a positive yield curve, this is the additional income resulting from yields decreasing towards maturity" (Simicak and Zajac, ECB, 2004). Other frameworks give it a line of its own. And carry in a high-yield or emerging markets portfolio is partly a reward for credit risk, so a manager who reaches for yield will show steady positive carry and a spread effect that pays the bill in a bad quarter. An answer that celebrates carry without the spread line is half an answer.
Duration: the parallel move, and the sign that trips people up
The duration effect is the portfolio's duration gap multiplied by the parallel move in yields, with the sign reversed: longer duration gains when yields fall and loses when they rise. Emerging Markets Debt was held 0.4 years shorter than its index, according to the portfolio manager's July note. Yields fell, so the short position cost money: −6bp. In our arithmetic that is consistent with a parallel fall of about 15bp in the model's reference curve, since 0.4 × 0.15% ≈ 0.06%.
The Central Bank of Brazil's performance team set out the logic for its reserves in the same ECB volume: "if the effective portfolio has a longer duration than the benchmark, a positive parallel shift in the yield curve, for instance, will result in a negative differential return" (de Almeida da Silva Junior, ECB, 2004). The sentence a consultant needs is the plain version: being shorter than the index cost 6bp as Treasury yields fell. Saying "duration detracted" without the direction of the bet leaves the reader guessing whether the manager was too long or too short.
What is the curve effect in attribution?
The curve effect is the return from how the portfolio is positioned along the yield curve, when the curve changes shape rather than moving in parallel. A portfolio with the same overall duration as its index can still win or lose if it holds more two-year and thirty-year bonds and fewer ten-year ones, and the curve steepens or flattens. The Brazilian framework named it directly: even with equal duration, "a change in the yield curve that is not parallel could result in a differential return not equal to zero. This is what is termed here a ‘curve effect’" (ECB, 2004).
For fixed-income attribution analysis, the HKMA uses a market-based three-factor model which principally captures the term-structure risks: yield curve parallel shift, slope and curvature changes.
Hong Kong Monetary Authority, in Risk Management for Central Bank Foreign Reserves (ECB, 2004)
Shift, slope and curvature are the three ways a curve moves, and a model that captures all three can separate a duration bet from a steepener. In the sample the curve effect was −1bp; it is the line to watch in a strategy whose stated edge is curve trades, and the one a duration-only model would fold silently into duration or selection.
Spread and selection: where the credit views show up
The spread effect is the return from holding more or less spread risk than the index in each sector, rating band or region, as spreads widen or tighten. Emerging Markets Debt's +29bp of spread came almost entirely from one decision: an overweight to frontier African sovereigns, whose spreads tightened by 85bp in the quarter and added +24bp. Selection, +33bp, is what the chosen bonds earned beyond those market moves, and most of it was one region: Latin American corporates, +29bp, led by Andes Cobre's 2031 bonds after the company's refinancing.
The Emerging Markets Debt grid in Performance Attribution Analysis: five effects by region
| Region | Carry | Duration | Curve | Spread | Selection | Total |
|---|---|---|---|---|---|---|
| Latin America | +3 | −2 | 0 | +4 | +29 | +34 |
| Middle East & Africa | +2 | −1 | −1 | +6 | +3 | +9 |
| Emerging Europe | +1 | −1 | 0 | −3 | +2 | −1 |
| Asia | 0 | −2 | 0 | −2 | −2 | −6 |
| Frontier Africa | +2 | 0 | 0 | +24 | +1 | +27 |
| Cash | −2 | 0 | 0 | 0 | 0 | −2 |
| Total | +6 | −6 | −1 | +29 | +33 | +61 |
Because selection in many fixed income models is calculated after everything else has been taken out, it inherits whatever the model could not explain: pricing differences between the portfolio's and the index's sources, trades within the period, a bond whose spread moved for reasons the sector curve did not capture. The Brazilian framework said so of its own method: "Selection effect is calculated as the difference between the total differential return and allocation, duration, repo, credit and curve effect" (ECB, 2004). A large selection number in a fixed income report is a reason to look, not yet a reason to credit the manager.
Fixed income attribution models compared: no single standard
There is no single fixed income attribution model. The Central Bank of Brazil compared the reports of the six external managers running part of its reserves with its own, and concluded "that each manager has his or her own performance attribution approach, and that these approaches probably reflect their individual investment processes" (ECB, 2004). Its comparison lists effect labels as different as yield advantage, benchmark roll yield, reshaping, credit allocation and accrual conventions.
For a reader of an answer, that has two consequences. Effects from two managers' fixed income reports cannot be compared line by line without first mapping their labels to the same decisions. And an answer must use the firm's official model and say which it is, because a consultant who receives "duration −6bp" from one manager and "yield curve −7bp" from another may be reading the same bet under two names, or two different bets under similar ones.
A bond question in Performance Attribution Analysis, answered from the fixed income grid
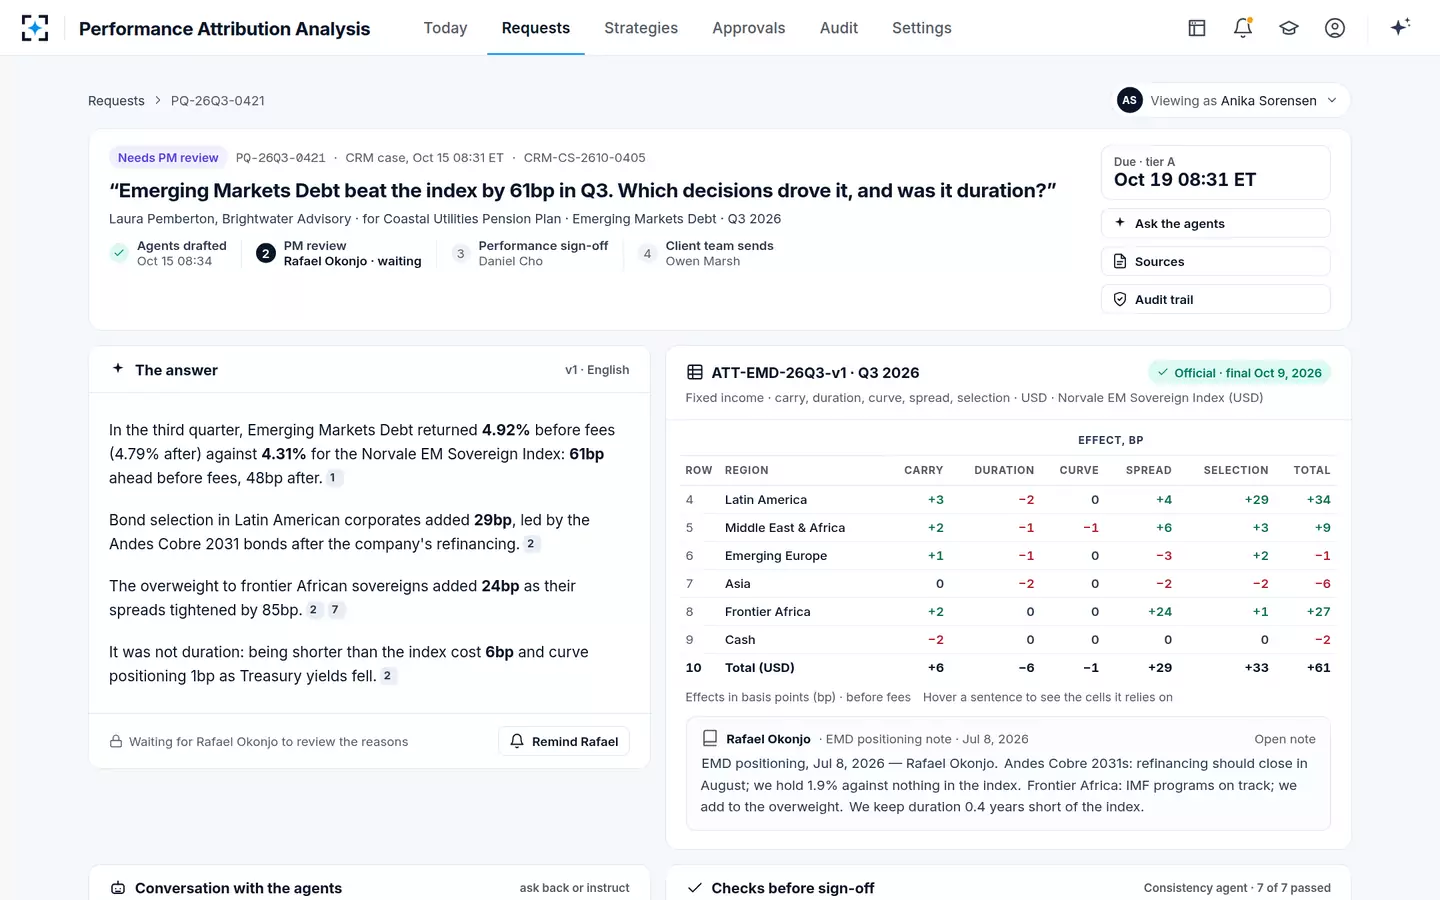
What a fixed income answer needs that an equity answer doesn't
A fixed income answer needs evidence about rates and spreads as well as about holdings. To say "being shorter than the index cost 6bp" the writer needs the duration gap, from the portfolio manager's note or the risk report, and the direction of yields. To say "frontier African spreads tightened by 85bp" the writer needs the spread change, from the index or the pricing source. Neither is in an equity answer's toolkit, and both are where a hand-written commentary most often states a direction the numbers do not support.
Before a fixed income attribution answer goes to a consultant
- Name the model and its effects
Carry, duration, curve, spread and selection, or the firm's own labels, stated once so the reader can map them.
- Give the direction of every rate bet
"Shorter than the index as yields fell" is an explanation; "duration detracted" is not.
- Pair carry with spread
Extra yield earned and the spread risk that bought it belong in the same sentence or the next one.
- Treat a large selection figure as a question
If selection is the remainder, check pricing sources and trades before crediting skill.
- Check the period is final
A preliminary bond period can move when a price challenge with the administrator is resolved.
- Show the after-fee figure
61bp before fees was 48bp after in the sample; the answer gives both.
The last two checks are where bond portfolios differ most in practice. In the solution's sample, a question about Global High Yield's third quarter was refused because the period was preliminary: a price challenge on one bond was open with the fund administrator, and the period was expected to be final on October 21. A bond priced differently by the portfolio's and the index's sources can move selection on its own, which is exactly the kind of change that makes an answer sent too early wrong.
For how the equity grid works cell by cell, see the performance attribution analysis example; for why a remainder such as fixed income selection can hide trading inside the period, see transaction vs holdings based attribution. The agents that read both kinds of grid are described at Performance Attribution Analysis.
Questions people ask
What is the spread effect in fixed income attribution?
It is the return from holding more or less spread risk than the index as spreads change: roughly the spread duration gap times the change in spread, summed by sector, rating or region. In the sample, an overweight to frontier African sovereigns earned +24bp as their spreads tightened by 85bp.
What is the difference between fixed income attribution and fixed income performance attribution?
Nothing: both names describe the decomposition of a bond portfolio's excess return into risk-based effects. "Fixed income return attribution" and "bond attribution" are used the same way; what differs between firms is the model behind the name.
Is roll-down part of carry or of the curve effect?
It depends on the model. Roll-down comes from time passing on a sloped curve, so some frameworks, including the Slovak central bank's, put it with income from time; others give it a line of its own. An answer should follow the firm's official model and not move it between lines.
Why can selection be so large in a bond report?
Because it is often calculated last, as what remains after carry, duration, curve and spread. Besides genuine bond picking it can contain pricing differences between sources, trades inside the period and moves the sector spread curve did not capture.
Does fixed income attribution need daily data?
Daily data gives a more accurate split, because duration and spread exposures change with every trade and coupon. A model run on month-end holdings can assign more of the quarter's return to selection, simply because it cannot see what happened in between.