The implementation shortfall formula measures the cost of turning an investment decision into a position: take the gain a paper portfolio would have made if every share had been bought at the price when the decision was made, subtract the gain the real portfolio made on the shares actually bought, net of fees, and divide by the paper investment. In basis points, implementation shortfall = (paper return − real return) ÷ (decision price × shares decided) × 10,000. It splits into four parts: delay before the order starts working, the cost of trading the filled shares, the opportunity cost of shares never filled, and explicit fees. It is the benchmark most buy-side desks use for urgent equity orders because it charges an order for everything after the decision, and it is the default for equities in Botminds' Transaction Cost Analysis, where agents compute it for every order overnight and explain the expensive ones in plain words.
The worked example below is illustrative arithmetic. Later sections use the solution's sample data on a fictional asset manager, Quillfield Capital, and its fictional brokers; the regulatory and research sources are linked where they appear.
The implementation shortfall formula as a sum of four costs
Delay
filled shares × (arrival price − decision price)
The market moved before the order started working.
Portfolio manager to desk handoff
Trading
filled shares × (average fill price − arrival price)
Spread, timing and impact while the order worked.
Trader, broker, algorithm
Opportunity
unfilled shares × (end price − decision price)
The move the fund missed on shares it never bought.
Trader, at cancel or end of horizon
Fees
commissions + fees + taxes
The only part on the invoice.
Head of trading, through rates
What is implementation shortfall?
Implementation shortfall is the gap between what an investment idea would have earned on paper and what it earned once it was traded. The SEC described it in 2003 as "the difference between the price of all trades you intend to make (trades actually made plus intended trades that fail to execute) and the price that prevailed in the market when each decision to trade was made" (SEC, Request for Comments on Measures to Improve Disclosure of Mutual Fund Transaction Costs, 68 FR 74820, December 24, 2003). The parenthesis is the part that sets it apart: intended trades that fail to execute are counted too.
The same release gave the cleaner way to picture it, from Harris's market microstructure text: implementation shortfall "can be interpreted as the difference in value between an actual portfolio and a corresponding paper portfolio." The paper portfolio buys every share instantly at the decision price and pays nothing. The real portfolio waits, pays the spread, moves the price, pays commission and sometimes gives up. Everything that separates the two is cost.
The implementation shortfall formula, in dollars and basis points
The formula has two equivalent forms. The portfolio form subtracts the real return from the paper return. The component form adds up delay, trading, opportunity and fees. Both give the same dollars, and that equality is the first check any implementation should pass.
Written out for a buy order decided at price Pd for N shares, with n shares filled at an average Pavg, an arrival price Pa, an end-of-horizon price Pe and fees F:
Two forms of the implementation shortfall formula that must give the same answer
| Form | Formula | What it is for |
|---|---|---|
| Portfolio form | N × (Pe − Pd) − [n × (Pe − Pavg) − F] | The definition: paper gain minus real gain |
| Component form | n × (Pa − Pd) + n × (Pavg − Pa) + (N − n) × (Pe − Pd) + F | The diagnosis: which part of the process cost what |
| In basis points | shortfall ÷ (N × Pd) × 10,000 | Comparable across orders, brokers and funds |
| For a sale | Reverse each price difference; fees still add | Selling below the decision price is the cost |
A worked example: 100,000 shares, from decision to last fill
A portfolio manager decides to buy 100,000 shares when the stock is at $50.00. The order reaches the desk and starts working at $50.10. By the end of the day the desk has bought 80,000 shares at an average of $50.30, paid two cents a share in commission, and cancelled the rest because the price ran away. The stock closes at $50.60.
Implementation shortfall calculation on one order, line by line
| Step | Calculation | Dollars | Basis points |
|---|---|---|---|
| Paper investment | 100,000 × $50.00 | $5,000,000 | — |
| Paper gain | 100,000 × ($50.60 − $50.00) | $60,000 | 120.0 |
| Real gain | 80,000 × ($50.60 − $50.30) − $1,600 fees | $22,400 | 44.8 |
| Implementation shortfall | $60,000 − $22,400 | $37,600 | 75.2 |
| Delay | 80,000 × ($50.10 − $50.00) | $8,000 | 16.0 |
| Trading | 80,000 × ($50.30 − $50.10) | $16,000 | 32.0 |
| Opportunity | 20,000 × ($50.60 − $50.00) | $12,000 | 24.0 |
| Fees | 80,000 × $0.02 | $1,600 | 3.2 |
| Components, summed | $8,000 + $16,000 + $12,000 + $1,600 | $37,600 | 75.2 |
Three things stand out. The trader's own slippage, 32 basis points, is less than half the total. The 24 basis points of opportunity cost would vanish from a report that only measures filled shares, even though the fund missed the move it was trying to catch. And the 16 basis points of delay happened before the trader touched the order; a desk measured only from arrival never sees it.
Where the 75.2 basis points went
What are the components of implementation shortfall?
The components are delay, trading, opportunity and fees, and each points at a different owner. Delay belongs to the handoff between the portfolio manager and the desk. Trading cost, which most systems split further into spread, timing and market impact, belongs to the trader, the broker and the algorithm. Opportunity cost belongs to whoever decided to stop. Fees belong to the commission schedule.
The split matters because the remedies differ. A desk with high delay needs a faster route from decision to order, not a cheaper broker. A desk with high impact needs slower trading or a different venue mix, which in turn raises the risk of opportunity cost. That trade-off between impact and risk is the subject of the Almgren–Chriss model, whose efficient frontier "consists of strategies having the lowest expected execution cost for a given level of uncertainty" (Almgren and Chriss, Journal of Risk, 2001); the market impact model guide works through how impact grows with size.
How is the opportunity cost of unfilled shares counted?
Unfilled shares are priced at the move from the decision price to a chosen end price, and the choice of end price is the most consequential setting in the formula. The SEC's release was blunt about the concept, "Opportunity cost is the cost of missed trades", and equally blunt that it "cannot be measured directly." In practice the end price is the close on the day the order was cancelled, or the price at a fixed horizon the execution policy sets.
Two rules keep it honest. First, the end price must be set in the policy before anyone sees the result, or a desk can pick the horizon that flatters it. Second, a cancelled order must stay in the measurement: if the 20,000 shares in the example simply disappear from the report, the order looks 24 basis points cheaper than it was. Where a portfolio manager genuinely changes their mind, the order should be closed with that reason and the shortfall measured to that moment.
Implementation shortfall vs VWAP: which one can be gamed?
Implementation shortfall is hard to game because its benchmark is fixed before trading starts; VWAP can be managed by the trader whose orders help set it. The SEC's 2003 release put the advantage this way: the implementation shortfall method "includes all trading costs and is not vulnerable to being gamed", while adding that "there is no generally accepted manner to calculate a portfolio's implementation shortfall." The second half is why firms must write their method down.
Implementation shortfall vs VWAP on the same order
Implementation shortfall: Price at the decision, or at arrival on the desk
VWAP: Volume-weighted average price over the order's interval or the day
Implementation shortfall: Yes: fixed before the first fill
VWAP: No: formed while the order trades, partly by the order itself
Implementation shortfall: Counted as opportunity cost
VWAP: Ignored: only filled shares are compared
Implementation shortfall: Its impact shows up as cost
VWAP: Its impact lifts the benchmark too, so cost looks smaller
Implementation shortfall: Urgent and default orders: the fund wanted the stock now
VWAP: Orders the portfolio manager explicitly asked to trade with the volume
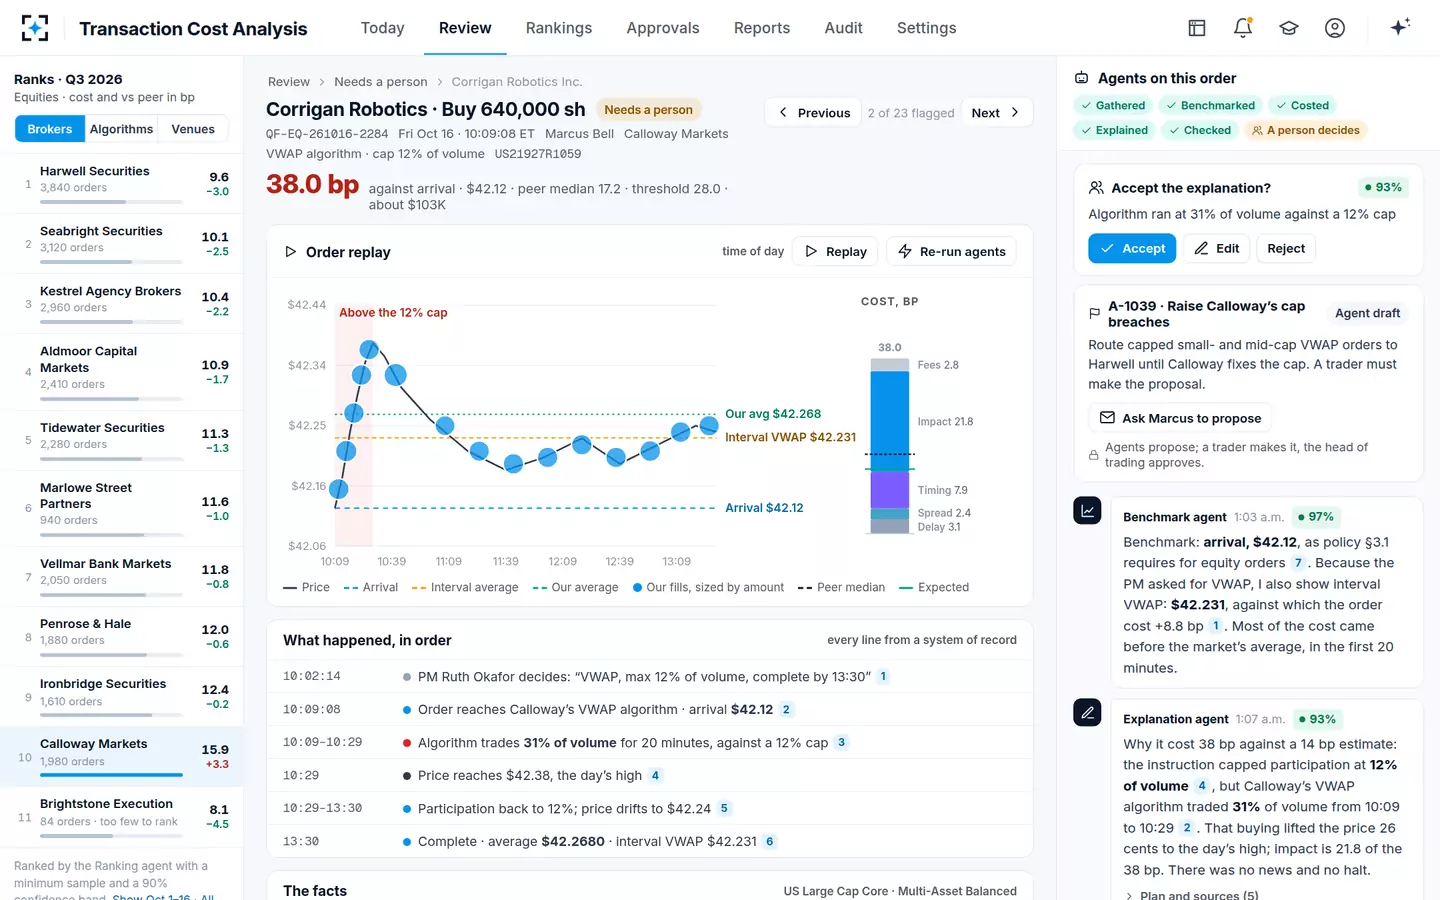
The sample data shows the size of the gap. A 640,000-share buy of the fictional Corrigan Robotics cost 38.0 basis points against its arrival price of $42.12 and 8.8 basis points against the interval VWAP of $42.231, because the algorithm's own aggressive buying in the first twenty minutes lifted the average it was then compared with. VWAP vs arrival price takes that order through four benchmarks.
Implementation shortfall on one order in Transaction Cost Analysis: 38.0 bp against arrival
Who invented implementation shortfall, and why it beat the alternatives
André Perold named and formalised the measure in "The Implementation Shortfall: Paper vs. Reality" in the Journal of Portfolio Management in 1988 (doi), and the SEC's 2003 release credits Jack Treynor with introducing the concept in 1981. The idea answered a practical problem: measures that compared fills with a price before or after the trade could each be flattered by when the trader chose to act.
The classic illustration, cited in the SEC release from David Leinweber's work, is a paper portfolio of Value Line's top-ranked stocks that returned 26.3% a year from 1979 to 1991, against 16.1% for a Value Line fund holding the same stocks. The release, following Leinweber, calls the difference between the paper return and the actual return the cost of trading. A real fund also carries fees and cash that a paper portfolio does not, so the ten points are an illustration rather than a measurement, but the comparison made the point stick: an idea is worth what it earns after it is traded.
Implementation shortfall, by the dates and figures that shaped it
1981
Treynor introduces the concept, per the SEC's 2003 release
1988
Perold's paper names the measure: paper versus reality
26.3%vs 16.1%
paper portfolio vs fund, a year, 1979–1991, the illustration the SEC cited
Where implementation shortfall misleads, and what regulators expect it to show
Implementation shortfall misleads when the decision price is wrong, when the horizon for unfilled shares is chosen after the fact, and when the market moves for reasons that have nothing to do with the order. A buy decided at the open on a day the index rises two percent will show a large shortfall that no trader could have avoided. That is why serious TCA reports implementation shortfall next to a market-adjusted figure and a pre-trade estimate, and compares each order with a peer group of similar size and urgency.
The SEC has recognised its place for institutional orders. Explaining why its 2018 routing report for not-held orders would not replace TCA, it wrote:
"Rule 606(b)(3) will not require reports to contain any information on implementation shortfall costs of parent orders, which are a key focus for investors placing not held orders."
SEC, Disclosure of Order Handling Information, 83 FR 58338 (November 19, 2018), footnote 676
The routing report and the shortfall answer different questions, and the Rule 606(b)(3) guide shows how to put them side by side.
Implementation shortfall in Transaction Cost Analysis: every order, every morning
In the solution, implementation shortfall against arrival is the benchmark for default and urgent equity orders, which were 71% of equity orders in the sample's first half of October, and arrival is used for program trades at portfolio level. The Cost agent computes it from the raw fills, splits it into delay, spread, timing, impact and fees, and compares it with the pre-trade estimate and the peer median. The Checker agent recomputes it independently, on a different model family, and a difference above 1.0 basis point goes to a person.
The threshold is part of the method, not an afterthought. In the sample execution policy an equity order is explained when its cost exceeds twice its pre-trade estimate, and never below 20 basis points; the Corrigan order's 14 basis point estimate set its threshold at 28.0. Any change to that rule is a proposal, back-tested on the last quarter, which compliance and then the head of trading must approve. The full workflow is on the Transaction Cost Analysis page.
Questions people ask
How do you calculate implementation shortfall in basis points?
Divide the shortfall in dollars by the paper investment, the decision price times the shares decided, and multiply by 10,000. In the worked example, $37,600 on a $5,000,000 decision is 75.2 basis points. Using the paper investment as the denominator keeps orders of different sizes and fill rates comparable.
Is implementation shortfall the same as slippage?
Slippage usually means the gap between the expected price and the fill price on executed shares, often against arrival. Implementation shortfall includes that and adds delay before arrival, opportunity cost on unfilled shares and fees. In the example, slippage on filled shares was $16,000: 32 basis points of the paper investment, or about 40 on the $4.0 million actually traded. The shortfall was 75.2, so the denominator must be stated with every figure.
Should implementation shortfall use the decision price or the arrival price?
The decision price measures the whole process, including the portfolio manager's handoff; the arrival price measures the desk and its brokers. Many firms report both, because a desk cannot fix delay it never sees, and a trader should not be judged on a delay that happened before the order reached them.
Can implementation shortfall be negative?
Yes. If the price falls after a buy decision, the fund buys more cheaply than the paper portfolio, and the shortfall is negative. A single negative result says little; a broker or algorithm whose orders are consistently below their pre-trade estimates across a large peer-matched sample is evidence of skill or of favourable conditions, and only the reasons tell which.
What end price should be used for unfilled shares?
The one the execution policy names in advance: commonly the close on the day the order was cancelled, or a fixed horizon. The SEC noted in 2003 that there was no generally accepted way to calculate implementation shortfall, so the method has to be written down and applied to every order the same way.