A market impact model estimates how much an order will move the price against itself, as a function of its size, the stock's volatility and the volume traded. The best-supported form is the square-root law: the price move over an order is roughly the daily volatility times the square root of the order's size as a fraction of daily volume, so an order four times larger moves the price about twice as far, not four times. Peer-reviewed work on 8 million institutional US equity trades finds impact grows in proportion to size only for the smallest orders, then bends into the square-root regime. That shape is why splitting and pacing an order is a measurable trade-off rather than a matter of taste, and why a pre-trade estimate is only useful if someone checks it against the result. Botminds' Transaction Cost Analysis does that check on every order: agents compare each cost with its pre-trade estimate and peers overnight, and explain in plain words the ones where impact ran far above the model.
The research and regulatory sources are linked where they appear. The worked figures are illustrative arithmetic; the order examples are the solution's sample data on a fictional asset manager, Quillfield Capital, and its fictional brokers.
The square-root law: impact grows with the square root of size, not in proportion
What is a market impact model?
A market impact model is a formula, fitted to past orders, that predicts the price concession an order will pay for demanding liquidity. The SEC described the cost it captures in 2003: market impacts are "the price concessions (amounts added to the purchase price or subtracted from the selling price) that are required to find the opposite side of the trade and complete the transaction" (SEC, 68 FR 74820, December 24, 2003). A model turns that idea into a number before the order is sent.
Every model takes the same inputs in some form: the order's size, the stock's normal daily volume, its volatility, the spread, and the pace at which the order will trade. It returns an expected cost in basis points, often with a range. That number has three jobs: choosing how fast to trade, setting the threshold above which a post-trade cost needs an explanation, and judging brokers and algorithms against what an order should have cost rather than against an average of unlike orders.
Models separate two kinds of impact. Temporary impact is the premium paid to get liquidity now, which fades once the order stops. Permanent impact is the part of the price move that stays, because the market has learned something from the order. Almgren and Chriss built their execution model on that split, treating "transaction costs arising from permanent and temporary market impact" as one side of the trader's problem (Journal of Risk, 2001).
What is the square-root law of market impact?
The square-root law says the price move over an order is proportional to the square root of its size relative to daily volume. Tóth and co-authors state it in its standard form: the average price change between the first and last trade of an order of size Q "is well described by the so-called "square-root" law", Δ(Q) = Y σ √(Q/V), "where σ is the daily volatility of the asset, and V the daily traded volume," and "The numerical constant Y is of order unity" (arXiv 1105.1694; published in Physical Review X, 2011).
The same paper records that published studies fit the exponent between 0.4 and 0.7 rather than exactly one half, and that the law nonetheless "appears to hold approximately in all cases". Its contribution was an explanation: liquidity close to the current price is thin, so "large metaorders have to be fragmented in order to be digested by the liquidity funnel." The concave shape follows from how little liquidity sits near the price at any moment.
The square-root law in four numbers
8M
institutional US equity trades in the crossover study
0.4–0.7
range of the size exponent across published studies
~1
the constant Y in the square-root formula, "of order unity"
5orders
of magnitude of size a logarithmic form fits, against about two for the square root
Is market impact linear for small orders? The crossover
For the smallest orders, yes: impact grows roughly in proportion to size, then bends into the square-root regime. Bucci, Benzaquen, Lillo and Bouchaud measured the bend directly. "Using a large database of 8 million institutional trades executed in the U.S. equity market," they wrote, "we establish a clear crossover between a linear market impact regime and a square-root regime as a function of the volume of the order" (arXiv 1811.05230; Physical Review Letters, 2019).
The practical reading is that two rules of thumb are both half right. A desk that prices small orders as if impact were proportional to size will be close; a desk that extends the same line to large orders will badly overstate their cost, and may slow them down more than the risk justifies. The dashed line in the first figure shows the gap: proportional impact fitted at 1% of volume predicts 100 basis points at 5%, where the square-root law gives about 45.
How to calculate market impact cost, step by step
To calculate expected market impact cost with the square-root law, take the order as a fraction of average daily volume, take its square root, and multiply by the stock's daily volatility and the model's constant; then convert to dollars on the order's value. The worked example uses round numbers so the arithmetic can be followed.
How to calculate market impact cost with the square-root law
| Step | Calculation | Result |
|---|---|---|
| 1. Order as a share of daily volume | 250,000 shares ÷ 5,000,000 shares a day | 5% |
| 2. Square root | √0.05 | 0.224 |
| 3. Multiply by daily volatility and the constant | 0.224 × 2% × 1 | 0.447% = 44.7 bp |
| 4. Price move in dollars per share on a $40 stock | 0.447% × $40 | about 18 cents |
| 5. Double the order to 500,000 shares | 2% × √0.10 | 63.2 bp: 41% more, not 100% |
| 6. Total dollars of impact on the doubled order | grows with size to the power 1.5 | about 2.8 times the first order's |
Step 6 is the one that changes how orders are traded. Per-share impact grows with the square root of size, but total impact cost is per-share impact times shares, so it grows with size to the power one and a half. Doubling an order multiplies its total impact bill by about 2.8. Slicing the order across more time lowers its participation and its impact, at the price of exposure to the market while it waits.
The Almgren–Chriss model: impact against risk
Almgren and Chriss framed execution as a choice between paying impact to finish fast and bearing price risk to finish slowly. Their paper considers execution "with the aim of minimizing a combination of volatility risk and transaction costs arising from permanent and temporary market impact," and shows that choosing among the resulting strategies by minimising value-at-risk "leads to the concept of liquidity-adjusted VaR, or L-VAR" (Almgren and Chriss, Journal of Risk, 2001). It is the reason most execution algorithms have an urgency setting.
The SEC described the same trade-off in plain words two years later: "Impact cost may be reduced by stretching out a trade over a long time period. The benefit of reduced impact cost may be reduced or eliminated by an increase in opportunity cost." The model makes that sentence computable; the implementation shortfall formula is how the result is measured afterwards, because it charges both the impact and the missed shares.
Temporary and permanent impact, and what each means for the order
Temporary impact: The premium paid to take liquidity now
Permanent impact: The part of the move that stays once the order is done
Temporary impact: Trading speed: participation rate and aggressiveness
Permanent impact: Total size, and what the market infers from the order
Temporary impact: Trading more slowly, passively or in blocks
Permanent impact: Little, except by trading less or hiding intent
Temporary impact: Fills well above the price that follows the order
Permanent impact: A higher price that persists into the next days
Temporary impact: Slower trading cuts it but raises risk and opportunity cost
Permanent impact: Unaffected by pace in the simplest models
Beyond the square root: participation rate and duration
The square root is a good approximation over a limited range, and the better models add the order's pace. Zarinelli, Treccani, Farmer and Lillo found that the square-root formula "provides a good fit only across about two orders of magnitude in order size", while "A logarithmic functional form fits the data better, providing a good fit across almost five orders of magnitude" (Market Microstructure and Liquidity, 2015). They modelled impact as a surface over both the order's duration and its participation rate.
Two of their observations matter for anyone reading a TCA report. They saw price trajectories that indicated non-VWAP executions, and they found that "sometimes the price starts reverting well before the end of the execution." An order that keeps buying after the price has started to fall back is paying for a move it no longer needs to chase; that is visible only in a replay of the fills against the price, not in an average.
Can a pre-trade market impact estimate be trusted?
Only as far as it has been tested against outcomes, order by order. Bank supervisors put the general rule well in their April 2026 model risk guidance: judge a model by setting what it predicted beside what actually happened, against what the model was meant to do and how it is used (Federal Reserve, OCC and FDIC, SR 26-2). The guidance is written for banking organisations, but the discipline fits any desk that sets thresholds from a model.
Brokers face a related duty in their pre-trade controls. FINRA's 2026 oversight report lists, among effective practices for market access controls, "using a benchmark when pricing child orders for a larger parent market order (e.g., the National Best Bid and Offer (NBBO) or last sale at the time of the initial child order route) to monitor the cumulative market impact of subsequent child orders over a short period of time" (FINRA, 2026 Annual Regulatory Oversight Report, December 2025). The buy side can ask whether its brokers do this, and check the answer in its own fills.
Five tests before trusting a pre-trade impact estimate
- Compare estimate with result on every order
A model is only evidence if the desk has a running record of predicted against realised cost, by size bucket.
- Check the bias, not just the error
Estimates that are too low on large orders and too high on small ones point to the wrong shape, often a linear model.
- Separate impact from market drift
A buy on a rising day looks expensive whatever the model said; compare with a market- or sector-adjusted figure.
- Re-fit after a change in market structure
Tick sizes, venue mix and volume patterns change the constant; an estimate fitted years ago may no longer hold.
- Explain the outliers before re-fitting
A halt, an auction or an algorithm above its cap is not model error and should not be fitted as if it were.
Market impact in Transaction Cost Analysis: estimate, result and reason
In the solution, the Cost agent compares every order's cost with its pre-trade estimate and with the peer median for like-for-like orders, and the sample execution policy sets the equity threshold at twice the estimate, never below 20 basis points. The point is the last test in the checklist: before an outlier is treated as model error, it gets a reason.
One order against its estimate: impact was most of the gap
That order is not evidence against the model. The instruction capped participation at 12%; the algorithm traded at 31%, which moved the order to a different point on the impact curve than the one it was priced at. The reason goes on the order, the broker's algorithm gets a question, and the estimate stays as it was. VWAP vs arrival price shows how the same order scored against its own interval average.
Costs above estimate that a known event explains, in Transaction Cost Analysis
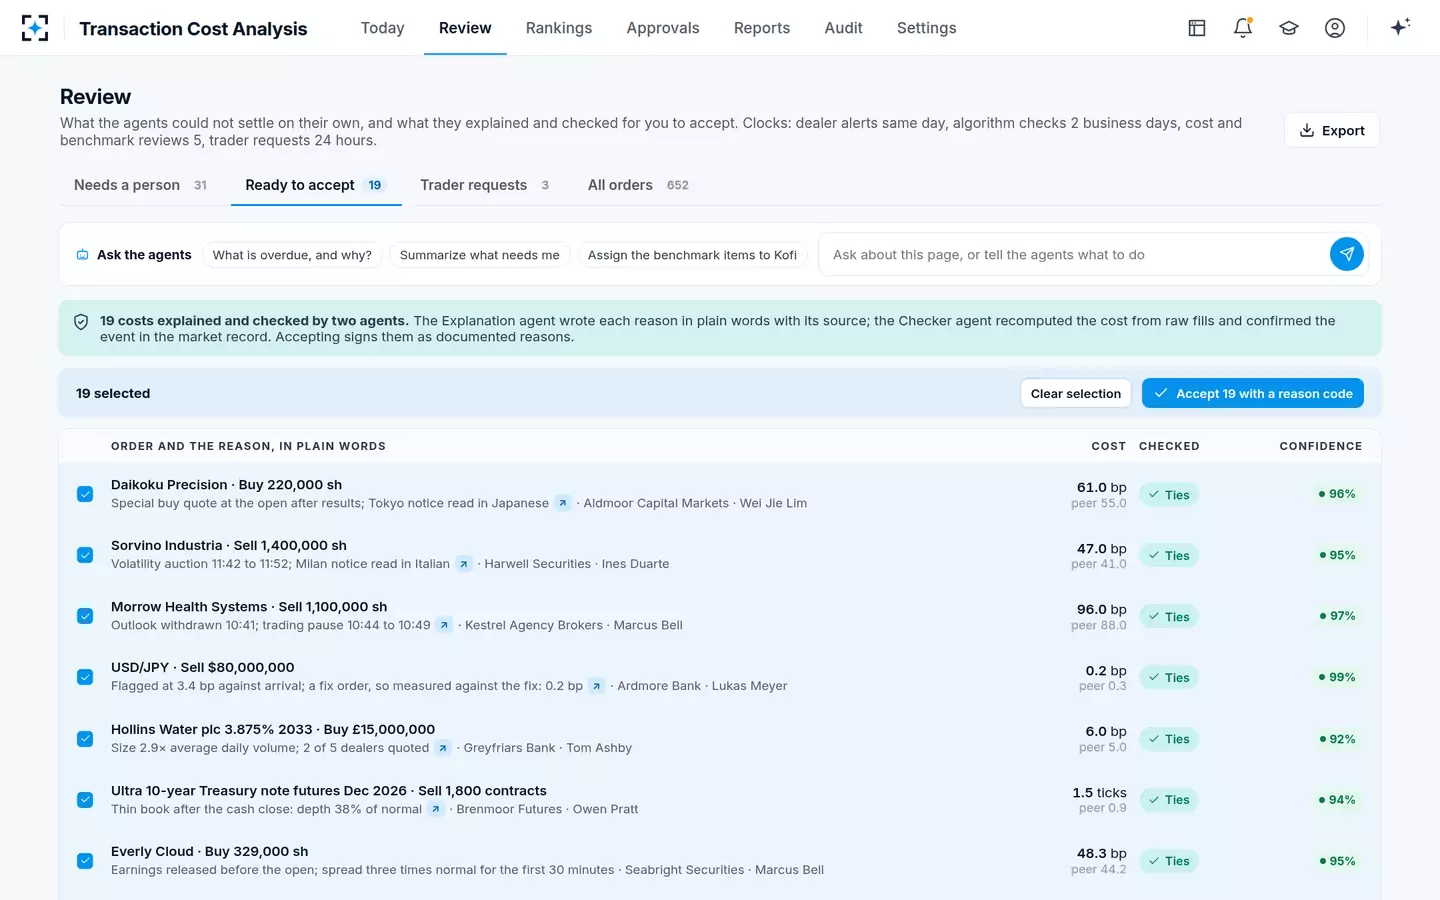
The bond and futures rows carry the same lesson in other markets. The Hollins Water buy was 2.9 times the bond's average daily volume and only two of five dealers quoted; in a market with no continuous order book, size against volume shows up as fewer and wider quotes rather than as a smooth curve, and fixed income TCA handles that with a fair-price benchmark instead. Agents in the solution never change routing or algo-wheel weights on the strength of one order; AI transaction cost analysis, traced step by step shows where the person comes in. The full workflow is on the Transaction Cost Analysis page.
Questions people ask
What is the market impact formula?
The most widely used is the square-root law: impact ≈ Y × σ × √(Q/V), where σ is daily volatility, Q the order size, V daily volume and Y a constant of order one. With 2% volatility, an order of 5% of daily volume moves the price about 45 basis points. Firms fit Y, and often the exponent, to their own fills.
How does order size relative to volume change trading cost?
Per-share impact rises with the square root of the order's share of daily volume, so quadrupling the size roughly doubles the per-share cost. Total impact cost rises faster, with size to the power 1.5. That is why participation caps, such as 12% of volume, are written into instructions.
Does the square-root law hold in bonds and FX?
The studies cited here are of US equities. Bonds trade by request for quote and FX through dealers and platforms, so impact shows up as wider quotes, fewer responses or rejected requests rather than a price path through an order book. The principle that cost rises less than proportionally with size is widely assumed there too, but the evidence above does not test it.
What is the difference between market impact and slippage?
Slippage is the whole gap between an expected price and the fill price; market impact is the part of that gap caused by the order itself. Slippage also contains market drift and spread. TCA separates them by modelling impact and comparing with the market's move over the same interval.
Is market impact permanent?
Partly. Some of the move reverts after the order ends and some stays. Zarinelli and co-authors found the price sometimes starts to revert before the order finishes, and that the level it settles at depends on the order's participation rate and duration.