Returns-based style analysis estimates a manager's style by regressing its returns on a set of style indexes over a trailing window, often 36 months; holdings-based style analysis measures style directly from the securities the portfolio holds at each date, such as weighted median market cap and a value–growth score. The first needs only returns and works on any fund; the second needs holdings and sees a change the quarter it happens. When a manager drifts, the trailing window keeps reporting the old style until enough months of the new one accumulate, so the two methods disagree exactly when the answer matters. Botminds' Investment Policy Statement Monitoring measures each equity manager's style from holdings at every quarter end, splits any drift into the manager's own trades and price moves, and cross-checks the result against returns-based style before anyone sees it.
The worked example is a fictional sample manager in the solution's sample retirement system, Ridgeline County, in October 2026. The research cited is peer-reviewed or an NBER or SSRN working paper, labelled as such.
Two ways to measure the same manager’s style, side by side
Returns-based style analysis: Monthly returns of the fund and of a set of style indexes.
Holdings-based style analysis: The portfolio’s holdings at each date, with each security’s size and value–growth characteristics.
Returns-based style analysis: The mix of style indexes that best tracks the fund’s returns over the window.
Holdings-based style analysis: Where the portfolio actually sits: weighted median market cap, value–growth score, share held below a size.
Returns-based style analysis: Slowly: each new month is one observation in a 36-month window.
Holdings-based style analysis: At the next holdings date: a quarter end, or daily for a separate account at the custodian.
Returns-based style analysis: Wrong or missing style indexes give confident, wrong answers.
Holdings-based style analysis: Trades between holdings dates, and anything not captured in the security data.
Returns-based style analysis: Small blend, from a 36-month regression dominated by two years of small-value history.
Holdings-based style analysis: Mid-cap growth: weighted median market cap $8.7 billion against a $6.0 billion limit.
Returns-based vs holdings-based style analysis: which should a committee trust?
A committee should trust holdings for whether a manager is inside its guidelines and use returns as a cross-check, because guidelines are written in holdings terms: a market-cap limit, a share of the portfolio below a size, a minimum in a sector. A returns regression can say a fund behaves like small value; it cannot say whether 61.7% or 85% of the portfolio is in companies under $10 billion, which is what the agreement tests.
That is not a verdict against returns-based analysis. It works without holdings, on any fund with a return history, and research on mutual funds found it gives "insights not available through commonly used 'peer' evaluation alone" (Ben Dor and Jagannathan, NBER Working Paper 9111). The question is which method should open an exception, and which should explain one.
What is style drift?
Style drift is a manager moving away from the investment style it was hired for, such as a small-cap value manager whose portfolio becomes mid-cap growth. It matters to a pension or endowment because the allocation was built from style buckets: a drifting manager leaves a gap in one and doubles exposure in another, whatever its returns.
Drift is not rare and not always bad for the manager's own record. In a study of US equity mutual funds, Chan, Chen and Lakonishok found that "Funds' styles tend to cluster around a broad market benchmark" and that "funds with poor past performance are more likely to change styles" (NBER Working Paper 7215; Review of Financial Studies, 2002). For the fund that hired the manager, the cost is in the allocation, not necessarily in the manager's return.
How returns-based style analysis works, and why its window lags
Returns-based style analysis, introduced by William Sharpe in 1992, finds the combination of style index returns, with weights that are non-negative and sum to one, that best explains the fund's return over a window (Sharpe, Journal of Portfolio Management, 1992). The weights are read as the fund's effective style mix: 70% small value and 30% small growth, for example.
Two features make it slow and fragile. The first is the window. With 36 monthly observations, a change of style that happened three months ago is three of the 36 data points; the regression is still mostly describing the old manager. The second is the index set. Ben Dor and Jagannathan "demonstrate the importance of selecting the right style benchmarks and how the use of inappropriate style benchmarks may lead to wrong conclusions"; for sector funds, they write, "the set of benchmarks should include sector or industry indexes."
Five quarter ends of one small-cap value manager, measured from its holdings
| Quarter end | Weighted median market cap | Value–growth score | Months of the new style in a 36-month window |
|---|---|---|---|
| Q3 2025 | $3.1B | −0.62 | 0 |
| Q4 2025 | $3.4B | −0.58 | 0 |
| Q1 2026 | $3.9B | −0.49 | 0 |
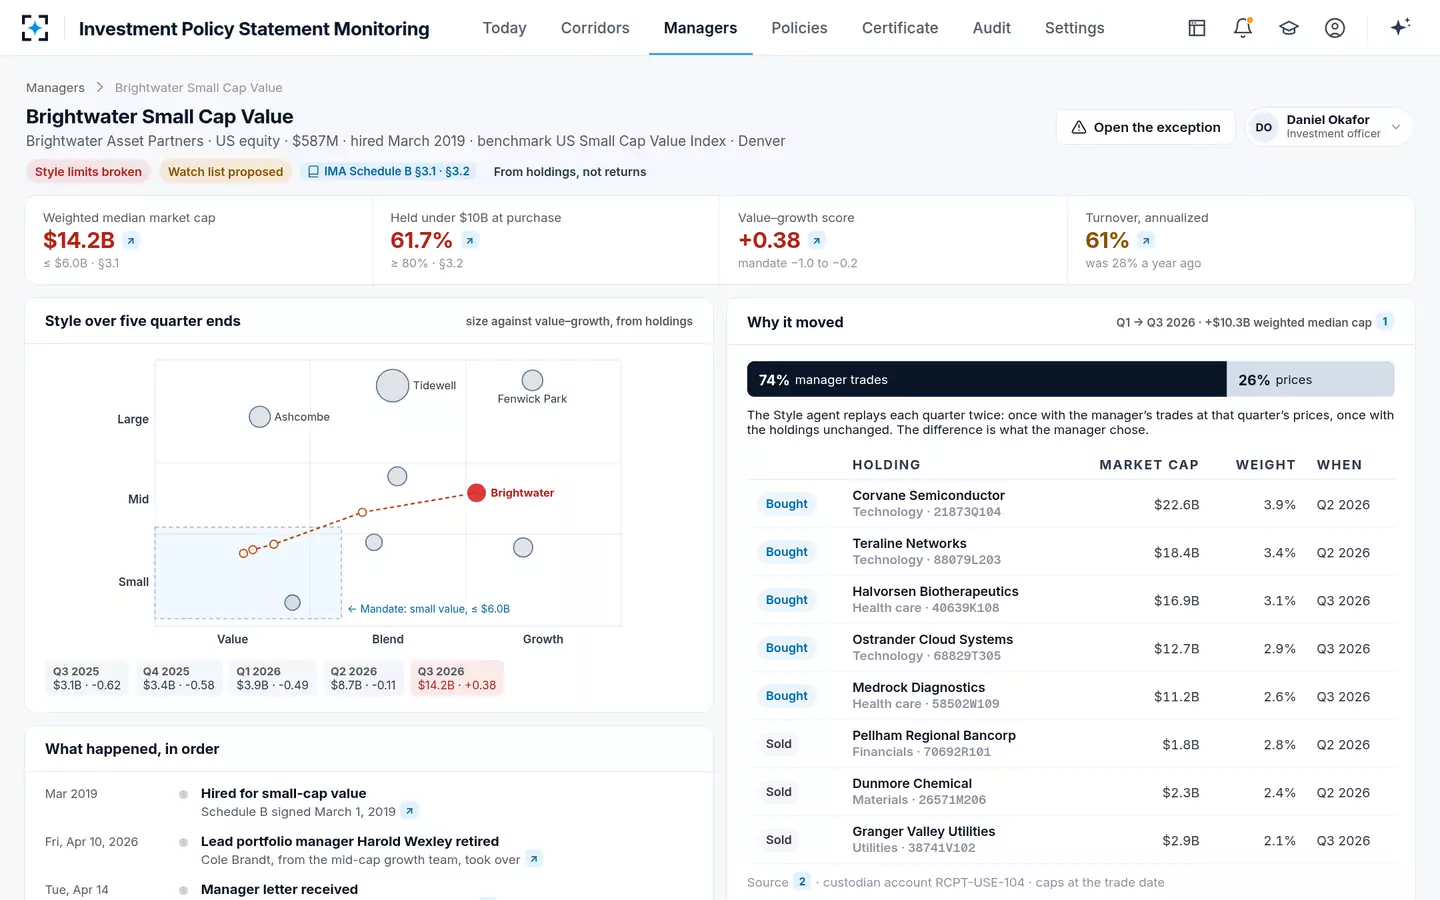
| Q2 2026 | $8.7B | −0.11 | about 3 (8%) |
| Q3 2026 | $14.2B | +0.38 | about 6 (17%) |
The last column is the whole problem. At June 30, when the holdings were already mid-cap growth, about one month in twelve in the regression's window came from the new style. The sample's 36-month regression still placed the manager in small blend that day. By September 30 the holdings showed a weighted median cap more than twice the limit, and the new style was still only about a sixth of the returns history.
How is style drift measured from holdings?
From holdings, style is a set of portfolio statistics computed from each security's characteristics and weight: weighted median market cap, a value–growth score built from measures such as book-to-price and earnings growth, and the share of the portfolio meeting a guideline test, for instance "in companies under $10 billion at purchase." Drift is the change in those statistics between dates, measured against the limits in the manager's guidelines.
Holdings also allow something returns cannot: separating why the portfolio moved. Wermers developed "holdings-based measures of drift" that "allow a decomposition of style drift into components that result from active versus passive portfolio decisions," and found that "a significant amount of style drift results from active manager trades" (Wermers, SSRN working paper, 2012, not peer reviewed in this form). That split is the difference between a manager that chose a new style and one whose holdings simply grew.
Why the sample manager moved, as Investment Policy Statement Monitoring splits it: trades over prices
Change in weighted median market cap, Q1 to Q3 2026 (+$10.3 billion)
- Manager’s trades · 74%
- Price moves · 26%
What holdings-based analysis cannot see
Holdings are snapshots, and a manager can trade between them. Kacperczyk, Sialm and Zheng measured the "return gap," the difference between a fund's reported return and the return of its previously disclosed holdings after expenses, and found that it helps predict future performance (NBER Working Paper 11766; Review of Financial Studies, 2008). For style monitoring, the lesson is that a quarter-end snapshot can miss a manager that window-dresses or trades heavily inside the quarter.
For a separate account the gap narrows sharply, because the plan's own custodian holds the securities and reports holdings and transactions daily. A plan that monitors from the custodian file, rather than from the manager's quarterly report, sees the trades as they settle. Returns-based analysis remains the right check for commingled funds where holdings arrive late, and a useful independent check everywhere else.
Replay the drift: test both methods on managers you have already judged
The best way to choose a style method is to replay it on cases whose answers you already know. Every plan has a few: managers that were placed on watch or replaced for style, and managers that stayed on-style through a hard market. Run both methods quarter by quarter over the two years before each decision, and count which one would have raised the question first, and how often each raised it for a manager that turned out to be fine.
A replay test for style monitoring, run on your own closed cases
- Pick the cases before running anything
Three to five managers you replaced or put on watch for style, and as many you kept through a style-stressed market.
- Use the guidelines that applied at the time
The limits in the agreement then, not today’s, so the replay asks the question the committee faced.
- Run the returns regression as you would have
The same window, the same style indexes, recalculated at each quarter end with only the data available that day.
- Measure holdings at the same dates
Weighted median cap, value–growth score and each guideline test, from the custodian or the manager’s holdings report.
- Score lead time
Quarters between each method first breaching a limit and the date the committee acted.
- Score false alarms
Quarters a method flagged a manager that you kept and that stayed within its mandate.
- Check the split
For each drift, the share from trades against prices: does it match what the manager told you at the time?
- Decide the counting rule last
One quarter end outside limits, or two, set from the replay results rather than from habit.
A replay usually settles the argument faster than a debate about methods. If the holdings test would have opened the question two or three quarters earlier on the cases the committee already decided, and raised few questions on the managers it kept, the choice is made on evidence the committee itself produced.
Holdings-based style in Investment Policy Statement Monitoring: five quarter ends and the trades behind the drift
Can a manager drift and still beat its benchmark?
Yes, and the sample manager is doing it. Over one year it returned +9.8% against +2.1% for its small-cap value benchmark, while its holdings moved into mid-cap growth. A performance screen saw a winner. The plan saw something else: small-cap value at about 0.9% of the trust against the 2.5% intended, because the manager hired to provide it had stopped.
Research suggests this is not unusual. Wermers reports that managers with more style drift, including growth-oriented funds and good stockpickers, "also deliver better future portfolio performance as a result of their trades," that "managers tend to be "style chasers" during most years," and that "controlling the style drift of a fund manager does not necessarily result in higher performance for investors." For a plan, that is an argument for clear guidelines rather than against them: the allocation is the plan's decision, and a manager outperforming by leaving its mandate is still outside it.
The sample's Evidence agent puts it plainly when the question comes up: "Returns are ahead of the benchmark, +9.8% against +2.1% over one year, so this is not a performance case: the Trust is simply not getting the small-cap value exposure it hired." The watch list criteria exist for cases like this, where the trigger is style and people, not returns.
Trades or prices: why the split decides the next step
The split between active and passive drift tells the committee what to ask. Drift that comes mostly from price moves, a small company that grew, is often the manager doing its job: buying small value that became large. The guidelines usually handle it by testing size "at purchase" and allowing time to sell. Drift that comes mostly from the manager's own purchases is a choice, and it is a choice to explain.
In the sample, 74% of the change came from trades, it began at the first quarter end after a change of lead portfolio manager, and turnover rose from 28% to 61%. Each fact on its own might be noise; together they are what an inquiry letter should ask about. The settings decide how many quarter ends outside the limits open an exception; in the sample, one.
Every agent’s run, with its sources, confidence and hand-off
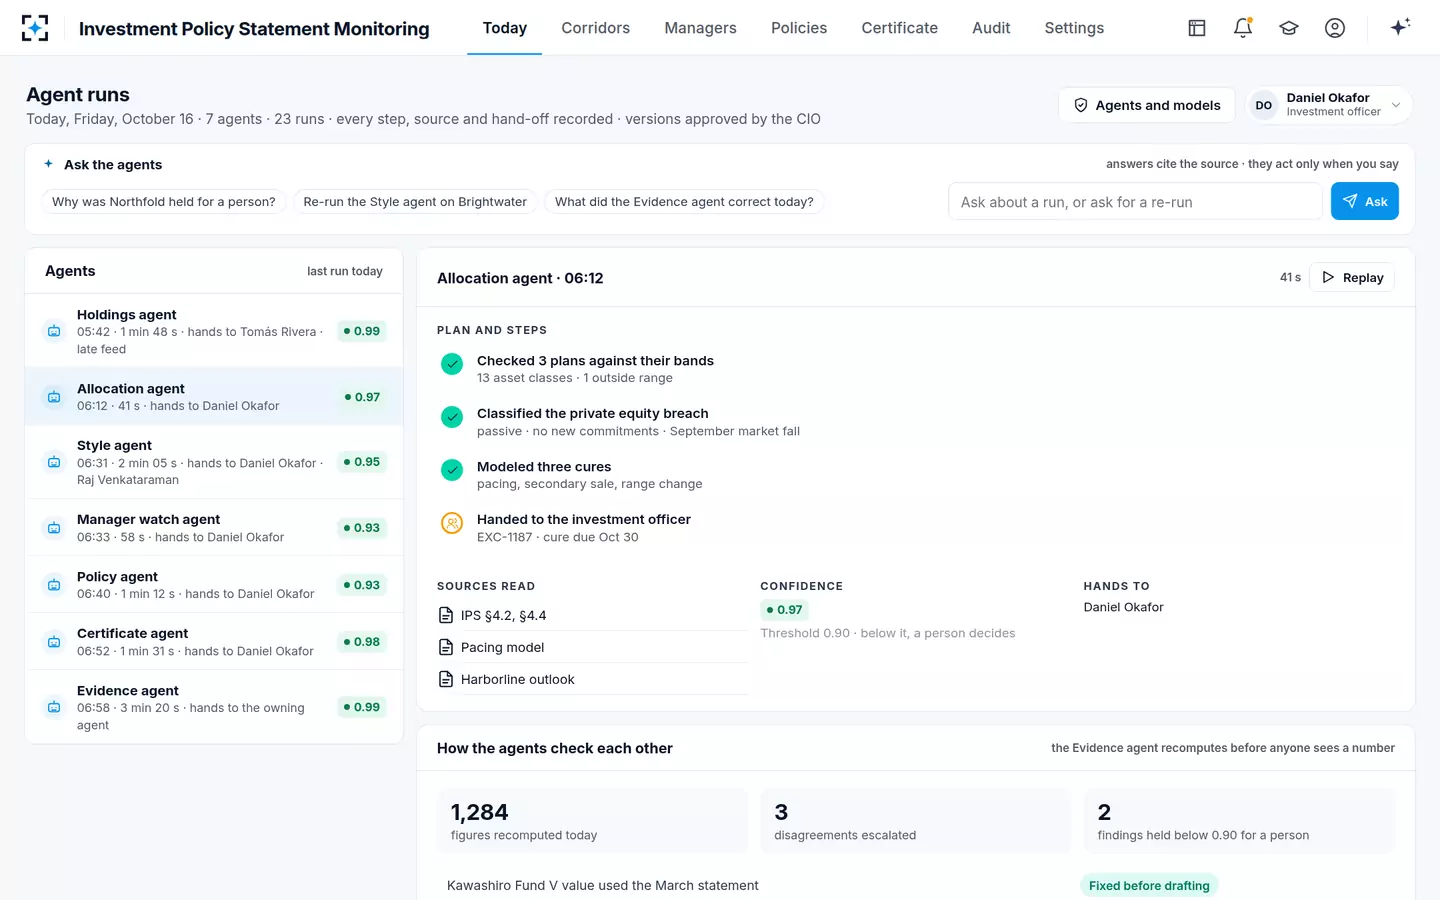
To see holdings-based drift measured and cross-checked against returns, start from Investment Policy Statement Monitoring; the investment monitoring software guide covers the rest of the daily checks.
Questions people ask
What is Sharpe's returns-based style analysis?
It is the method William Sharpe published in 1992: a constrained regression of a fund's returns on a set of style index returns, with weights that are non-negative and add up to one. The weights describe the fund's effective style. It needs only returns, which is its strength, and it reflects the whole window, which is why it is slow to see a change.
How many months of data does returns-based style analysis need?
There is no fixed rule; the sample uses 36 monthly returns, and fewer observations make the weights less stable. The trade-off is lag: with 36 months, a style change three months old is about 8% of the data. Rolling shorter windows react faster but swing more, so test both on managers whose history you know.
What does style drift mean for an investor?
It means the portfolio is no longer giving the exposure the investor hired it for. For a pension or endowment that built its allocation from style sleeves, a drifting manager leaves one sleeve short and another doubled. In the sample, a small-cap value sleeve meant to be 2.5% of the trust was effectively 0.9%.
Can holdings-based analysis be used for hedge funds?
Only where holdings are available often enough, which for many hedge funds they are not; that is where returns-based analysis earns its place. Ben Dor and Jagannathan showed how to analyze hedge fund styles by adding option-based strategy returns to the style benchmarks. For long-only separate accounts held at the plan's custodian, holdings are available daily.
Is style drift a guideline breach?
When the guidelines set style limits in holdings terms, yes: a weighted median market cap above the limit, or too little of the portfolio below a size at purchase, breaks the agreement. When they only name a benchmark, drift is a watch-list question rather than a breach, which is a reason to write the limits down.