The Fannie Mae target defect rate is a number each lender sets for itself: the share of loans in its post-closing random QC sample that may carry a defect at its highest severity level, the level reserved for loans not eligible as delivered. Selling Guide D1-1-01 requires the target to be "as reasonably low as possible", measured at least quarterly, reported to management, and evaluated and reset at least annually, with the rationale written down. Fannie Mae does not publish an acceptable rate. It reserves the right to look at the one you chose and "provide input on a more appropriate target". Mortgage QC Automation keeps that random sample as the yardstick.
The hard part is not choosing the number but measuring against it. A 10% random sample gives a lender an estimate of its defect rate with an error band that, at the defect rates lenders actually see, can be wider than the rate itself, and it finds the defects only in the loans it happens to draw. Botminds' Mortgage QC Automation keeps the random sample as the lender's measure and adds a review of every other closed loan, so the two numbers can be read side by side. The method first.
The Fannie Mae target defect rate, in four requirements
Top
severity level must carry a target; others may
The level for loans ineligible as delivered
10%
random post-closing sample, full-file, is the basis (or a statistical sample)
D1-3-01
≥4×
a year: performance measured at least quarterly, reported to management
1×
a year at least: target evaluated and reset if necessary, rationale documented
What is a target defect rate in mortgage QC?
It is the lender's own ceiling for the share of loans with serious defects, against which QC performance is reported. Fannie Mae requires a "methodology for identifying, categorizing, and measuring defects and trends against an established target defect rate"; different targets may be set for different severity levels, but "at a minimum a target defect rate must be established for the lender's highest level of severity" (D1-1-01). The target is "based on the lender's post-closing random QC sample", which D1-3-01 calls "a critical measure of loan quality" and "the basis for calculating the lender's defect rate" (D1-3-01).
The monthly report carries it. Post-closing reports must include "data for the highest severity classification defect rate, benchmarked against its defined target rate, at least quarterly", alongside three months of defect trending. A target with no rationale fails the rule as surely as a missing one: the lender "must document the rationale for establishing the target rate(s)".
What is Fannie Mae's acceptable defect rate?
There is none in the Selling Guide. Fannie Mae asks for a target "as reasonably low as possible" and says it "may assess how the lender's chosen target defect rate affects Fannie Mae's risk and may provide input on a more appropriate target". The absence is deliberate: a lender's rate depends on its severity definitions, its product and channel mix and the depth of its reviews, so one industry number would reward lenient grading. Industry trackers published by QC vendors are not Fannie Mae standards and define their categories in their own ways; they do not belong in a QC plan's rationale.
The government side is different, because FHA publishes its own review results. In fiscal 2022 FHA's Loan Review System completed 27,405 underwriting reviews and rated 11.26% net material, after lenders' responses. Random selections ran at 3.40%; early payment defaults at 9.12% (HUD, FHA Quality Assurance Update, January 2023). Those are FHA's findings on FHA loans, graded on FHA's scale, and not a conventional benchmark; they are the best public evidence of how much the way loans are chosen changes the rate you see.
How a loan is chosen changes the defect rate you measure: FHA reviews, fiscal 2022
What is a critical defect rate?
"Critical defect rate" is the industry's name for the share of loans with a defect at the top of the severity scale, the one that makes a loan ineligible as delivered. In Fannie Mae's own language the closest term is "significant defect": a defect that "necessitates a change to the price on which the loan was acquired or result[s] in the loan being unacceptable for purchase" had the facts been known (Selling Guide D2-1-03). Your plan can call the level critical, significant or severity 1; what matters is that it lines up with that definition, because that is the level the target, the self-report and any repurchase discussion all turn on.
How do you calculate a mortgage defect rate?
Divide the loans in the post-closing random sample with at least one defect at the top severity level by the loans in the random sample reviewed, for the quarter. Three rules keep the number honest. Count loans, not findings, since a loan with two significant defects is one ineligible loan. Leave discretionary selections out of the denominator and the numerator, because they were chosen for risk; report them separately. And count the grade after rebuttal but before cure: a defect that existed at delivery was a defect, whatever was fixed later.
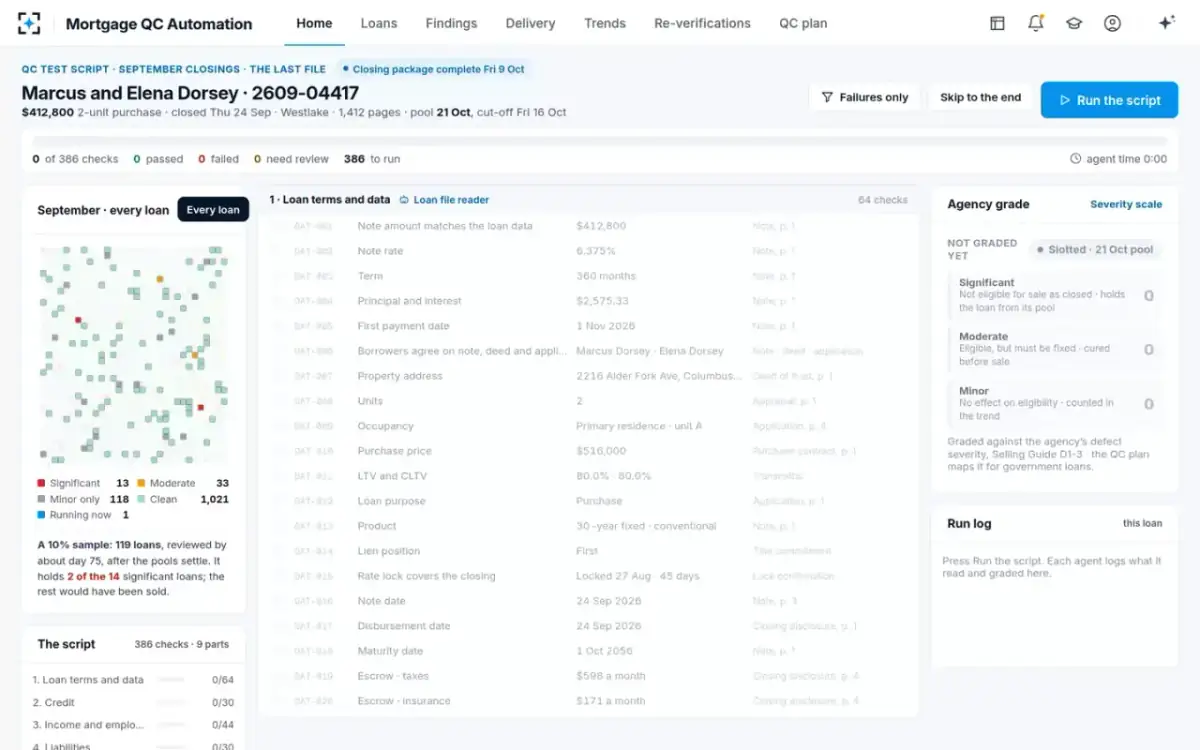
Take Halden Ridge Home Loans, the fictional lender whose September runs through Botminds' Mortgage QC Automation in this series. It closed 1,186 loans; its 10% random sample was 119. Because the solution also graded every loan, the true September count is known: 14 loans with a significant defect, or 1.18%. The random sample happened to contain 2 of them, a measured rate of 1.68%.
How precise is a 10% random sample?
Less than most QC reports imply. Two significant defects in 119 loans gives a 95% confidence interval, by the Wilson method, of roughly 0.5% to 5.9%: the sample cannot tell a lender running at 1% from one running at 5%. A full quarter of samples narrows it but not much: four in 357 loans gives about 0.4% to 2.9%. Those intervals are our arithmetic on the sample lender's figures, using the standard methods for a proportion (NIST/SEMATECH e-Handbook of Statistical Methods, 7.2.4).
That is the same arithmetic behind the statistical alternative to 10%. Fannie Mae allows a sample built on "a 95% confidence level with a 2% precision rate and a statistical statement of six months"; FHA, for lenders above 3,500 FHA loans a year, a stratified sample at 95% confidence and an interval of no more than 2% "based on the defect rates for FHA-insured Mortgages recently reviewed" (4000.1, V.A.3.a.iii). The required size depends on the defect rate you assume, which is why that assumption is audited.
How big a statistical QC sample must be, by the defect rate you assume
| Assumed defect rate | Sample, large book | Six months of 1,186 a month | Per month | 10% sample per month |
|---|---|---|---|---|
| 50% (no assumption) | 2,401 | 1,795 | 299 | 119 |
| 10% | 864 | 771 | 128 | 119 |
| 5% | 456 | 429 | 72 | 119 |
| 3.4% | 315 | 302 | 50 | 119 |
| 2% | 188 | 183 | 31 | 119 |
| 1% | 95 | 94 | 16 | 119 |
Getting the assumption wrong is an audit finding. HUD's inspector general found that loanDepot "used a flat 5 percent defect rate stated in its QC plan rather than defect rates on loans recently reviewed as HUD required", did not stratify by product type and origination source, and so performed 2,376 post-closing reviews over two years where it estimated at least 3,566 were due, about 1,190 short, on loans totaling about $329 million (HUD-OIG 2025-NY-1002). A statistical sample saves work only if its inputs are defensible, and at the defect rates in the table the saving buys a less precise number.
A ±2% precision band on a 1% defect rate does not measure the rate; it confirms the rate is small. Set the target knowing which of the two your sample can do.
How to set a target defect rate you can defend
Start from your own history on the random sample, not an industry number: the rate at the top severity level over the last four to eight quarters, with its confidence interval. Set the target below the recent rate if the trend or the rule demands improvement, and never above what Fannie Mae would see if it re-reviewed your loans. Write down why: product and channel mix, a change in severity definitions, a known problem being fixed. Then decide in advance what happens when a quarter breaches the target. A target with no consequence is a reporting line, not a control.
Expect the definitions to move the number more than the loans do. A lender that moves a defect type from moderate to significant will see its rate jump with no change in production quality. That is why D1-1-03 requires "consistent methodology and terminology, including defect categories and severity levels", and why a change to the scale needs its own note in the report. FHA's grading adds a further wrinkle: its fiscal 2022 statistics separate gross ratings at first review from net ratings after lenders mitigate, and the target belongs on one basis, stated in the plan.
What does a random QC sample miss?
Nine loans in ten, by design. The random sample estimates the rate; it finds defects only in the loans drawn. At the sample lender, a 10% sample would be expected to contain about 1.4 of September's 14 significant loans, and the other twelve or so would go to their pools without review. That is not a flaw in the rule: Fannie Mae's sample is a measurement, and it adds a discretionary sample to look for trouble. The flaw is treating a measurement as a control.
Same September, two views of the defect rate
10% random sample alone: 119 random (plus discretionary)
Random sample plus every loan reviewed before sale: 1,186, with the 119 random loans still re-verified in full by auditors
10% random sample alone: 2 found in the sample; the rate is estimated at 1.68%, interval about 0.5%–5.9%
Random sample plus every loan reviewed before sale: 14 found, 1.18% of the month, each with its loan and evidence
10% random sample alone: As the sampled reviews finish, inside a cycle of up to 90 days after the month
Random sample plus every loan reviewed before sale: As each closing package is complete, before its pool cut-off
10% random sample alone: Unknown; at least the defects outside the sample
Random sample plus every loan reviewed before sale: 0.25% after cures in the sample data, against 1.52% in May, the last month on the sample alone
10% random sample alone: The lender’s production
Random sample plus every loan reviewed before sale: The lender’s production and the agents’ accuracy on the same loans
The second column changes what the target is for. The random-sample rate still goes against the target, as the Guide requires. But the lender also knows the number the target was standing in for: how many loans it actually sold with a significant defect. In the sample data that fell from 1.52% in May, when only the sample was reviewed and it was reviewed after sale, to 0.25% in September after pre-sale cures. Why reviewing before the sale matters is the subject of QC before the sale.
In Mortgage QC Automation, the random sample measures the agents too
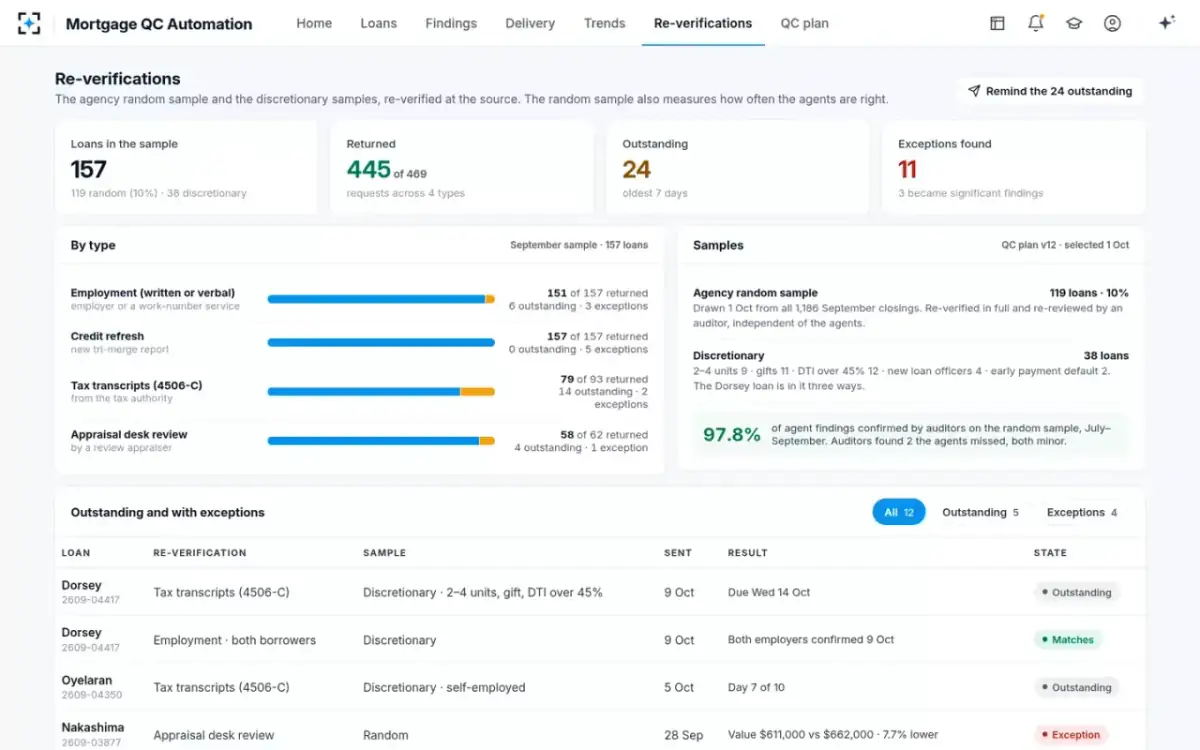
The random sample as the human baseline
Any automated QC review needs a yardstick, and the rulebooks already provide one. The random sample is drawn without regard to risk, reviewed in full and re-verified at the source by people independent of production, which makes it the cleanest available judgment of what each sampled loan's defects really were. Run the agents over the same loans and compare: findings both found, findings only the auditor found, and findings only the agents raised that the auditor rejected. On the sample lender's data from July to September, auditors confirmed 97.8% of agent findings on the random sample and found two the agents missed, both minor.
That comparison is what a model risk team will ask for, and it should be reported the way the defect rate is: by quarter, with counts and not just percentages. A lender considering this can test it on its own loans before relying on it; one month side by side with a QC vendor sets out the measures. And because early payment defaults run far above random loans in FHA's data, they are the first place to look for what a sample misses; early payment defaults first explains why.
What a 10% sample reads, against every loan Mortgage QC Automation graded
Questions people ask
Does Fannie Mae publish a target defect rate?
No. The Selling Guide requires each lender to set its own target for its highest severity level, as reasonably low as possible, based on its post-closing random sample. Fannie Mae may assess the target and suggest a more appropriate one.
Should the discretionary sample count in the defect rate?
Not in the rate measured against the target. Discretionary selections target higher-risk loans, so including them overstates the book's rate. Report their results separately, as D1-1-03 requires summaries of random, discretionary and component reviews.
What defect rate does FHA see?
In fiscal 2022, 11.26% of 27,405 FHA underwriting reviews were rated net material. Random selections ran at 3.40% and early payment defaults at 9.12%; income, credit and assets caused about 57% of the material findings.
How often must a target defect rate be reset?
It must be evaluated and, if necessary, reset at least annually, with the rationale documented. Performance against it must be measured at least quarterly and reported to management.
Is a statistical sample better than 10%?
It is smaller when defect rates are low, which is its appeal, but at 2% precision it measures low rates poorly and its size depends on an assumed rate auditors will test. FHA restricts it to lenders above 3,500 FHA loans a year and requires the assumption to come from recently reviewed loans.