How much clinical trial monitoring costs is a question the published literature answers sideways. There is no peer-reviewed figure for monitoring as a whole; what exists is a well-studied slice of it — source data verification, estimated at a quarter to two-fifths of a trial's cost and about 46% of the time spent on site — and a set of trials comparing extensive on-site monitoring with risk-based approaches, where the on-site arm cost several times more and was not shown to find more major or critical problems. What none of that research measures is the hours after the visit: writing the report, reconciling it with the study data, chasing last visit's open actions and reviewing it before signature. Botminds' Monitoring Visit Report Automation works on exactly that unmeasured part, which makes being honest about the numbers on this page more important, not less.
Every published figure below is linked to the study it comes from. Every figure describing the solution is its own sample study data on fictional studies and sites, or a stated design target — never a customer's measured result.
What the published research measures, and what it leaves out
25–40%
of clinical trial cost estimated to be attributable to source data verification
46%
of on-site monitoring time attributed to source data verification
3.4×
the cost of extensive on-site monitoring against a risk-based approach, in one trial
1.03
risk ratio for major or critical findings, extensive on-site against risk-based monitoring (95% CI 0.81 to 1.33)
How much does clinical trial monitoring cost? What the published numbers say
The most-cited figure is about verification rather than monitoring. A 2024 scoping review in the Journal of Clinical and Translational Science opens with it: "Estimates for the portion of clinical trial costs attributable to SDV range from 25% to 40%", and adds that "An estimated 46% percent of on-site monitoring time has been attributed to Source Data Verification (SDV)". The review synthesised 28 articles, sixteen of them quantitative.
Two cautions travel with those numbers. They are estimates carried forward in the literature, not a costing exercise anyone has repeated on a current portfolio. And they describe the single most mechanical activity in monitoring — comparing a case report form field with its source — which is the activity most reduced by risk-based approaches in the years since. A sponsor quoting 25% to 40% today should say which year's practice it describes.
What the published shares actually cover
A trial’s total cost, at the low published estimate
- Source data verification · 25%
- Everything else in the trial · 75%
A trial’s total cost, at the high published estimate
- Source data verification · 40%
- Everything else in the trial · 60%
Time spent on an on-site monitoring visit
- Source data verification · 46%
- Everything else on site · 54%
A quarter to two-fifths of trial cost: what that figure covers
It covers the monitor's time on site comparing records, the travel that puts them there, and the data management that follows from what they find. It does not cover the report. It does not cover the sponsor-side review of the report. It does not cover the chasing of unresolved actions between visits.
The same review is unusually candid about the limits of the evidence underneath its own headline. It reports that no absolute measures of source data verification accuracy were identified across the included studies, and that while two included articles concluded the errors verification found had no impact on study results, another concluded that the errors it found would otherwise have affected them. In other words, the field knows what verification costs rather better than it knows what it buys.
Where do a CRA's hours actually go?
No published study we know of gives a credible breakdown, and it is worth saying so plainly rather than repeating an unsourced split. The occupational descriptions give the shape of the job without the hours: the US Department of Labor's own occupational data for clinical research coordinators lists, among the tasks, "Prepare for or participate in quality assurance audits conducted by study sponsors, federal agencies, or specially designated review groups" alongside scheduling, eligibility assessment and documentation. What proportion of a week each takes is not recorded.
Figures do circulate — a share of a monitor's hours spent on site, a number of off-site hours a month — but they come without a published method, so there is no way to tell what was counted, on which studies, or in which year. A workload figure with no visible denominator cannot be checked against your own studies, however often it is repeated.
That leaves sponsors in an odd position: the activity they are asked to optimise is the one with no public denominator. The only reliable figure is the one you take yourself, on your own studies, with a stopwatch and ten reports.
The hours nobody has measured: writing and reviewing the report
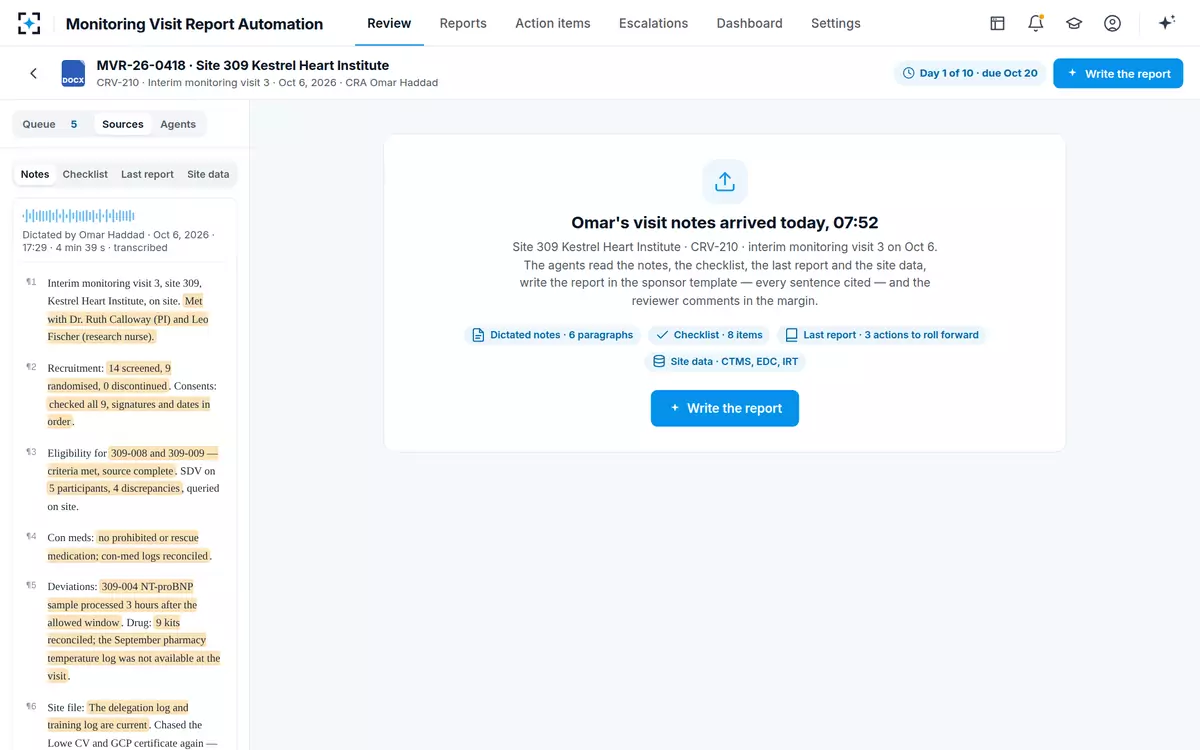
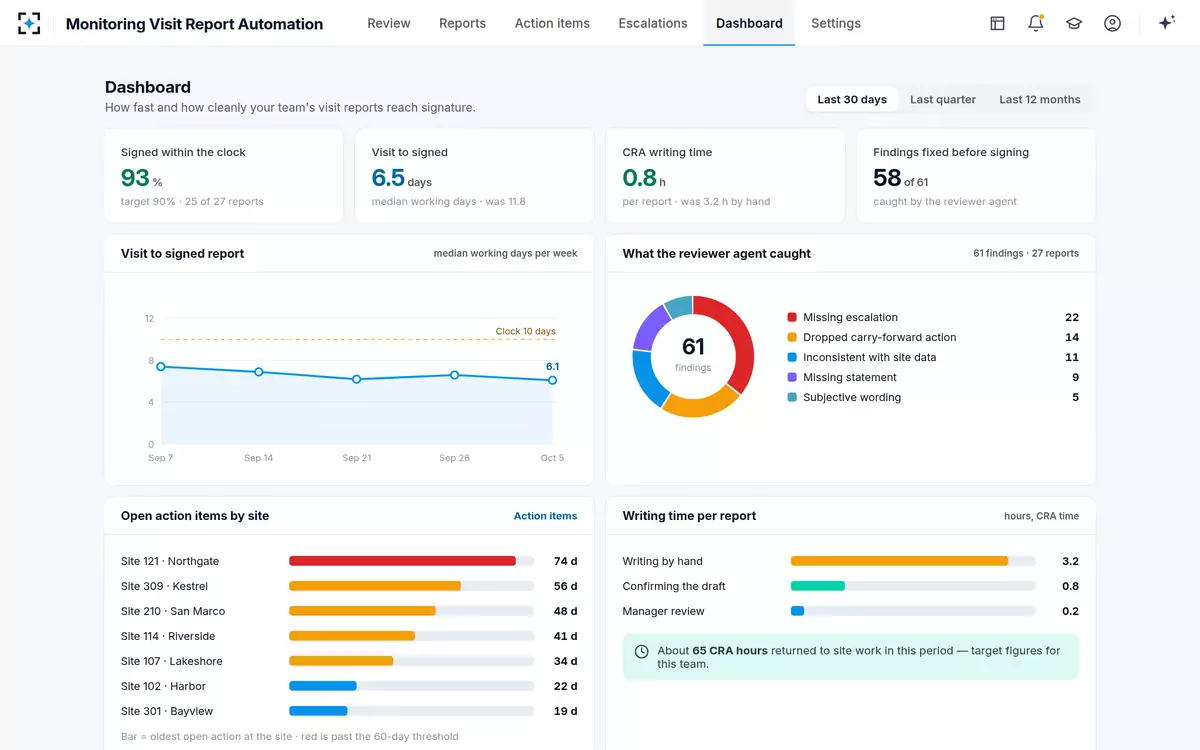
In the solution's sample study data, the work after a visit splits five ways, and the split is an estimate the product states as one. Turning dictated notes and a completed checklist into facts; pulling enrolment, concomitant medications, deviations and queries out of the trial management, data capture and randomisation systems; chasing last visit's open actions; writing the twelve sections of the sponsor's template; and the clinical trial manager's line-by-line review. By hand that is about 3.9 hours of two people's time, against the solution's design target of about 1.0.
One interim visit report, by hand and with the agents drafting
- Notes and checklist into facts0.6 h
- Enrolment, medications, deviations, queries0.5 h
- Chasing last visit’s actions0.4 h
- Writing the sections1.7 h
- Manager’s review0.7 h
- Facts, comparisons and open actions0.3 h
- Confirming the drafted sections0.5 h
- Manager’s review · 0.2 h
Against that, the solution's own description of the manual path is "two to four hours" for the CRA, off site, after the visit, against a sponsor procedure's ten-working-day clock from visit to signed report. The two statements are consistent: 3.2 CRA hours sits inside two to four. Whether either matches your own studies is an empirical question, and the five measures further down are how to settle it.
The hours start with one dictation, not a blank template
On-site against risk-based: a factor of 3.4, and the same finding rate
The strongest evidence on monitoring cost comes from a 2021 Cochrane review of eight studies comparing monitoring strategies. Its cost findings run in one direction. In the OPTIMON trial, counting both travel and monitor costs, the 100% on-site strategy cost more by "a factor of 3.4"; the review's narrower cost comparison for the same trial gives a factor of 2.7. In ADAMON, monitoring visits per participant and cumulative monitoring time were higher for on-site by a factor of 2.1 to 2.7. In a substudy of the START trial, the cost attributed to on-site monitoring was USD 2,035,392.
What extensive on-site monitoring cost, against a risk-based arm set at one
The quality side of the comparison is the part worth quoting precisely. For major or critical findings the review reported a risk ratio "close to 'no difference' (1.03 with a 95% confidence interval [CI] of 0.81 to 1.33)", and its authors summarised the evidence as risk-based monitoring not being inferior to extensive on-site monitoring. The interval is wide and eight studies is a small base, so the honest reading is that the expensive arm has not been shown to find more, rather than that it has been shown to find the same.
One study in that review is a warning about where savings go. In the MONITORING study, targeted source data verification produced a saving on monitoring costs of EUR 5,841 — and an additional data management cost of EUR 8,922 for the queries it generated. The cost moved; it did not disappear. Any claim about saved hours, including the ones on this page, has to survive that question: where did the work go instead?
What a monitoring hour costs, and why published wage data is a floor
There is no published US wage series for clinical research associates as such. The nearest occupation with official data is the natural sciences managers group, which is where the Department of Labor files clinical research coordinators; its published median is "$167,220 in May 2025", which the Department of Labor's occupational page for clinical research coordinators shows as a group median of $80.39 an hour. Treat that as a floor for three reasons: it is a median across a much broader group, it is pay rather than the employer's full cost, and a monitor supplied by a CRO reaches a sponsor as a billed rate, not a salary.
The arithmetic is still worth doing, as a lower bound you can defend. At the published hourly median, the 2.4 CRA hours the solution's targets would move per report are about $193 of labour time, before any employer cost, travel or billing margin. Across the 27 reports in the sample period that is roughly 65 CRA hours — which is what the solution's own dashboard shows for that period, as a target figure rather than a measured one.
The clocks and hours a team can actually watch, report by report
Targeting visits instead of buying more of them
If the expensive arm does not find more, the useful question is where to spend what you do have. A 2015 conference abstract from the University of Oxford's Clinical Trial Service Unit, published in Trials, reports a direct test in a large multicentre trial: central statistical monitoring scored sites, the high-scoring ones were visited, and some low-scoring sites flagged by country teams were visited as comparators. Of the twelve sites identified by central monitoring, eleven had findings; of the nine comparator sites, seven had none. Its conclusion is the clearest sentence in the cost literature: "Study costs will be reduced if resources are directed to improving the performance of sites of concern, leaving lower risk sites to receive less frequent on-site monitoring."
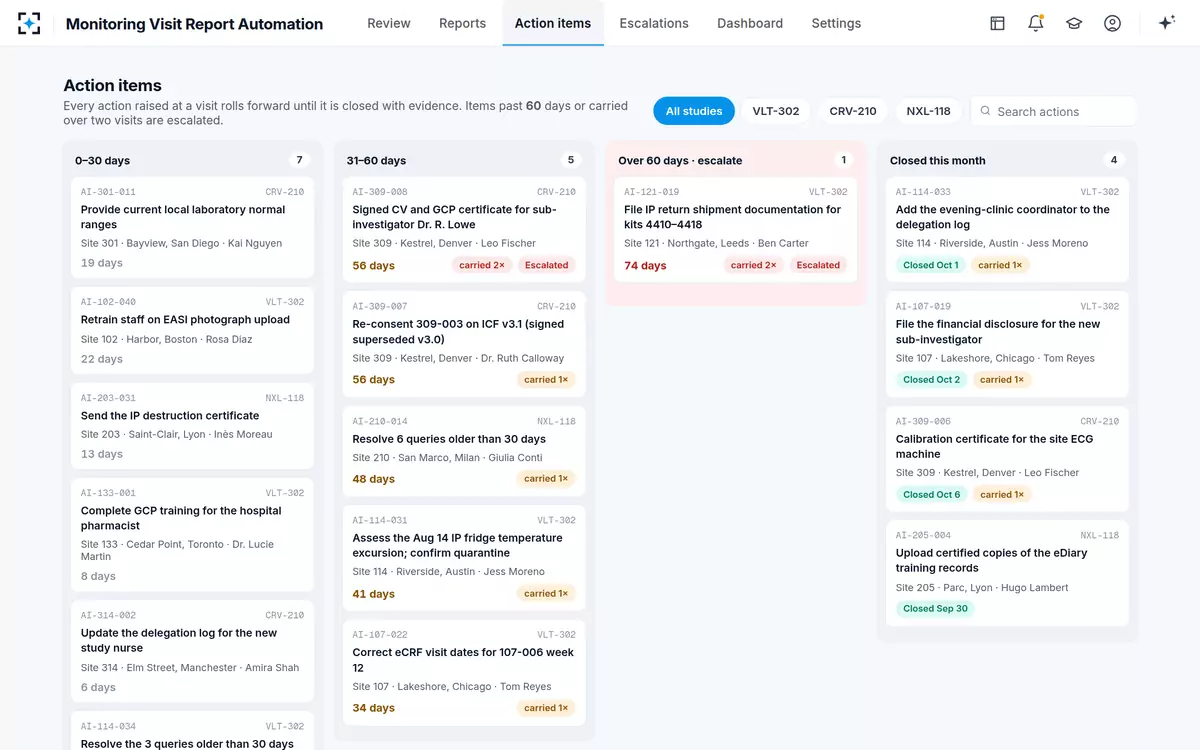
Targeting has a prerequisite that is easy to miss: it needs signals, and a sponsor's own reports are one of the cheapest it has. A site whose oldest open action is 74 days old, carried over two visits, is a site worth visiting sooner — and that is a fact already sitting in the reports, provided unresolved actions roll forward rather than quietly disappearing. Carrying last visit's open actions forward is the mechanism that keeps that signal honest.
A targeting signal that costs nothing extra: the oldest open action at each site
The five numbers worth measuring on your own study
Because the published figures do not reach the report, a sponsor that wants to know what its own reporting costs has to measure it. Five numbers are enough, and all five can be taken in a fortnight.
Five measures, how to take each one, and the trap in each
| The measure | How to take it | The trap |
|---|---|---|
| CRA hours per report | Time ten real reports end to end, from the notes arriving to submission. Not a recalled estimate. | Averaging across visit types. A close-out report and an interim report are different jobs. |
| Visit to signed, in working days | Median, not mean, per study and per monitor, from the visit date to the signature. | A mean hides the one report that took five weeks, which is the one an inspector will find. |
| Rework rate and its reasons | Share of reports sent back, categorised: missing escalation, dropped action, contradicts the data, missing statement, wording. | Counting sent-backs without categories tells you there is a problem but not whose or which. |
| Carry-forward age | Oldest open action per site, and how many visits each has been carried. | Counting open actions rather than ageing them. Ten actions a week old is a healthy site; one at 74 days is not. |
| Loaded cost of an hour | Your own fully loaded monitor and manager cost, or your CRO’s billed rate for each. | Using a published wage median. It is a floor, and it is not what the hour costs you. |
What a saved hour is actually worth, and what it is not
An hour saved on a report is worth exactly what is done with it. If the monitor makes an additional site contact, it bought monitoring. If a study runs with fewer contracted monitor days, it bought money. If neither happens it bought slack, which has value but should not appear in a business case as a saving.
The MONITORING study's pair of figures is the discipline to apply: before claiming a saving, ask what rose. For a drafting tool, the honest candidates are review time at the sponsor — a reviewer who now has comments to adjudicate — and the one-off work of mapping templates, clocks and escalation rules onto the settings. The sample data's manager-review figure moves downward rather than up, but that is a target on fictional data, and a pilot on your own signed reports is the only thing that settles it.
What the published figures measure, and what you are actually trying to cost
The published research: Source data verification, on-site visits, travel, and the data management that follows.
A report of your own: The hours between the visit ending and the signature: drafting, reconciling, chasing and reviewing.
The published research: A share of trial cost, or a ratio between two monitoring strategies.
A report of your own: Hours per report, and working days from visit to signature.
The published research: The trials in the reviewed studies, largely academic and publicly funded.
A report of your own: Your studies, your templates, your clocks and your monitors.
The published research: Estimates carried forward in the literature; the Cochrane review’s studies predate 2021.
A report of your own: This month, if you time ten reports.
The published research: Whether extensive on-site monitoring is worth its premium. Probably not, on current evidence.
A report of your own: What your reporting costs, and whether a change moved the cost or removed it.
If the next step is a supplier conversation rather than a spreadsheet, the twelve questions worth asking about monitoring software keeps it on the same evidential footing, and Monitoring Visit Report Automation can be run on a sample of your own visit notes and past reports before anything is costed.
Questions people ask
How much does clinical trial monitoring cost?
There is no published figure for monitoring as a whole. The most-cited estimate covers source data verification, at 25% to 40% of a trial's costs, with about 46% of on-site monitoring time attributed to it. Both come from a 2024 scoping review and are estimates carried forward in the literature rather than a current costing, and neither includes the hours spent writing and reviewing the report.
How much of a monitoring visit is source data verification?
About 46% of on-site monitoring time, on the estimate reported in the same review. That share has been the main target of risk-based approaches, so a sponsor using targeted verification today should expect its own figure to be lower — and should take it rather than quote the published one.
How long does it take to write a monitoring visit report?
We know of no published study that measures it, which is itself worth knowing. In the sample study data behind Monitoring Visit Report Automation the manual path is two to four hours of a CRA's time after the visit, plus the manager's review; those are the product's own estimates. Ten timed reports on your own studies will beat any published number.
Is risk-based monitoring cheaper than on-site monitoring?
On the evidence reviewed by Cochrane in 2021, yes: in one trial the on-site arm cost 3.4 times as much once travel and monitor costs were both counted, and in another it needed 2.1 to 2.7 times the visits and monitoring time. For major or critical findings the review reported a risk ratio close to no difference, 1.03 with a confidence interval of 0.81 to 1.33 — a wide interval on eight studies, so read it as the premium not being shown to buy anything.
What does a CRA cost per hour?
No official wage series covers clinical research associates specifically. The nearest published occupation, the natural sciences managers group that includes clinical research coordinators, had a median annual wage of $167,220 in May 2025, printed as $80.39 an hour in the Department of Labor's occupational data. Use it as a floor: it excludes employer costs, and a CRO-supplied monitor reaches a sponsor as a billed rate.
Does reducing source data verification save money without losing quality?
The cost side is reasonably well supported; the quality side is thinner than it looks. The 2024 scoping review found no absolute measures of verification accuracy in the literature and mixed conclusions on whether the errors found affected study results. One trial in the Cochrane review saved EUR 5,841 of monitoring cost with targeted verification and added EUR 8,922 of data management cost for the queries — a reminder that cost can move rather than fall.