A business interruption calculator in Excel works out the business income a policy owes after physical damage shuts or slows a business. For each month of the period of restoration it takes the net income the business would have earned plus the normal operating expenses that continue, subtracts the business income it actually earned, and adds the extra expense it incurred to keep going. The formula fits in one row of a spreadsheet. What decides the answer is four inputs: which past months set the baseline, how much income the business still earns while damaged, when the period of restoration ends, and which policy limits apply.
Botminds' Large Loss Claims Management runs that calculation on every large commercial loss, for the insurer's reserving rather than for payment, and keeps each input tied to the document and page it came from. This guide works the arithmetic on the solution's fictional sample loss, a frozen-food plant in Colorado whose production hall burned on 14 June 2026, then sets out what courts have said about each input and what to look for in any calculator, spreadsheet or software. The plant and its figures are invented sample data, not a customer's result.
The business interruption calculation, for each month of the period of restoration
Expected business income
Net income the business would have earned + continuing normal operating expenses
From the months before the loss, adjusted for trend. Sample: $400K a week.
Forensic accountant
Business income earned
What the damaged business still earned in the same months
Partial operations, outside production, sales from stock.
Insured’s books
Extra expense
Costs above normal to keep operating, and costs that reduce the income loss
Sample: freezer trailers and a co-packer, $46K a week.
Invoices
How is business interruption calculated?
Business interruption is calculated as the business income the insured lost during the period of restoration, where business income is defined by the policy. The standard form quoted by a federal court in Ohio defines it as "a. Net Income (Net Profit or Loss before income taxes) that would have been earned or incurred; and b. Continuing normal operating expenses incurred, including payroll." The same form tells the adjuster what to base the amount on: the business's net income before the loss, its likely net income had no loss occurred, the operating expenses needed to resume with the same quality of service, and "Other relevant sources of information", including its financial records, bills and invoices, and contracts.
Two features of that definition shape every calculator. It is built from net income, not revenue, so a spreadsheet that multiplies lost sales by a price overstates the loss by every cost the business no longer incurs. And it adds back only the expenses that continue, so payroll the business keeps paying counts, while the cost of goods it is not producing does not. Extra expense is a separate term: the forms quoted pay "All expense that exceed the normal operating expense that would have been incurred" during the period of restoration, plus necessary expenses that reduce the business income loss.
The business interruption calculation sheet, column by column
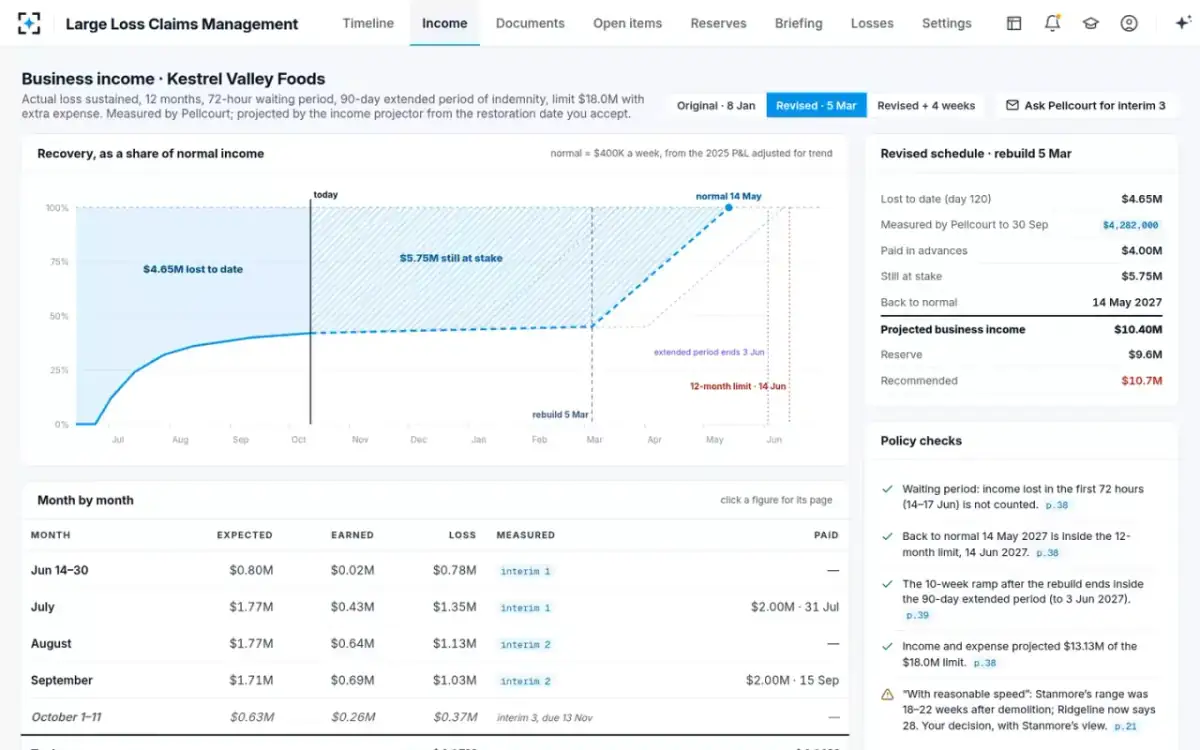
A working calculation sheet has one row per month and five columns: expected business income, business income earned, the loss, the source of each figure, and what has been paid. The sample plant's sheet on day 120, 12 October 2026, is below. Its first row is a part month, because the policy's 72-hour waiting period removes 14 to 17 June.
The sample plant's business income sheet, by month
| Month | Expected | Earned | Loss | Measured in |
|---|---|---|---|---|
| 14–30 June | $0.80M | $0.02M | $0.78M | Interim report 1 |
| July | $1.77M | $0.43M | $1.35M | Interim report 1 |
| August | $1.77M | $0.64M | $1.13M | Interim report 2 |
| September | $1.71M | $0.69M | $1.03M | Interim report 2 |
| To 30 September | $6.05M | $1.78M | $4.29M | Measured: $4,282,000 |
| 1–11 October | $0.63M | $0.26M | $0.37M | Interim 3, due 13 Nov |
The "Measured in" column is the one most spreadsheets lack, and it is the one that matters when anyone challenges the number. Each monthly figure should point to the report, general ledger entry or invoice it came from. On the sample loss the first three months are the forensic accountant's measured figures; October is a projection until her third interim report arrives.
A business interruption claim example: one frozen-food plant
The sample plant lost its 41,000-square-foot production hall and three spiral freezers. It kept some production going through an outside co-packer, which is why the "earned" column climbs from $0.02 million in late June to $0.69 million in September. By 30 September the measured loss was $4,282,000; by day 120 the solution's running figure was $4.65 million.
Forward from day 120, the calculation is a projection. On the contractor's original schedule, the rebuild would finish on 8 January 2027 and, after a ten-week ramp back to full production, the plant would be back to normal on 19 March; $3.94 million of income would still be at stake. On the revised schedule the adjuster accepted on 12 October, rebuild complete moves to 5 March and back to normal to 14 May, and the income still at stake becomes $5.75 million. Projected business income for the whole claim is $10.40 million, inside the policy's $18.0 million limit shared with extra expense.
The sample plant's business income, on day 120
$4.28M
measured lost income to 30 September
by the forensic accountant
$4.00M
paid in two advances
$5.75M
still at stake on the revised schedule
$10.40M
projected business income for the claim
Which months make the baseline for business interruption?
The months before the loss, in most policies, and courts have been firm about it. The baseline is the single most contested input after the restoration date, because a business that would have grown, or that booms after a disaster, can argue for a much higher expected income. A federal appeals court faced that argument from a Mississippi casino after Hurricane Katrina: it reopened to much higher revenue because nearby casinos stayed shut, and claimed about $80 million of business interruption loss; the insurer put it at about $6.5 million.
The court held the insurer's way, following an earlier decision that business interruption loss "will be based on historical sales figures", because "[t]he strongest and most reliable evidence of what a business would have done had the catastrophe not occurred is what it had been doing in the period just before the interruption." The standard form quoted in a later Ohio case says the same thing directly: the likely net income it uses excludes any income "that would likely have been earned as a result of an increase in the volume of business due to favorable business conditions caused by the impact of the Covered Cause of Loss on customers or on other businesses".
In practice the baseline is a choice between, and a weighting of, the trailing twelve months, the same months a year earlier, and a trend. The sample plant uses its 2025 profit and loss adjusted for trend, and the solution shows that choice as a setting the forensic accountant supplies, not one the agents make up. The way an accountant tests that choice is covered in forensic accounting in insurance claims.
Continuing expenses and a partial reopening: a $12.3 million lesson
When a business keeps operating in part, its revenue pays some of its continuing expenses, and the calculator has to give the insurer that credit. A Louisiana warehouse business after Katrina showed how much is at stake. Its evidence put its expected profit for the 15-month restoration period at $7,350,126; its actual profit was $279,006, leaving a $7,071,120 profit shortfall. The jury also awarded $12,308,522 for continuing expenses, on top.
The Fifth Circuit vacated the whole $12.3 million. Because the business had earned about $205.8 million in revenue against $205.6 million of expenses while partially reopened, "All expenses were recouped from the income of the business and are not a “loss” to be compensated under the policy." A calculator that adds continuing expenses to lost profit without netting what the business actually earned double-counts, and the error can be larger than the profit loss itself.
One Katrina claim: what the jury awarded for business income, and what survived appeal
The restoration date moves the total more than any other input
Because a business income loss accrues every week until the property should be restored, the end date multiplies everything else. On the sample loss, the contractor's eight-week slip added $1.81 million to the income still at stake, about $226,000 a week (our arithmetic). No refinement of the baseline or the expense split comes close to that, which is why a calculator that holds the restoration date as a typed-in cell, with no link to the schedule it came from, is the weakest part of most business interruption spreadsheets.
Income still at stake on the sample plant, by the schedule it is projected to
The date itself is a legal standard, not a construction fact: the property "should be" restored with reasonable speed, which is set out in when the period of restoration ends. A calculator can at least make the dependency visible, by holding the schedule document as the input and showing what each version of it does to the total.
Is extra expense part of business interruption?
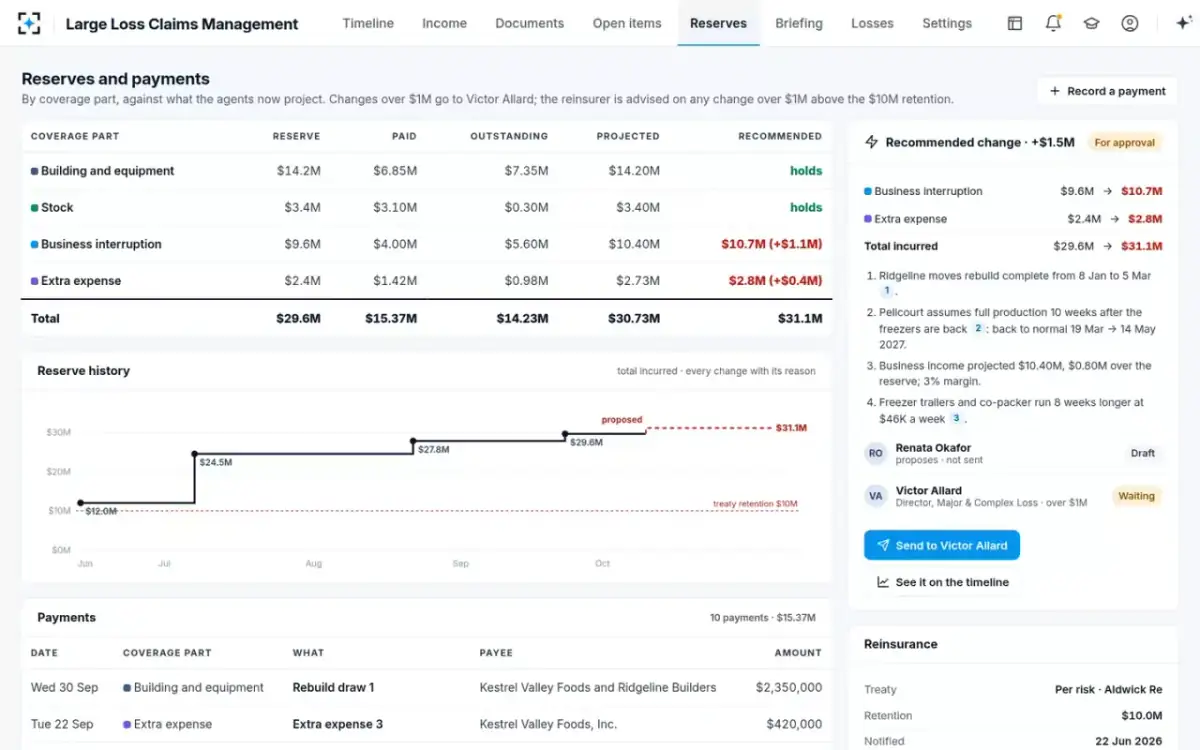
It is a separate coverage with its own definition, sold in the same standard form, the Business Income (and Extra Expense) Coverage Form, and in the sample policy under one shared limit. Extra expense pays costs above the normal operating expense during the period of restoration, starting immediately rather than after the waiting period, and it interacts with business income: money spent on a co-packer is extra expense, but the sales the co-packer makes reduce the business income loss. The sample plant's extra expense, freezer trailers and co-packing at $46,000 a week, is projected at $2.73 million against a $2.4 million reserve.
A calculator should therefore run the two together. Ending the co-packer early lowers extra expense and raises lost income; running it longer does the reverse. On the sample loss the revised schedule kept both running eight weeks longer, and the reserve adviser recommended raising extra expense to $2.8 million alongside business income to $10.7 million.
Business income and extra expense against their reserves, with the recommended change
Limits a spreadsheet forgets
A business interruption spreadsheet usually stops at the arithmetic; the policy's limits are where its answers go wrong. Four checks belong next to the total: the waiting period, which removes the first hours; any time limit in the coverage, such as the sample policy's 12 months of actual loss sustained; the extended period of indemnity, which covers the ramp after reopening only for the days bought; and the dollar limit, which in the sample policy is shared with extra expense. On the sample loss all four pass, each with the page of the policy that sets it: income lost from 14 to 17 June is excluded, back to normal on 14 May 2027 is inside the 12-month limit, the ten-week ramp ends inside the 90-day extended period, and $13.13 million projected sits inside the $18.0 million limit.
Missing a page of the policy is a real failure, not a theoretical one. In a Louisiana case, an appraisal umpire worked from a policy that showed 30 days of extended business income, when the declarations had 90; the court called his statements "inconsistent with the policy". The difference between the two periods is set out in period of indemnity vs period of restoration.
The sample plant's business income: recovery curve, months and policy checks
What to look for in a business interruption calculator
A good business interruption calculator, whether a spreadsheet template or software, shows its inputs' sources and lets someone change the restoration date and see the result; a bad one hides both. For an insurer's large loss team, the questions below separate a calculation that will survive an appraisal from one that will not.
Eight questions for any business interruption calculator
- Does every monthly figure point to its source?
An interim report, a general ledger entry, an invoice, with the page.
- Is the baseline the business’s own history, and is the choice of months stated?
Post-loss booms are excluded by the standard form; trend adjustments should be explicit.
- Does it net actual earnings against continuing expenses?
The $12.3M Katrina award was vacated for failing to.
- Is the restoration date linked to the schedule that sets it?
And can you compare schedules before accepting one?
- Does it apply the waiting period, the time limit, the extended period and the shared limit?
Each with the policy page, including the declarations.
- Does it run extra expense alongside business income?
Outside production costs money and reduces the income loss.
- Does it keep the measured loss separate from the projection?
The forensic accountant’s number and the reserving estimate answer different questions.
- Does it keep its history?
Which version of each input produced which total, and who accepted it.
Where the solution fits is specific. It is built for the insurer's large loss unit, not for a business preparing its own claim. Its income projector projects lost income from the profit and loss statements, the forensic accountant's measure and the restoration schedule, and checks the policy limits with their pages; it projects for reserving only, and never sets the period of restoration or the amount payable. It does not replace the forensic accountant, whose measured loss sits beside the projection, cited to the interim report. For a carrier, that is the honest division: a spreadsheet remains a fine tool for the accountant's own workpapers, and the solution's job is to keep the carrier's projection and reserves current as documents arrive. The whole sample loss is on the Large Loss Claims Management page.
Questions people ask
How do you calculate business income loss?
Take the net income the business would have earned plus its continuing normal operating expenses, month by month for the period of restoration, and subtract the business income it actually earned in those months. Add extra expense separately, and apply the policy's waiting period, time limit and dollar limit.
Should a business interruption calculator use revenue or net income?
US business income forms quoted by federal courts define the loss through net income plus continuing operating expenses, not revenue. A revenue-based calculation counts costs the business no longer incurs, such as raw materials for goods it is not making, and overstates the loss.
Do sales after reopening count in a business interruption claim?
Not to set the baseline under the policies courts have read: in the Katrina casino case the Fifth Circuit held that only historical figures count, not the post-storm boom. Sales during a partial reopening do count against the loss, because they are income actually earned.
What records support a business interruption calculation?
The standard form lists the business's financial records and accounting procedures, bills, invoices and other vouchers, and deeds, liens or contracts. In practice that means several years of profit and loss statements, monthly sales and payroll records, and the invoices for every extra expense.
Can an Excel calculator give the final claim amount?
It can estimate it, but the amount payable is decided on the measured loss and the agreed period of restoration, and disputes over either go to appraisal or court. On the fictional sample loss, the projection of $10.40 million is the insurer's reserving view; the forensic accountant's measure to date is $4,282,000.