Price validation is the set of daily checks a fund manager or its administrator runs on security prices before the NAV is struck: comparing each price with its previous level, with a second source and with the dealer spread, and flagging prices that are missing, stale or single-sourced, so that a person investigates the exceptions. How often a manual price validation process actually catches a wrong price is a number no regulator or independent study publishes, and few teams measure it, yet it is the only fair baseline for judging any change to the process. Botminds' Independent Price Verification is built to be measured against that baseline: run it on a past day your team already worked, compare what each caught, and keep measuring after go-live.
The sample figures on this page come from Quillfield Capital, a fictional fund complex that runs on the solution as a sample.
One past pricing day, replayed: the team's challenges and what the agents raised
What is price validation in fund valuation?
Price validation is the family of checks that test whether the prices about to be used for a fund's NAV are reasonable, before they are used. The Monetary Authority of Singapore's May 2026 paper sets out the standard types: a price variance check on each security's daily move, a source-to-source check between two price sources, missing and stale price checks, and two fund-level checks of the NAV's move against its benchmark and against the previous NAV (MAS, Valuation Practices for Fund Management Companies). Each check raises exceptions; validation is complete only when a person has investigated and resolved them.
In product pricing or e-commerce, "price validation" means checking that a list price is correct before it is published; that is a different subject. Here it means fund prices, and the measure of a validation process is not how many exceptions it raises but how many wrong prices it stops.
What did MAS find on price validation?
MAS found manual checks that existed on paper and failed in use. Most inspected managers ran at least two types of checks, with tolerances and escalation procedures. Under the heading "Insufficient rigour in price validation checks", it described a manager that followed up a gap between its own price and the administrator's and then, "instead of using an alternative price source, it used the same price source as the fund administrator to perform the check, which undermined the purpose of the follow-up". Another let a disagreeing price stand without a challenge.
The other findings fill in the picture: a uniform 5% source-to-source threshold applied to every asset type; no requirement to escalate prices that warranted a challenge; stale price reports that went monthly to funds that dealt daily; one bond priced differently across a manager's own funds; and "Poor record keeping", where managers could not evidence the checks, the investigations or how exceptions were resolved. None of these failures would show in an exception count. They show only when someone asks whether the check did its job.
The five price validation checks, what each misses, and how to measure it
| Check | What it catches | What it misses | How to measure it |
|---|---|---|---|
| Price variance (day over day) | Large sudden moves, including bad ticks and mapping slips | Stale prices, which do not move; slow drift | Share of later-confirmed errors it flagged; flags per error |
| Source to source | A vendor out of line with a second source | Anything both sources share, including the same broker passed through twice | Whether the second source is independent; catch rate by asset class |
| Missing price | Securities with no price at all | Securities with a price that should not be there | Missing prices found before the lock, against after |
| Stale price | Prices unchanged beyond the limit | Prices that move but lag the market | Days to detection against the asset class limit |
| Fund-level NAV checks | Errors large enough to move the fund | Offsetting errors; small errors in large funds | NAV corrections traced back to a day the check passed |
How accurate is manual price checking?
Nobody knows in general, because no regulator or independent study measures it and most firms do not. What can be said is where manual checks are structurally weak. They work exceptions one at a time, so on a volatile day the queue is dominated by moves the market explains; at the sample firm in September, 11,602 of 14,920 static-tolerance breaches, 78%, were explained by the market. They depend on retyped quotes, so a mapping slip can make a wrong price look supported. And they are run by people under a deadline, which pushes toward accepting rather than challenging, the pattern MAS described.
The supervisory evidence points the same way. MAS's better practices at larger managers include checks a manual team rarely has time for: monitoring bid-ask spreads to detect illiquidity, "Monitoring broker quotes for reliability by identifying variances between recent executed prices and quotes provided by brokers that exceed predefined levels", and "Establishing a “shadow” NAV process within the FMCs, performed by teams independent of portfolio management function". The question for any team is not whether its checks are good in principle but what its own numbers say.
Independent Price Verification sorts out the market's moves before anyone works them one by one
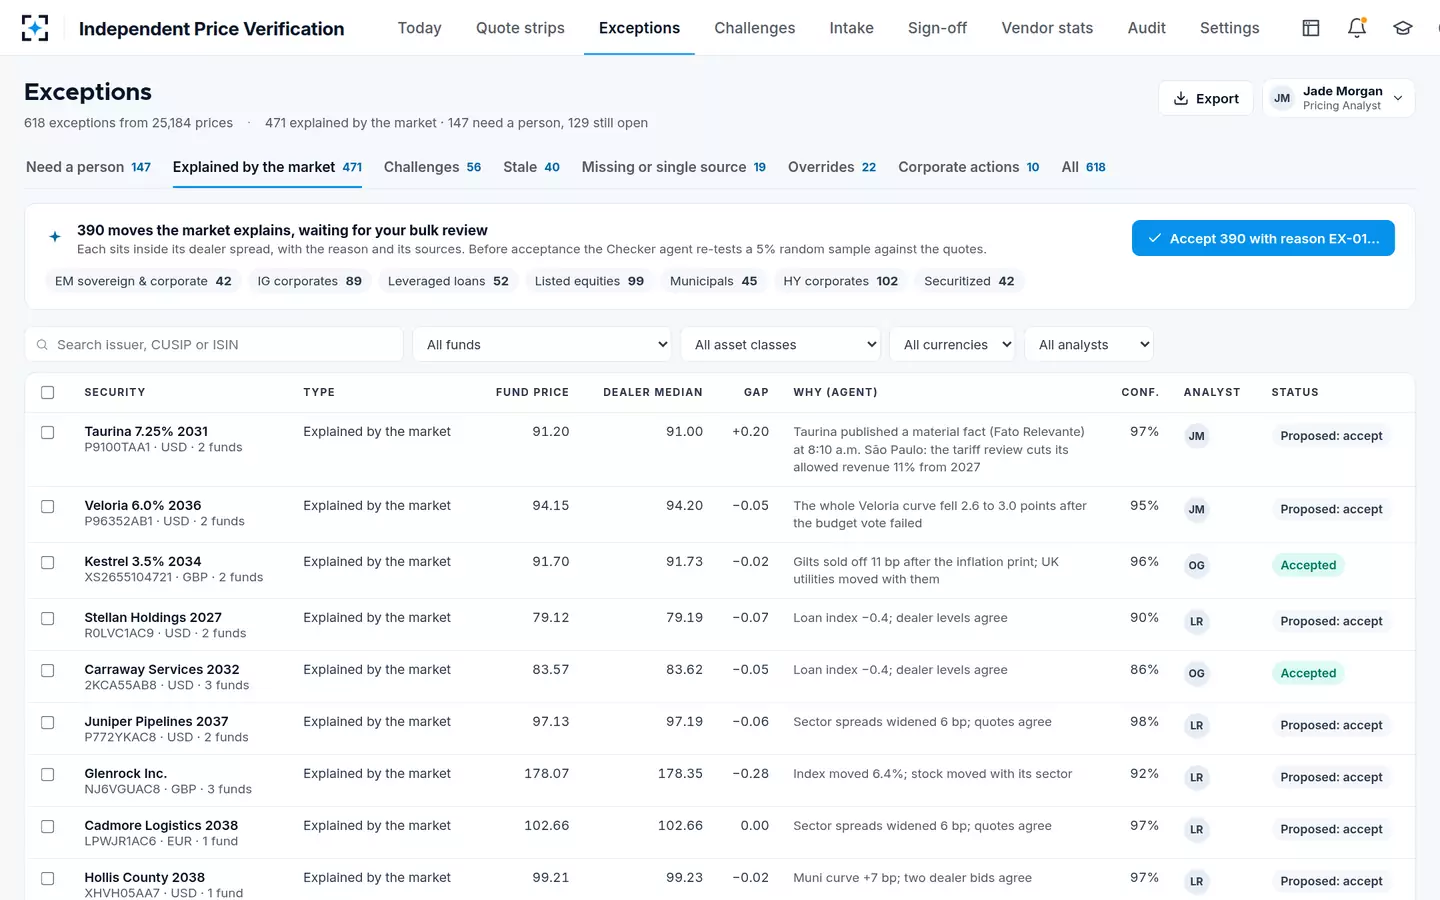
How do you measure a price check?
Measure a price check by four numbers: how many wrong prices it caught out of those later shown to be wrong, how many exceptions it raised for each real error, how long each exception took to resolve, and which way its overrides moved the price. The first needs a definition of "later shown to be wrong": a vendor revision after challenge, a later trade far from the price, or a NAV correction. The second is the cost of the check in analyst time. The third shows whether exceptions are worked before the lock. The fourth is the bias test, and it is the one most teams have never run.
Worked on the sample firm's September, the numbers look like this. Static tolerances raised 14,920 breaches; the market explained 11,602 of them; 1,184 prices were challenged and vendors revised 682. Taking a vendor revision as the definition of a confirmed error, the static check raised about 22 flags for each one, and 58% of challenges led to a revision. Of 214 overrides, 11 were returned by the second person, about one in 20. None of those numbers is good or bad on its own; each is a baseline the next month can be compared with, and a firm that has never computed them has nothing to compare a new process against.
A price check as most teams run it, and as a measured process
Unmeasured check: Number of exceptions and that they were cleared
Measured check: Errors caught, flags per error, time to resolve, direction of changes
Unmeasured check: Whatever the analyst decided
Measured check: Defined in advance: vendor revision after challenge, later trade, NAV correction
Unmeasured check: Each one approved on its own merits
Measured check: Also counted by direction, by maker and by source
Unmeasured check: Set once, reviewed when something goes wrong
Measured check: Tuned on the month's flags-per-error by asset class
Unmeasured check: Spreadsheets and emails gathered at month end
Measured check: Kept with each decision as it is made
The one-sided override test
Count every override and every challenge by the direction it moved the price, and compare with what a neutral process would produce. Errors in vendor prices should run both ways; overrides that almost always raise long positions, or lower shorts, say something about who is choosing them. The SEC's settled order against Visium Asset Management made the point with one sentence: "Of the 308 price overrides, 282, or 91.56%, resulted in higher valuations for long positions or lower valuations for short positions held by the Credit Fund" (SEC, Release 33-10494, May 8, 2018).
Direction of 308 price overrides in one SEC mismarking case
The test is cheap once overrides carry a maker, a source and a direction. Run it monthly by maker, by asset class and by source of the supporting quote, and look hardest at overrides supported by a single quote. The SEC flagged the same risk from the other side when adopting Rule 2a-5, noting that oversight of price challenges should mitigate conflicts where valuation designees might use challenges to make performance look better. The seven kinds of pricing error the test can expose are set out in pricing exceptions.
Back-testing the check against later trades
Back-testing asks whether the price the check let through was close to where the security later traded. The SEC describes the common form as "disposition analysis": comparing the fair value a technique produced with the price the fund actually got when it sold the security (SEC, 86 FR 748). Applied to a validation process, it shows whether accepted prices were systematically above or below later sales, which a daily check cannot see.
It has limits a baseline should state. Holdings that rarely trade give few data points, and the SEC itself notes back-testing is less useful for them; a sale weeks later reflects the market since, not only the original error. Back-test by asset class over months, compare accepted prices with challenged ones, and read the result as a direction, not a verdict on any single price.
How do you know a price check works? Replay a day you already decided
The fastest honest test of a new check is to run it on a past day your team has already worked and compare, decision by decision. The team's challenges, overrides and holds that day are the reference; every price the new process flags that the team did not, and every one the team flagged that the process did not, is a case to read. On the sample firm's past-day test, the agents raised every price the team had challenged, 49 of 49, and six more. The six are the interesting part: each is either a miss by the team or a false alarm by the agents, and only a person reading the evidence can say which.
A replay measures agreement with past decisions, so it inherits their blind spots. To measure catch rate on errors the team never saw, plant known-bad prices in a copy of a past day and count how many each process catches; the method, applied to NAV checks, is set out in the Fund Accounting guide to a seeded-break test for NAV validation. Use both: the replay to see where the new process disagrees with your team, the planted errors to see how either performs on errors nobody caught.
Building a price validation baseline in five weeks
- Week 1: define a wrong price
Vendor revision after challenge, later trade beyond tolerance, or NAV correction; write it down before counting.
- Week 2: pull three months of decisions
Exceptions, challenges, overrides and holds, with maker, source and direction.
- Week 3: compute the four numbers
Errors caught, flags per error, time to resolve, direction of overrides, by asset class.
- Week 4: replay one past day and plant known errors in a copy
Compare the team's decisions with the new process, case by case.
- Week 5: set targets and keep measuring
Monthly, by vendor and asset class, in the same report the valuation committee reads.
What a baseline report looks like
A baseline report is one page a month: exceptions raised and how many the market explained, challenges sent and how many vendors revised, overrides by direction and maker, time to resolve, and anything held at the lock, each by vendor and asset class. The SEC's adopting release says a recurring pattern of challenges or overrides can itself be a material matter for the board, and a monthly report is how a pattern becomes visible before an examiner finds it.
A month of challenges in Independent Price Verification, by vendor and asset class, report drafted
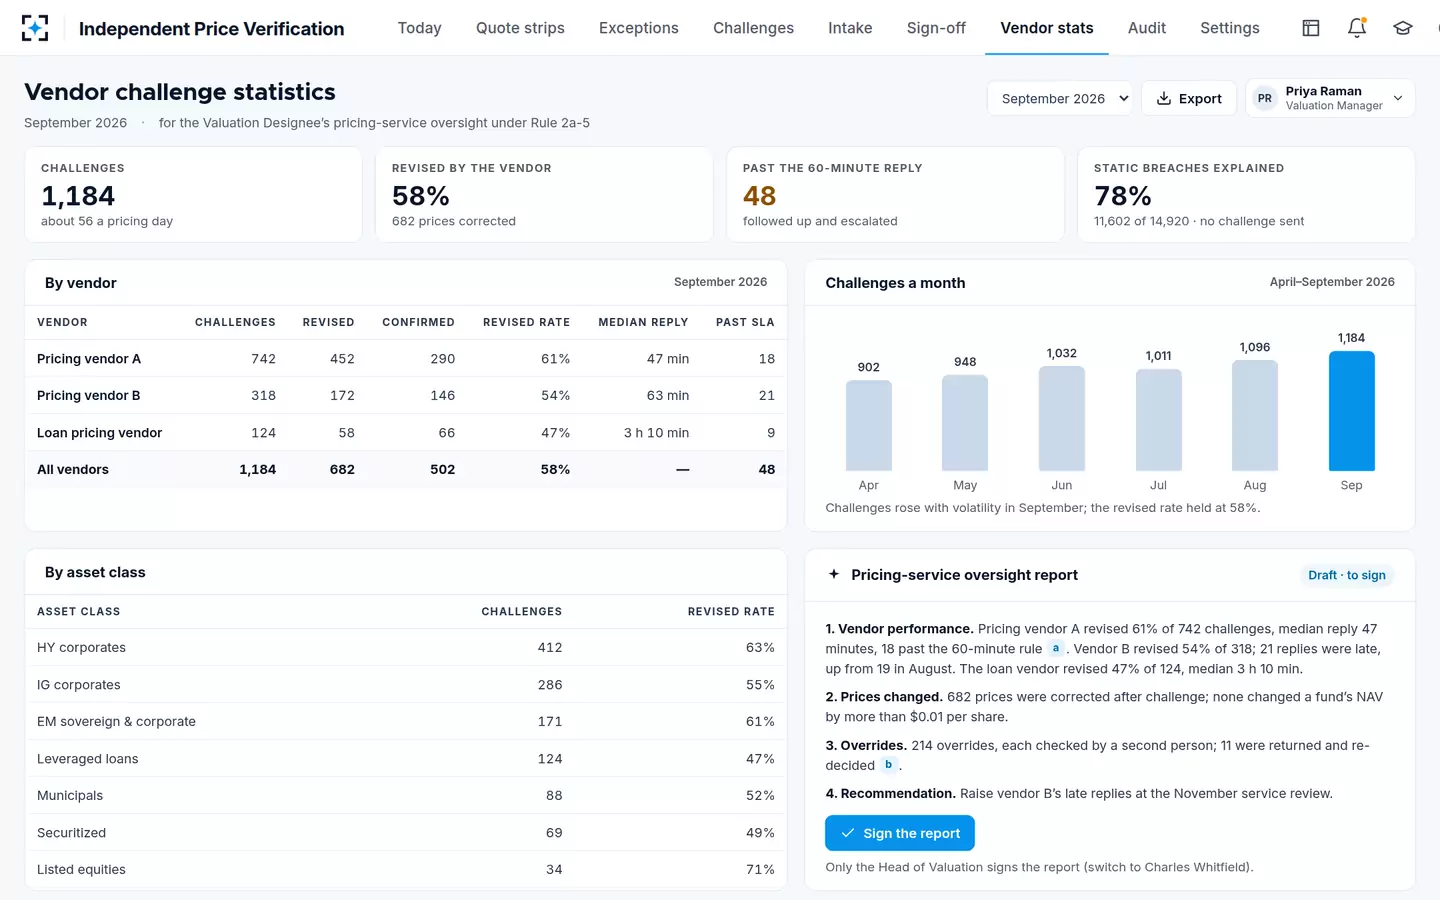
With the solution the report is a by-product: every exception, challenge, override and check is captured as it happens, so the month's numbers are counted rather than reconstructed. That also makes it possible to keep comparing the process with its own baseline after go-live, which is the only way to know whether a change helped. How the daily process produces that evidence is in the independent price verification process.
Questions people ask
What is a price validation check?
It is one test applied to every price before the NAV, such as a day-over-day move limit, a comparison with a second source, or a check for missing, stale or single-source prices. MAS found most managers it inspected ran at least two types, and expects tolerances set by asset class with clear escalation.
How many false alarms should a price check raise?
No standard exists, and the right number depends on asset class and volatility. Measure flags per confirmed error each month and tune tolerances by asset class; dynamic bands that widen with the market reduce false alarms on volatile days without hiding real errors.
Who should check the price checkers?
A second person on every changed price, the valuation committee monthly, and an independent reviewer of the whole process periodically. Hong Kong's SFC code requires an annual review of the valuation process, including testing it, by a competent and functionally independent party.
Can a price check be biased?
Yes, through who chooses the overrides and challenges rather than through the check itself. Counting overrides and challenges by direction is the simplest test; in the Visium case the SEC found 91.56% of 308 overrides moved prices in the fund's favour.
Is a fund administrator's price validation enough?
It is a control, not a substitute for oversight. MAS found managers that relied on administrators' checks without noticing stale prices for weeks or the same bond priced differently across funds, and it expects managers to use independent alternative sources to investigate exceptions.