Claims audit vendors are outside firms that review a carrier's claim files or vendor bills, usually after payment and usually on a sample, and report the errors they find. For an independent adjuster programme the real choice is between three ways of checking outside work: buy a vendor's sample review, staff a sample review in-house, or review every bill and report as it arrives. A sample, from anyone, can show that errors exist; it cannot score six firms fairly, see a pattern that runs across one adjuster's day, or produce the measures a programme is managed on, such as reductions upheld, reports returned and days to a first report. Botminds' Independent Adjuster Bill Review is built for the third option: every bill and report checked the day it lands, with the carrier's people deciding. It does not supply reinspectors or field visits, which is where a vendor still earns its fee.
The sampling evidence below comes from the GAO's reviews of the federal flood program; the fee anchors from FEMA. The six firms, their bills and their scores are fictional sample data from the solution's sample storm, and the sampling arithmetic on them is ours.
The KPI tree for an IA programme: every measure needs every bill
Cost accuracy
Dollars not allowed
not allowed ÷ billed, by firm and by guideline section
Needsevery bill line
Reductions upheld
1 − restored ÷ reduced, after the firm has answered
Needsevery reduction and every restore
Report quality
Reports returned
reports with at least one gap ÷ reports received
Needsevery report check
Guideline items met
items met ÷ items tested
Needsevery report, every item
Timeliness
Days to first report
first report date − the start of the guideline clock, averaged by firm
Needsreport dates and check-ins
Days a bill waits
decision date − received date
Needsthe bill queue
Conduct
Time flags per 100 bills
bills where billed field time exceeds documented time beyond tolerance
Needsphoto times, check-ins, the adjuster’s day
Referrals
patterns sent to vendor management, and what came of them
Needsreferral log
What claims audit vendors sell, and what a sample can tell you
Most claims audit vendors sell some mix of four services: post-payment review of closed files, pre-payment review of bills, quality reviews of adjusters' reports, and field re-inspections by their own reinspectors. Their value is independence and specialist staff, and for re-inspections, people on the ground. Their unit is the sample: a few files per firm, per adjuster or per month, chosen at random or by risk.
A random sample answers one question well: roughly what share of bills carry an error. A risk-based sample, chosen by size or complexity, answers a narrower one: whether the risky bills carry errors. Neither answers how each firm performed, and only the first can be projected to the whole. The federal flood program learned this the hard way. The GAO found in 2005 that FEMA's reinspections were chosen by judgment, so that "Without a statistically valid sampling methodology, the agency cannot project the results of these monitoring and oversight activities to determine the overall accuracy of claims settled for specific flood events or assess the overall performance of insurance companies and their adjusters in fulfilling their responsibilities for the NFIP."
The phrase that matters for an IA programme is the last one: the overall performance of companies and their adjusters. A programme that pays six firms in a storm needs exactly that, firm by firm, and a sample is too thin to give it.
Why a sample cannot score a firm
The problem is arithmetic. Firms differ in size, and the findings that matter most are rare, so a sample large enough to find them in a big firm finds almost nothing in a small one. Take the sample storm: six firms sent 3,906 bills, and 68 carried a time flag, billed field time beyond the adjuster's own documented time by more than the tolerance. A 10% random sample of each firm's bills would expect to see fewer than seven of those flags in total.
What a 10% random sample would have seen of one sample storm's 68 time flags
| Firm | Bills | Time flags | Bills sampled | Flags expected in the sample | Chance the sample shows none |
|---|---|---|---|---|---|
| Gulfstar Claims Services | 1,140 | 41 | 114 | 4.1 | 1% |
| Redfern Catastrophe Group | 918 | 12 | 92 | 1.2 | 28% |
| Sabal Point Claims | 410 | 9 | 41 | 0.9 | 38% |
| Pelican Bay Adjusting | 702 | 3 | 70 | 0.3 | 73% |
| Ironwood CAT Partners | 250 | 2 | 25 | 0.2 | 81% |
| Tidewater Field Adjusters | 486 | 1 | 49 | 0.1 | 90% |
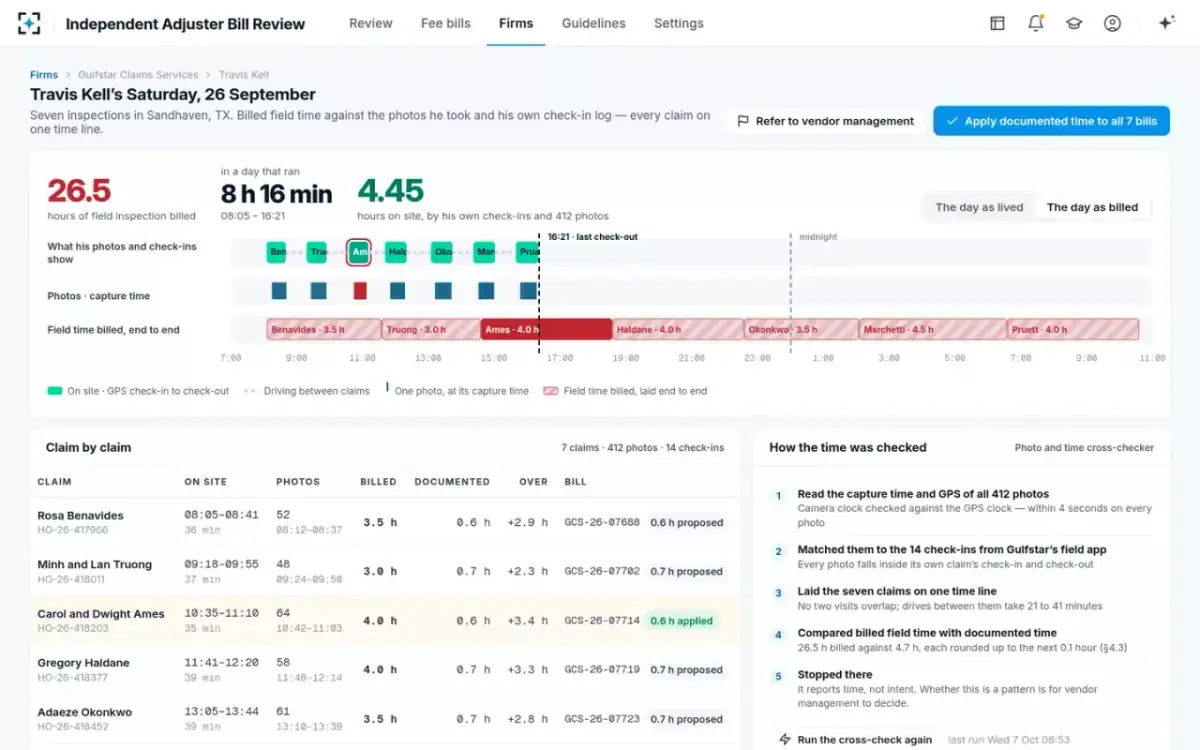
Three of the six firms would more likely than not show a clean sample, and the ranking between them would be noise. The pattern problem is worse. One adjuster billed 26.5 hours of field time across seven bills on one Saturday. A 10% random sample of his firm's 1,140 bills has about a 52% chance of including any one of those seven bills and about a 15% chance of including two, which is the least it takes to notice that the day did not add up.
The pattern a sample rarely sees: one adjuster's day, as billed
Sampling is not wrong; it is the right tool for estimating an error rate, and the federal program has moved toward random selection for exactly that reason. It is the wrong tool for scoring firms, adjusting next season's panel and answering a firm that asks why its score fell.
The KPIs for an IA programme, and the data each needs
An IA programme has four outcomes to manage: what the carrier pays for, what it gets in the reports, how fast the work moves, and how the firms behave. The tree above gives two measures for each. Every one is a ratio over all bills or all reports, which is why each needs full review: a reductions-upheld rate computed on a sample tells you about the sample.
Eight IA programme KPIs with their formulas and the sample storm's values
| KPI | Formula | Sample storm, all six firms |
|---|---|---|
| Dollars not allowed | not allowed ÷ billed | $0.99M of $9.84M, 10.1% |
| Reductions upheld | 1 − restored ÷ reduced | Tracked per line restored, with its reason |
| Reports returned | reports with a gap ÷ reports | 7% (Tidewater) to 22% (Gulfstar) |
| Guideline items met | items met ÷ items tested | 9 of 12 on the Ames report |
| Days to first report | first report date − the start of the guideline clock | Gulfstar: 6.4 days on average |
| Days a bill waits | decision − receipt | Oldest waiting bill: 9 days |
| Time flags per 100 bills | flagged bills ÷ bills × 100 | 1.7 across the storm; 3.6 at Gulfstar |
| Firm score | weighted: items 40%, lines 30%, clocks 20%, flags 10% | Gulfstar: 71, down from 78 in week 1 |
Two of the eight deserve a note. Reductions upheld is the one most programmes do not track and the one that tests the review itself: a high rate of lines restored after the firm answers means the review is cutting what the evidence does not support. And days to first report is the one that links bill review to the claim: a firm whose reports arrive late is billing for work the examiner could not use in time.
How much do insurers spend on independent adjusters?
There is no public national figure. Carriers' fee schedules and IA spend are private contracts, and the federal flood program is the only place where adjuster pay is published in full. Its schedule pays from $680 on a small claim to 4.5% of a $100,000 gross loss and 2.8% above $1 million, with $510 for a claim closed without payment, as set out in the NFIP adjuster fee schedule.
What public sources do show is how fast adjusting costs move with a catastrophe. Separately from adjuster fees, FEMA pays its insurers an allowance for processing claims, and the GAO found that after Katrina "the amount FEMA paid WYO insurance companies for claims processing expenses based on this formula increased more than tenfold from about $30 million in fiscal year 2004 to about $385 million in fiscal year 2005". Adjusting spend scales with claim volume, and so does the volume of bills to check.
One sample storm's IA spend, four weeks after landfall
$9.84M
billed by six outside firms on 3,906 fee bills
10.1%
of billed dollars not allowed, each line with its section
217
outside adjusters scored from every bill and report
438
bills still waiting, the oldest for 9 days
Sampling vs full review of adjuster bills, side by side
The choice is not either-or. Most programmes that move to full review keep an outside vendor for some work; the question is which work each does best.
A vendor's sample review next to full review of every bill
Vendor or in-house sample: A share of bills, often after payment
Full review with Independent Adjuster Bill Review: Every bill and report, before payment
Vendor or in-house sample: Errors in the bills it reads
Full review with Independent Adjuster Bill Review: Errors on every bill, and patterns across an adjuster’s day or a firm’s season
Vendor or in-house sample: Rest on a few files per firm
Full review with Independent Adjuster Bill Review: Rest on every bill and report, week by week
Vendor or in-house sample: Findings after payment mean recoveries
Full review with Independent Adjuster Bill Review: Findings before payment mean reductions, with the firm’s answer in the same note
Vendor or in-house sample: The reviewer’s workpapers
Full review with Independent Adjuster Bill Review: The section, photo, check-in and claim note on each line
Vendor or in-house sample: Reinspectors can visit the property
Full review with Independent Adjuster Bill Review: None: it reads what the firm submitted
Vendor or in-house sample: A third party, useful for attestations
Full review with Independent Adjuster Bill Review: The carrier’s own review, with agents and people kept apart
Scoring six firms from every bill with Independent Adjuster Bill Review
With every bill read, the firm comparison stops being a debate about samples. In the sample storm the share of billed dollars not allowed ran from 4.1% at the best firm to 14.8% at the worst, a gap a vendor's sample of a few dozen bills per firm would struggle to rank reliably.
Share of billed dollars not allowed, by firm, in one sample storm
Independent Adjuster Bill Review: six firms and 217 adjusters scored from every bill
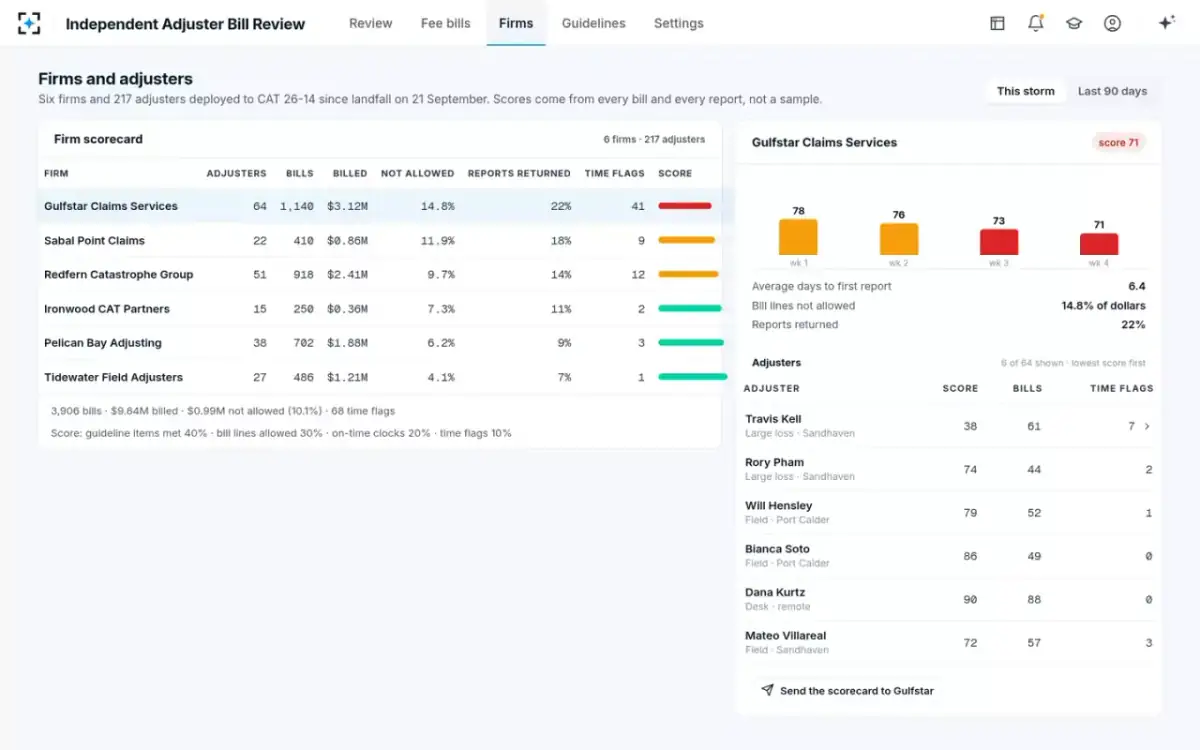
The scores are for the carrier's vendor manager, not for the agents to act on. In the solution the firm scorer rolls every bill and report into weekly firm and adjuster scores and never removes a firm or adjuster from the panel; that decision stays with vendor management.
Where full review does not replace a vendor
Full desk review covers the bill and the report; it does not cover the building. A carrier still needs people for four things the solution does not do. Field re-inspections, when the photographs raise questions about scope or cause. Independent attestation, when a reinsurer, auditor or regulator wants a third party's opinion of the programme. Specialist review of engineering, forensic accounting or large-loss estimates. And staffing: the solution supplies no adjusters and no reviewers.
A sensible split is to let full review handle every bill and report, and to buy a vendor's random sample to test the review itself, the way the federal program's random quality checks test its insurers. If the vendor's sample finds what the full review missed, the guidelines or the tolerances need to change. Regulators expect that kind of testing of any automated review: the NAIC's model bulletin on AI lists comparison with expert reviewers among the ways an insurer can validate a system after it goes live.
Questions to ask a claims audit vendor
Eight questions for any claims audit vendor, and what a good answer sounds like
- How are files selected?
Good: random within each firm, with the sample size stated. Red flag: “risk-based” with no way to project.
- Can you score each firm, and with what margin of error?
Good: a number with its margin. Red flag: a ranking from a handful of files.
- Do you review before payment or after?
After means recoveries and firm disputes months later.
- Does every finding cite a guideline section and the evidence?
If not, the firm will dispute it and the carrier will lose.
- Do you check billed hours against the file?
Photo times, check-ins and the adjuster’s whole day, not just the rate.
- Who signs a reduction?
It should be the carrier, never the vendor alone.
- How do firms answer a finding?
One channel, one note per bill, and a restore path when they show evidence.
- What do you need from us, and what do you keep?
Guidelines by edition, claim notes, photos with metadata; and who owns the findings data.
A vendor that answers the first two well is selling an error-rate estimate, which is useful. One that claims to score firms from a sample is selling more than the arithmetic supports. The questions to put to software, as opposed to a service, are in fifteen questions for claims auditing tools, and the whole review on one storm is on Independent Adjuster Bill Review.
Questions people ask
What is a claims audit platform?
Software that holds the guidelines, reads bills and files, applies the checks and keeps the findings, so reviewers work from one place rather than from spreadsheets. The useful test is whether it reviews every bill before payment with evidence on each finding, or only organises a sample after payment.
What does a claims quality assurance specialist do?
Reviews claim files and adjusters' work against standards and reports gaps, usually on a sample, and feeds training. On an IA programme the role shifts from finding errors to answering firms and tuning guidelines once every bill is checked, because the errors are already listed.
What KPIs measure independent adjuster quality?
Report guideline items met, reports returned, days to first report, dollars not allowed, reductions upheld after the firm answers, and time flags per 100 bills, rolled into a firm score. Each is a ratio over all bills or reports, so each needs full review to be trusted at the firm level.
Is a 10% sample of IA bills enough?
Enough to estimate an error rate if it is random; not enough to rank firms or see patterns. In one sample storm, a 10% random sample would have had a 90% chance of showing the best firm's one time flag as none, and about a 15% chance of catching two bills from the same adjuster's impossible day.
How do you calculate the ROI of bill review?
Dollars not allowed and upheld, plus the cost of report gaps caught before payment, less the cost of the review. Count only reductions that survive the firm's answer; a review that cuts lines it later restores costs time on both sides and earns nothing.