A hail history report by address lists the dates on which hail was reported or estimated near a location, with a size for each. Most draw on two public sources: ground reports collected by the National Weather Service and published in NOAA's Storm Events Database, and radar estimates of the largest hail, computed on a grid about a kilometre square. Neither measures hail on a particular roof. The radar product was designed so that most observed hail is smaller than it says, and ground reports cluster where people live and at the coin sizes they compare hail to. That makes a report good evidence that a roof should be looked at, and poor evidence that it was or was not damaged. Botminds' Contractor Fraud Detection reads it as the first and never the last word.
Four homes, one swath: what a radar hail estimate can and cannot say
How do I get a hail history report for my address? Three free federal sources
You can build a basic hail history for an address from three free NOAA sources, or buy a commercial report that packages them. The Storm Prediction Center itself sends people elsewhere: asked for "hail or wind damage for the last 20 years in a certain place", it answers that it cannot, and that NOAA's National Centers for Environmental Information publish local severe weather events "in a publication called Storm Data or interactively through the Storm Events Database" (SPC FAQ).
The Storm Events Database lists reported hail by state, county and date, with a size, a time and a narrative, and NCEI publishes the full files for download (bulk files). The Severe Weather Data Inventory brings together severe weather records from several NCEI sources and offers them by area and time, including in GIS formats. The Storm Prediction Center's daily storm reports show the preliminary reports for each day. None of them is indexed by street address; you search by county or draw an area, then judge distance yourself.
Where address hail reports come from, and what each can tell you
| Source | What it is | Strength | Weakness |
|---|---|---|---|
| Storm Events Database (Storm Data) | Hail reports entered by NWS offices from spotters, the public and damage surveys | Official, with time, place and narrative; free and downloadable | Sizes mostly estimated by comparison with coins and balls; gaps where nobody reports |
| SPC storm reports | Preliminary local storm reports, by day | Quick to appear | Preliminary; the filtered version keeps only the largest hail within 10 miles and 15 minutes |
| Radar estimate of maximum hail size | Size computed from radar reflectivity on a grid of about 1 km | Covers every place, day and night | Designed to over-forecast: 75% of observed hail falls below it |
What is radar-estimated hail size? A maximum, built to err high
Radar-estimated hail size, in the maximum estimated size of hail product most address reports use, is a calculation from how strongly a storm reflects radar energy above the freezing level, converted into the largest hail the storm is likely producing. Its designers chose to err on the high side. NOAA Storm Prediction Center scientists describe it plainly: "the algorithm was designed to be an overforecast such that 75% of all observed hail will fall below the radar estimate" (Wendt and Jirak, 2019). It is also more accurate "when multiple radars are sampling a storm", and in their study the threshold with the most skill against ground reports was 29 mm, about 1.14 inches, not 1 inch.
So a radar value of 1.25 inches at an address means the storm may have produced hail that large nearby. It does not mean stones that size hit that roof, and a value of 0.88 does not mean they did not.
Are hail reports by address accurate? Each source is wrong in a known direction
They are useful but biased, and the biases run in opposite directions. Radar estimates run high by design. Ground reports run low, because hail is only reported where someone sees it and says so. Comparing the two across the country, the SPC scientists found radar-based severe hail hours "5–6 times as great" as report-based ones even where population is relatively dense, and higher still where it is sparse; they conclude that "The true risk for severe hail likely resides in between" (Wendt and Jirak). Reports are also less likely in the evening, when many hailstorms fall.
Ground-report sizes have a second problem: most are comparisons, not measurements. The National Weather Service asks spotters to measure where safe, offers a table converting objects to diameters, and warns that "The comparisons may not be accurate, but may be used for estimates" (NWSI 10-1605). Our count of 2023–2025 entries shows the effect: 40% are exactly 1.00 inch, the quarter on that table.
Reported hail clusters at coin and ball sizes: 40% are exactly one inch
Ground reports and radar estimates, side by side
Ground reports (Storm Events): Where someone saw hail and reported it.
Radar estimate of maximum hail: Everywhere the radar sees, on a grid of about 1 km.
Ground reports (Storm Events): Low: missed storms, missed evenings, missed rural areas.
Radar estimate of maximum hail: High: built so most observed hail is smaller.
Ground reports (Storm Events): Mostly an object comparison, rounded to coin and ball sizes.
Radar estimate of maximum hail: A calculated maximum for the storm near that cell.
Ground reports (Storm Events): The reporter’s time, sometimes estimated.
Radar estimate of maximum hail: The radar scan time.
Ground reports (Storm Events): Confirms hail fell in the area that day.
Radar estimate of maximum hail: Ranks addresses by how likely large hail was; picks roofs to inspect first.
What size hail damages a roof? No map can say for a given roof
No public source gives one size at which a roof is damaged, and a hail report cannot answer it for a particular roof. The weather service's own threshold is about storms, not roofs: severe hail is "1 inch diameter" or larger, though Storm Data enters every report of 3/4 inch and up (NWSI 10-1605). Even within one storm, "Most hailstorms are made up of a mix of different sizes" (NOAA National Severe Storms Laboratory), and how a roof fares also depends on its age, material and slope, which only an inspection sees.
That is why the hail threshold in Contractor Fraud Detection is a setting with a narrow job. At its default of 1.00 inch, a roof replacement at an address whose radar estimate is lower is re-inspected first; the insurer can set it to 0.75 or 1.25 inches. The storm footprint checker reports the hail at the address and time, and its rule is that it never says whether a roof was damaged.
How far from the storm can hail damage occur? Further than a line on a map
Hail can fall outside the swath a report draws, because swaths are estimates and storms move. NOAA's severe storms laboratory describes hail swaths ranging "from a few acres to an area 10 miles wide and 100 miles long" (NSSL), and the radar estimate behind most maps is a grid of roughly one-kilometre cells. A home a mile outside the drawn edge can have real hail damage.
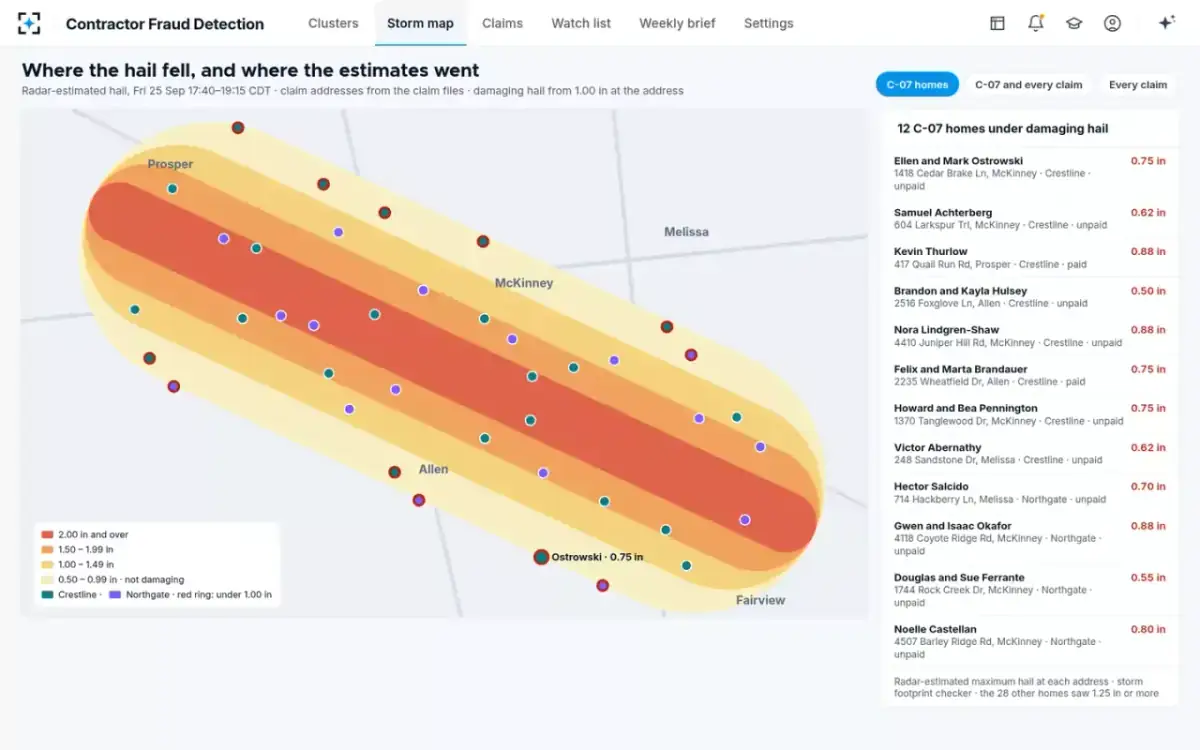
So the solution draws a buffer around the swath, two miles by default and adjustable to one or five, and reads every claim inside it. Claims beyond the buffer are read too. In the fictional sample storm the solution runs on, the morning run tied 214 new claims to the storm, six of them outside the footprint, and read all six.
Contractor Fraud Detection's storm map: 12 of 40 homes under 1.00 inch, all 40 still read
Does insurance use hail maps? As triage and evidence, alongside the inspection
Insurers use hail data to tie claims to a storm, decide which roofs to inspect first and spot claims from places the storm did not reach. Regulators already expect weather to be part of the fraud picture after disasters: California's fraud referral form, for example, carries a "Disaster claim indicator" (10 CCR §2698.38). In Contractor Fraud Detection the hail at each address is one column beside the measured and billed squares, so a cluster of copied estimates on homes under the setting stands out. In the sample storm, 12 of the 40 homes in the largest cluster had radar estimates under an inch, from 0.50 to 0.88.
Can a claim be denied because radar shows no hail?
A radar map alone is weak ground for a denial, because of the biases above; the decision has to rest on the policy and the damage found. Florida lets insurers investigate with photographs, video and drones, but adds that using electronic methods "does not prohibit an insurer from assigning a licensed adjuster to physically inspect the property" (Fla. Stat. §627.70131(3)(d)). Texas requires a rejection to "state the reasons for the rejection" (Tex. Ins. Code §542.056(c)), and a reason that rests on one map will not hold up well. Where the hail data and the estimate disagree, the right next step is a re-inspection with a written reason, as described in hail damage insurance fraud: a payment hold that survives review. How denials and closures are explained to policyholders more generally is covered in the claim closed without payment guide.
Reading a hail history report on a claim
- Which source is each line from?
A ground report, a preliminary report or a radar estimate; they mean different things.
- Is the size measured, estimated or calculated?
Most ground sizes are object comparisons; radar sizes are calculated maximums.
- How far is the address from the report or the swath edge?
Within a kilometre is within one radar cell; within a few miles is within a swath’s drift.
- Does the date match the claimed loss?
A report from an earlier storm points to prior damage, not to this one.
- What does the roof show?
Test squares, photographs and the roof’s age decide; the map decides which roof to look at first.
How Contractor Fraud Detection uses the hail at each address
The solution treats the hail figure as one column of evidence, never as the decision. Its storm footprint checker ties each new property claim to the catastrophe event, its date of loss and the radar-estimated hail at the address, with the buffer around the swath. The figure then sits beside the evidence that actually raises a cluster: the estimate's wording and quantities compared with every other estimate in the storm, and the roof measured against the squares billed. Hail alone never raises a cluster; a copied estimate does.
Where the two meet, the hail figure changes the order of work, not the outcome. In the sample cluster, unpaid claims on homes under the 1.00 inch setting were marked "hold, re-inspect, hail under 1.00 in", other unpaid claims "hold, re-inspect, copied estimate", and claims already paid went to recovery review. The SIU manager signed one hold for all 31 unpaid claims, the letters to the insureds said the claim was not denied, and the re-inspections decided each roof. The same column also works the other way: a contractor whose estimates fit each roof and whose homes all sit under heavy hail is a contractor doing storm work, and the solution's job is to stay out of its way. The full check list for a storm contractor is in contractor verification software.
Questions people ask
Is there a free hail history report by address?
Not by street address from NOAA, but the data is free: the Storm Events Database by county and date, the Severe Weather Data Inventory by area, and the SPC's daily storm reports. Commercial reports add address matching and radar maps for a fee.
Why does my hail report show hail but my roof is fine?
Because the radar estimate is designed so that 75% of observed hail is smaller than it says, and because a storm drops a mix of sizes. A report shows what the storm could have done nearby; the roof shows what it did.
What does quarter-size hail mean?
One inch in diameter, the size the weather service treats as severe. NWS guidance notes that a quarter is 15/16 of an inch and that many reported sizes are estimates by comparison, which is why so many entries read exactly 1.00 inch.
Are NOAA hail reports by address available for Texas?
Yes, by county and date in the Storm Events Database. Texas had more hail entries than any other state in each year from 2023 to 2025, by our count of NOAA's files: 1,912, 1,588 and 1,453.
Do hail maps show the time the hail fell?
Ground reports carry the reporter's time, sometimes estimated; radar estimates carry the scan time. In the sample storm map, radar-estimated hail fell between 17:40 and 19:15 local time, which an adjuster can set against the loss date and time on the claim.