FMCSA's out-of-service rates are the share of roadside inspections that end with a vehicle or a driver ordered off the road until a serious violation is fixed. Nationally, in 2023, 22.6% of vehicle inspections and 6.4% of driver inspections ended that way, and 4.0% of hazardous-materials inspections. For a commercial auto underwriter they matter because they are public: since the FAST Act, FMCSA no longer shows the public the safety percentiles of carriers that haul property, but every carrier's inspections and out-of-service results remain visible. Read against the national rates, with the size of the sample in mind, they are an honest signal. Botminds' Commercial Auto Fleet Underwriting is an agentic solution that reads a carrier's public inspection and crash record by USDOT number and ties a roadside violation to a driver on the roster only when the inspection report names that driver.
The national figures are FMCSA's; the account-level example is a fictional sample renewal as it runs through the solution, Harlan Creek Building Supply Co. of Fort Worth, a property carrier with 38 power units and 61 roadside inspections in 24 months.
Out-of-service rates are higher than in 2019: 22.6% of vehicle inspections and 6.4% of driver inspections in 2023
What is the national out of service rate?
The national out-of-service rate in 2023 was 22.6% for vehicle inspections, 6.4% for driver inspections and 4.0% for hazardous-materials inspections, according to FMCSA's 2024 Pocket Guide to Large Truck and Bus Statistics (FMCSA Pocket Guide). The vehicle rate was 20.6% in 2019 and has not fallen since; the driver rate rose from 5.1% to a peak of 6.9% in 2022.
Two things about the published rates are easy to miss. They mix trucks and buses, and they cover inspections by Federal and State inspectors together; states conduct about 95% of inspections. And each rate has its own denominator: driver rates are computed over driver inspections, vehicle rates over vehicle inspections, which are different sets of inspections, as the next sections explain.
One year of roadside inspections, nationally
1,994,946
vehicle inspections in 2023
678,529
vehicle out-of-service violations found in them
2,909,709
driver inspections in 2023
222,041
driver out-of-service violations found in them
What does out of service mean in an inspection?
Out of service means an inspector found a violation serious enough that the driver or the vehicle may not continue until it is corrected. FMCSA's definition: "Serious violations result in the issuance of vehicle or driver out-of-service (OOS) orders. These violations must be corrected before the affected driver or vehicle can return to service" (FMCSA Pocket Guide).
A vehicle out-of-service order is about the vehicle's condition, such as its brakes, tyres or lights. A driver out-of-service order is about the driver, such as hours of service, a licence or medical certificate, or driving while disqualified. For an underwriter the distinction maps onto two different questions. A high vehicle rate says something about maintenance; a high driver rate says something about who the carrier lets drive, which is the question its driver files and motor vehicle records answer, as the driver qualification file checklist sets out.
How an out-of-service rate is computed, and the denominator trap
An out-of-service rate is the number of inspections of a given type that found at least one out-of-service violation, divided by the number of inspections of that type. The type matters because roadside inspections come in levels, and not every level inspects both the driver and the vehicle.
Which inspection levels count toward which out-of-service rate
| Rate | Inspection levels counted | What is left out |
|---|---|---|
| Driver out-of-service rate | Levels I, II, III and VI | Level V, terminal inspections |
| Vehicle out-of-service rate | Levels I, II, V and VI | Level III, driver-only inspections |
| Hazardous-materials out-of-service rate | Levels I to VI, when hazardous materials were present | Inspections with no hazardous materials on board |
The trap is dividing by all inspections. Take a fleet with 61 inspections in two years, 20 of them driver-only Level III inspections. If nine vehicle inspections found an out-of-service violation, the vehicle rate is 9 of 41, or 22.0%, almost exactly the national figure. Divide the same nine by all 61 and the fleet appears to run at 14.8%, a third better than the nation. The numbers in this paragraph are illustrative, but the arithmetic is the reason to check the denominator of any rate a summary or a vendor reports.
What is a good vehicle out of service rate?
FMCSA does not publish a "good" rate; the fair benchmark is the national average for the same kind of inspection, read with the number of inspections in mind. A carrier well below 22.6% on many vehicle inspections is doing better than most; a carrier above it on a handful of inspections may simply be unlucky. The table shows how far chance alone can move a rate.
A carrier that is exactly average can still show almost any rate on a few inspections
| Vehicle inspections in 24 months | Range of rates for a carrier at exactly 22.6% | Chance of a clean record by luck |
|---|---|---|
| 5 inspections | 0% to 60% | 27.8% |
| 10 inspections | 0% to 50% | 7.7% |
| 20 inspections | 10% to 40% | 0.6% |
| 40 inspections | 12.5% to 35% | Below 0.1% |
| 100 inspections | 16% to 30% | Below 0.1% |
The practical reading follows from the table. Under about 20 vehicle inspections, a rate tells an underwriter little either way; a clean record on five inspections happens to an average carrier more than a quarter of the time. Above 40, a rate well above the national average is unlikely to be luck. In between, the useful question is not the rate but the violations: what was found, on which units, and whether it repeats.
Can insurers see CSA scores?
For carriers that haul property, insurers cannot see the CSA percentiles on FMCSA's public website; they can see the inspections, out-of-service results and crashes behind them. FMCSA's methodology states it plainly: "Property carriers must log in to view their complete SMS results" (SMS methodology). An insurer that wants a property carrier's percentiles has to ask the carrier to share its own logged-in view.
What anyone can see about a property carrier, and what only the carrier can
Public view of a property carrier: Yes, over the past 24 months
The carrier’s own logged-in view: Yes
Public view of a property carrier: Yes
The carrier’s own logged-in view: Yes
Public view of a property carrier: Inspection and crash data are public
The carrier’s own logged-in view: Yes
Public view of a property carrier: No, removed under the FAST Act
The carrier’s own logged-in view: Yes
Public view of a property carrier: Not publicly available
The carrier’s own logged-in view: Yes
Why are CSA percentiles hidden for property carriers?
Because Congress required it. Section 5223 of the Fixing America's Surface Transportation Act of 2015 led FMCSA to take the percentiles and alerts for property carriers off public display.
"As required by Section 5223 of the FAST Act, FMCSA has removed alerts and relative percentiles for property carriers from the public display of the SMS."
FMCSA, FAST Act changes to the CSA program
FMCSA restated the position in its November 2024 notice on enhancements to the Safety Measurement System: "Passenger carrier percentiles and alerts remain publicly available, as well as inspection, investigation, crash, and registration data for all carriers" (89 FR 91874). That notice announced changes to how the system groups violations and measures carriers; an underwriter should check FMCSA's site for when any change takes effect before relying on it. What has not changed is the public availability of the inspection record itself.
The thresholds still exist; they are simply not public for property carriers. FMCSA prioritises carriers for intervention when a category percentile reaches its threshold, and the thresholds are lowest for the categories its analysis links most closely to crashes.
FMCSA's intervention thresholds, by category and carrier type
| Category | Passenger carrier | Hazardous materials | General |
|---|---|---|---|
| Unsafe Driving, Crash Indicator, Hours-of-Service Compliance | 50% | 60% | 65% |
| Vehicle Maintenance, Controlled Substances/Alcohol, Driver Fitness | 65% | 75% | 80% |
| Hazardous Materials Compliance | 80% | 80% | 80% |
How do you look up a carrier's inspections?
You look up a carrier's inspections by its USDOT number on FMCSA's public Safety Measurement System website, which FMCSA says provides "safety performance data, which is updated monthly" (89 FR 91874). It shows roadside inspections, violations and out-of-service results over a rolling window of the past 24 months, and "Safety events older than 24 months are no longer used" (SMS methodology).
The window shapes what an underwriter sees. The methodology weights recent events more heavily: violations in the past six months count three times, those six to twelve months old twice, and older ones once. A carrier that had a bad year two years ago and a clean one since will look better on the system than on a straight count, and that is by design. When reading inspections for underwriting, read the dates, not only the totals.
Roadside violations that name a driver
A roadside inspection report often names the driver, and when it does, the violation can be tied to a person on the roster. That is where the public record becomes most useful to an underwriter: a speeding or phone violation at the roadside that names a driver who is already failing the guidelines on their motor vehicle record is two independent sources pointing at the same person.
The same roadside stop, on the driver's record
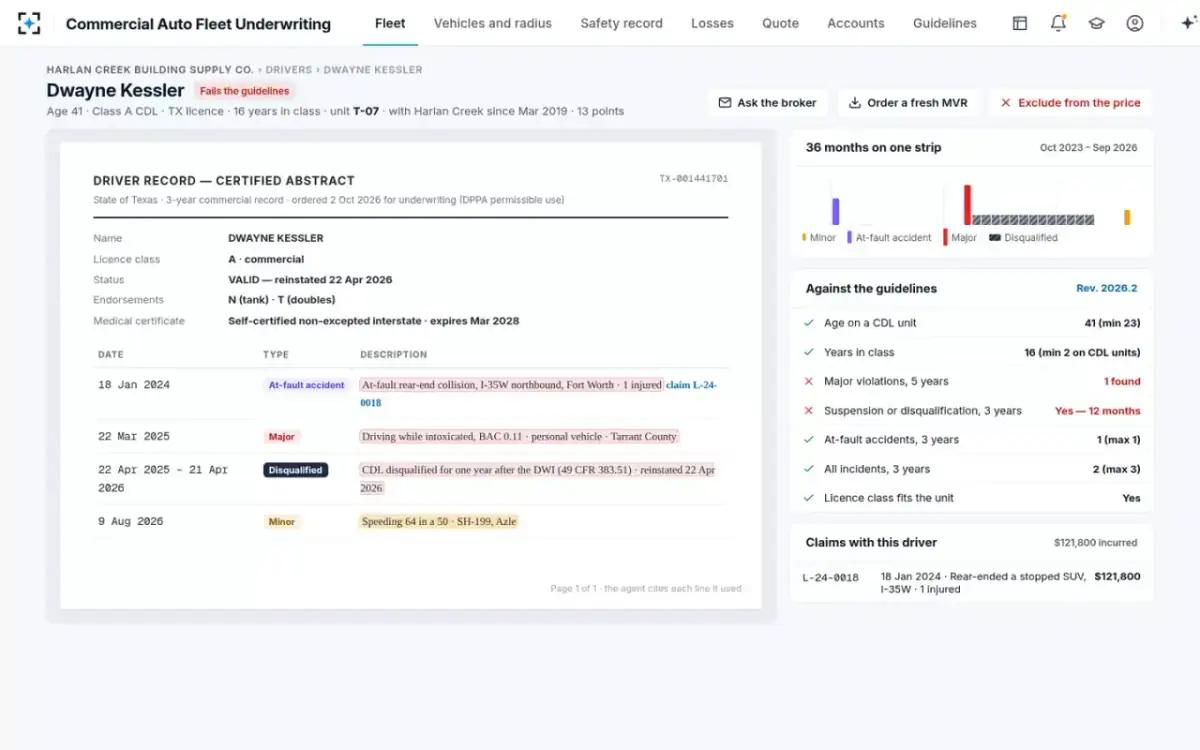
On the sample account the carrier's public record shows 61 roadside inspections and four reportable crashes in 24 months. Three of the roadside violations name drivers who are already in the red band on their records: Dwayne Kessler for speeding, Tyler Brandt for reckless driving and Marcus Odom for a hand-held phone. All three are serious traffic violations under federal rules once they happen in a commercial vehicle, speeding only from 15 mph over the limit, and a second serious violation of any of those kinds within three years disqualifies a commercial licence holder for 60 days (49 CFR 383.51, Table 2). The safety record reader ties a violation to a driver only when the report names the driver; an unnamed violation stays with the carrier.
Do out of service violations affect insurance?
They can, through the underwriter's judgement rather than a published rule: FMCSA does not price insurance, but an insurer's guidelines can treat a carrier's inspection history as evidence about maintenance and driver control. FMCSA's own analysis gives a reason to weight driving behaviour most: in its words, "the Unsafe Driving, Crash Indicator, and HOS Compliance BASICs have the strongest associations to crash risk."
The roster where roadside violations meet the record
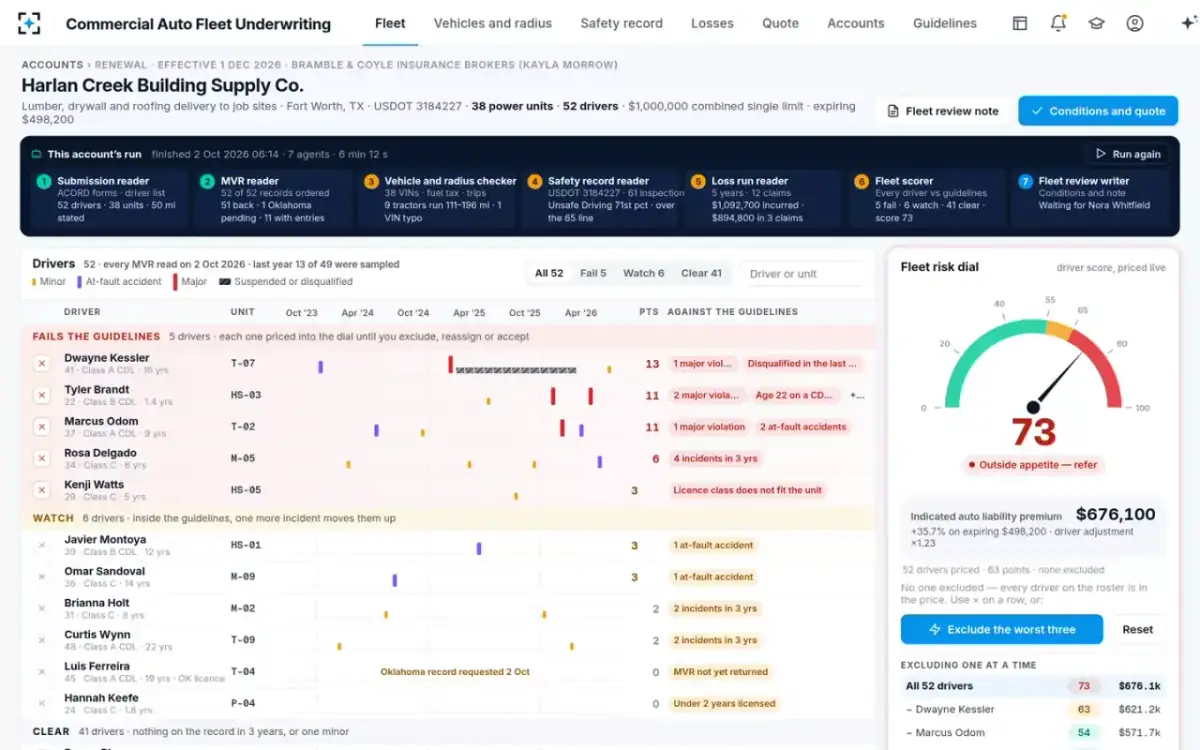
Used carefully, the inspection record does three things for an underwriter. It confirms or contradicts the motor vehicle records, as on the sample account. It shows where units actually travel, since each inspection has a place and a date, which can support a radius of operation check. And it gives a benchmark, the national rates, that a property carrier's hidden percentiles no longer provide. Used carelessly, a rate on a handful of inspections, or one divided by the wrong count, says more about arithmetic than about the carrier.
How Commercial Auto Fleet Underwriting reads the public safety record
Commercial Auto Fleet Underwriting reads the carrier's public record by USDOT number, the inspections, out-of-service orders and crashes, and sets it beside the roster: a roadside violation is linked to a driver only when the inspection report names that driver, and the solution reads public data only. The underwriter decides what the record means for the account, and the guide on how to run an MVR on drivers covers the records it is read against.
Questions people ask
What is the vehicle out of service rate for 2023?
22.6% nationally, the same as in 2022: 450,477 of 1,994,946 vehicle inspections ended with an out-of-service violation, according to FMCSA's 2024 Pocket Guide. The rate covers trucks and buses and Federal and State inspections together.
What is the driver out of service rate?
6.4% nationally in 2023: 185,640 of 2,909,709 driver inspections found at least one driver out-of-service violation. It was 5.1% in 2019 and 6.9% in 2022.
How many inspections does a carrier need before its rate means anything?
There is no official minimum for reading a rate, but the arithmetic is unforgiving: a carrier that is exactly average on 10 vehicle inspections can show anywhere from 0% to 50% in nine cases out of ten. From about 40 inspections the range narrows to roughly 12% to 35%.
How long do inspections stay on a carrier's record?
FMCSA's safety measurement system uses inspections and crashes from the past 24 months, weighting the most recent six months three times as heavily as the oldest year. Older events no longer count toward the carrier's measures.
Can a carrier share its CSA percentiles with an insurer?
Yes. A property carrier can log in to view its complete results and can share them; the public view no longer shows them. An underwriter who relies on shared percentiles should keep a dated copy in the file, because they change monthly.