A charge-off recovery rate is the share of charged-off balance that comes back, and the reason it causes so many arguments is that the numerator and the denominator can each be defined four different ways. Gross or net of fees? Measured against the balance placed or the balance charged off? Over what window, and counted from the charge-off date or the placement date? Two agencies working equally well can show recovery rates several points apart because they were given different paper, and a lender that moves accounts on the raw number is rewarding luck. Botminds’ Collection Agency Management measures liquidation on like-for-like placements by vintage, so an agency is never graded against a different mix of accounts, and every figure on the scorecard opens onto the accounts behind it.
The worked figures are a fictional sample lender — Bellmere Bank, 38,420 charged-off accounts and $96.3 million across six invented agencies — as the solution shows them. The regulatory definitions are real and linked.
What is a charge-off recovery, and how a bank reports it
A charge-off is an accounting decision: the lender writes the balance off as a loss and removes it from its performing book. It does not cancel the debt, and it does not stop collection. A recovery is money subsequently received on an account that has already been charged off — collected in-house, by an outside agency, by a law firm, or arriving unprompted from a borrower whose circumstances changed.
The supervisory definition is worth quoting because it fixes the relationship between the two.
Charge-off rates for any category of loan are defined as the flow of a bank’s net charge-offs (gross charge-offs minus recoveries) during a quarter divided by the average level of its loans outstanding over that quarter.
Board of Governors of the Federal Reserve System, Charge-Off and Delinquency Rates on Loans and Leases at Commercial Banks
Two things follow. Recoveries are reported net against charge-offs, so a strong recovery operation shows up in the bank’s published net charge-off rate rather than as a line of its own. And because charge-offs are reported on the Call Report’s schedule RI-B and average loan levels on schedule RC-K, the public figures describe a book, not an agency. There is no public series that tells a lender what a good agency recovery rate is. That number has to be built from its own portfolio.
What does liquidation rate mean in collections?
Liquidation rate is the recoveries practitioner’s working term for the same idea, applied to a placement rather than to a book: the share of a placed balance that an agency turns into money within a stated window. It is called liquidation because the cohort is being worked down — the question is how much of this specific pile of paper has been converted, by this specific agency, in this specific time.
Three details separate a usable liquidation rate from a number that cannot be compared with anything.
Net, not gross. Measure what reached the lender after the contingency fee, or you will rank a 22% agency above an 18% one for collecting the same money. A cohort, not a calendar. Divide by the balance of the accounts placed in a given month, not by the balance placed this month, because today’s receipts come from placements made over the last year. A stated window. A cohort’s liquidation keeps rising as long as the accounts are out, so “11.2%” means nothing until it is “11.2% at six months”.
How do you calculate an agency’s liquidation rate?
Net liquidation on one placement cohort, term by term
Placed balance
The balance of the accounts in the cohort on the day they were placed
Fixed at placement. It does not move when an account is recalled or when interest is added.
The placement file
Gross collected
Payments received on those accounts within the window
Taken from the lender’s own posted payments, including anything the borrower paid directly.
The lender’s payment records
Fees and costs
Contingency fee at the contracted rate, plus allowed pass-through costs
Rate by placement stage and payment type, on the date each payment arrived.
The contract and its amendments
Net liquidation
(Gross collected − fees − costs) ÷ placed balance, at n months
Always written with the window: the same cohort is a different number at 3, 6 and 12 months.
The recovery strategy analyst
Two mistakes are common enough to name. The first is dividing by the balance still outstanding rather than by the balance placed, which flatters an agency that has already returned its hard accounts — the denominator shrinks as the easy money is collected. The second is counting payments the borrower made directly to the lender during placement in one agency’s numerator but not another’s; whether those count is a contract question, and the answer has to be the same for every agency in the comparison.
Vintage: the month that decides the number
A placement vintage is the month a cohort of accounts was placed. It is one of the strongest influences on the number, because the chance that a charged-off balance is ever collected tends to fall with time since the last contact, and because each vintage carries the economy of its own origination window with it.
Regulation F happens to name a reference point many recoveries teams use. Its validation rules let a collector itemize a debt from any of five reference dates, and one of them is simply the date the debt was charged off (12 CFR 1006.34(b)(3)). Months since charge-off is the cleanest axis to cut a panel on, because it is a date every agency sees identically, it can serve as the itemization date on the validation notice, and it does not depend on anyone’s system of record.
The practical rule is that a liquidation figure must always carry two dates: the vintage it is measured on, and the age of the measurement. Comparing an agency’s April cohort at six months with another’s July cohort at three months is not a comparison at all, and it is an easy way for a panel ranking to go wrong.
Why two agencies’ recovery rates do not compare
Even inside one month’s placement, two agencies can be handed materially different work. Balance bands differ: a pool of $400 balances behaves nothing like a pool of $6,000 balances, and the fee economics differ too. States differ, and with them the statute of limitations, the licensing position and the local propensity to pay. Contact data differs — accounts with a good mobile number and an email are a different population from accounts that need skip-tracing. Prior placement stage differs. And the share of accounts already in dispute, bankruptcy or hardship differs.
Six agencies on one pool: net liquidation against the pool’s own 9.8%
Read that chart the wrong way and it says Ostrander is half the agency Alder Ridge is. Read it the right way — net, same window, same placement months, like-for-like cohorts — and it supports a decision. The difference between those two readings is a set of controls on how the cohorts were built, not a cleverer statistic.
What makes two placements incomparable, and what to hold constant instead
| The difference | Why it moves the rate | What a like-for-like comparison holds constant |
|---|---|---|
| Months since charge-off | Collectability tends to fall as the last contact recedes, whatever the agency does. | Compare within the same placement vintage, and state the age of the measurement. |
| Balance band | Small balances settle faster and cost nearly as much to work; large ones take arrangements and time. | Band the pool and compare band by band, or stratify every placement identically. |
| State | Limitation periods, licensing and local payment behaviour all differ by state. | Match the state mix across agencies, or report by state group. |
| Contact data | A good mobile number is worth more than any collection technique. | Score contactability at placement and distribute it evenly. |
| Prior placement stage | Secondary and tertiary paper has already resisted one agency. | Never rank a primary cohort against a secondary one. |
| Dispute, hardship and bankruptcy share | Accounts that cannot be worked still sit in the denominator. | Exclude them consistently, or report the excluded share beside the rate. |
The like-for-like test, in five checks
A ranking is publishable when it survives five questions. None of them requires a model; all of them require the placement data to have been kept.
Five checks to run before any agency ranking is published
- Same vintage, same age
Every agency measured on the same placement months, at the same number of months since placement. If one agency joined in June, it has no comparable April cohort — say so rather than ranking it.
- Same stratification
Balance bands, states and months since charge-off distributed the same way across agencies. If placements were stratified at the point of allocation, this check is a readback; if they were not, it is a reconstruction.
- Net of fees, on one definition
The same treatment of contingency fees, pass-through costs, direct payments and post-recall payments for every agency in the table.
- Same exclusions
Bankruptcy, deceased, disputed and hardship accounts handled identically, with the excluded share reported next to the rate.
- Volume large enough to mean something
A 1,640-account cohort moves on a handful of large settlements. Show the account count beside every rate, and treat a small panel member as an estimate rather than a result.
There is a governance reason to run these checks as well as an analytical one. The banking agencies warn that performance measures themselves carry risk: their guidance advises negotiating measures that do not reward imprudent behaviour, such as chasing volume or speed with no regard for accuracy, compliance, or harm to the bank or its customers (Interagency Guidance on Third-Party Relationships, June 2023). A panel ranked on liquidation alone is exactly such a measure. It is why the sample bank weights liquidation at 40 out of 100 and gives the other 60 to complaints, call compliance and remittance accuracy — and why an agency below the conduct threshold receives no new accounts whatever its recovery rate. The standards the other 60 points are measured against are set out in collection agency compliance standards.
The same six numbers, read two ways
The headline recovery rate: How much did this agency collect, as a share of what it holds?
The like-for-like reading: How much did this agency collect, compared with what another agency would have collected on the same accounts?
The headline recovery rate: The mix of accounts the agency was given, as much as its work.
The like-for-like reading: The work, once mix is held constant.
The headline recovery rate: Often a calendar month or a year to date.
The like-for-like reading: A placement cohort at a stated age — three, six or twelve months.
The headline recovery rate: Frequently gross, because that is what the agency reports.
The like-for-like reading: Net, because that is what reaches the lender.
The headline recovery rate: Watch it for a change in trend at one agency.
The like-for-like reading: Rank agencies, and move next month’s placements.
The headline recovery rate: Rewards whoever was handed the best paper.
The like-for-like reading: Needs the placement data to have been kept and the cohorts to be large enough.
What a recall costs in recoveries, before anyone pulls the inventory
Recovery measurement earns its keep at the moment a lender is deciding whether to pull accounts back from an agency. The instinct after a conduct finding is to recall everything. The arithmetic usually says otherwise, and it should be on the table before the decision rather than after it.
In the sample week, one agency had five critical call findings raised and its call compliance grade fell to a provisional 74. It also held 8,730 accounts and $22.1 million, liquidating at 11.2% against the pool’s 9.8%. The solution’s estimate was that a full recall would give up about $410,000 of expected recoveries on the accounts already in work, and it would have restarted 8,730 consumers with a new collector, which is itself a consumer-experience cost, not a saving.
What the bank did instead separates the two decisions that are usually confused. New business stopped: the agency was held at zero percent of November’s placement while its call compliance sat below the threshold, moving 972 accounts and $2.48 million to the other five agencies. Existing paper stayed, except the five accounts actually touched by findings, which were recalled under the contract’s five-business-day notice. Remediation was dated: the script line restored, the team retrained, every one of its calls given a second review for 30 days, with evidence due on a named Friday.
That is the shape of a defensible answer, and it only exists because the recovery estimate and the conduct evidence sit in the same place. How the fee side of the same decision works — what a recall does to the fee tail, and which payments remain commissionable — is in how much a collection agency charges.
One agency profile: thirteen weeks of grades, the contract, and the price of a recall
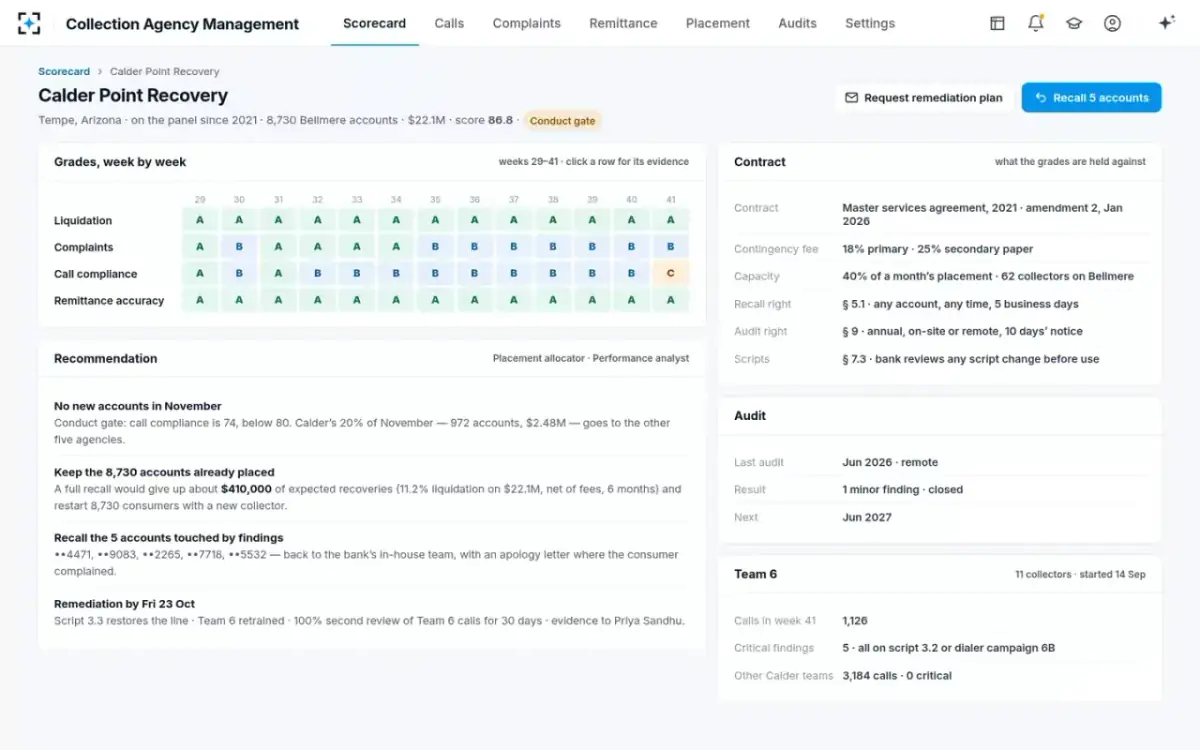
Reading a thirteen-week ribbon without being fooled by it
A grade history is more informative than a grade, and more dangerous. Thirteen weeks of letters invites pattern-finding, and much of what a reader will see in it is noise: complaint counts per thousand accounts move on two or three complaints, and a small agency’s liquidation moves on one large settlement.
Three habits make a ribbon honest. Read the measures separately, because a composite score can hold a falling conduct grade still while liquidation rises. Treat a provisional finding as provisional — on the sample panel a critical call finding counts against an agency only once a person has confirmed it from the call itself, though it holds back new placements in the meantime. And look for the first week a measure changed rather than the current level, because the cause is often there: a script version issued in late September, a new team starting on a date, a dialler campaign switched on.
The sample panel shows all three at once. One agency’s liquidation is the second-best on the panel and its call compliance the worst; its remittance accuracy is 99.9% while another agency’s is 96.4% because of a single stale fee rate. A ranking on any one of those four columns would move accounts for a different reason, which is why the four are weighted and why every letter opens onto the evidence that produced it.
Four measures, six agencies, and the grade that changed this week
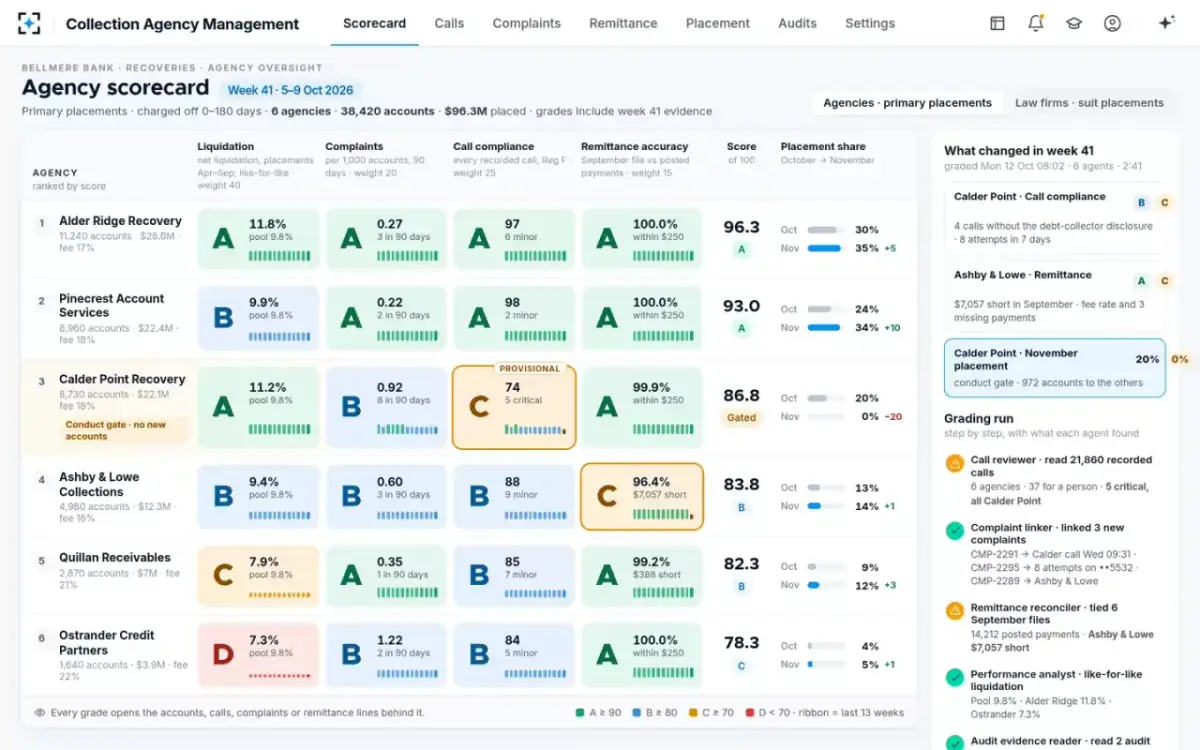
A recovery rate is only as good as the question it answers. Measured on the same paper it is the most useful number a recoveries desk has; measured on whatever each agency happened to be given, it is a way of rewarding the luckiest. To see liquidation measured by vintage on like-for-like placements, start from Collection Agency Management, or read what changes the day an account is placed.
Questions people ask
What is a good recovery rate on charged-off debt?
There is no regulator or research benchmark; the figures that circulate come from vendor and trade surveys. Public bank data reports recoveries netted against charge-offs for a whole book, not by agency or by vintage, so the only honest comparison is internal: this agency against the pool’s own rate on the same vintage, balance bands and states. On the fictional sample panel the pool liquidates at 9.8% and the agencies run from 7.3% to 11.8% on comparable cohorts — a spread that is meaningful precisely because the cohorts were matched.
How long does it take an agency to liquidate a placement?
Collections on a cohort tend to come early, and the curve flattens for the rest of the placement period; that is why liquidation is quoted at a stated age and why primary placements are usually worked for a fixed number of months before the accounts are recalled and placed again. The practical consequence is that a six-month figure and a twelve-month figure are different measurements, not a trend, and that judging a new agency at three months tells you about its contact rate rather than its collection rate.
Why do two agencies’ recovery rates not compare?
Because the rate describes the accounts as much as the agency. Different vintages, balance bands, states, contact data, placement stages and dispute shares can move a liquidation rate by more than many differences in collection skill. Before ranking, hold those constant — or report the raw numbers with their mix differences stated beside them, and say plainly that they are not a ranking.
How do banks report recoveries?
Netted against charge-offs. The Federal Reserve defines the published charge-off rate as net charge-offs — gross charge-offs minus recoveries — over average loans outstanding in the quarter, with charged-off loans reported on the Call Report’s schedule RI-B. A recoveries operation therefore shows up as a lower reported net charge-off rate rather than as a visible revenue line, which can leave recovery work under-measured inside a bank.
Should liquidation be measured gross or net of agency fees?
Net, for any comparison between agencies, because fee rates differ: an agency charging 22% has to collect noticeably more than one charging 17% to return the same money. Gross liquidation is still useful for one thing — watching a single agency’s own trend over time, where the rate is constant — but it must never be the column a ranking is sorted on.
What is a placement vintage?
The month a cohort of accounts was placed with an agency. Measuring by vintage keeps a comparison honest, because every account in the cohort has been worked for the same length of time, and because accounts placed in different months differ in how long they sat after charge-off. On the sample panel, liquidation is measured on placements from April to September, on cohorts matched across agencies, and the window is stated with the figure.