No reliable study says what percentage of insurance claims are fraud across the industry, and the numbers usually quoted do not measure the same thing. RAND's 35–42% (1995) is a share of auto-injury medical costs judged excess, buildup included. The Insurance Research Council's 21% and 18% (2015) are shares of auto-injury claims that file reviewers thought had "the appearance of fraud and/or buildup." One large European insurer put fraud at 8% of its auto theft and collision claims, in a study by Dionne, Giuliano and Picard. California's Department of Insurance estimates workers' compensation fraud at $1 billion to $3 billion a year in a system that cost employers $25.1 billion in 2015. The honest rate for any carrier is its own, measured on a random sample of claims nobody flagged; Botminds' Claims Fraud Detection, which reads every new claim and refers the suspect ones to the special investigations unit (SIU), sends such a sample to the SIU so the carrier can count it.
Four numbers, and what each one actually measures
How the figure tends to be repeated: As if 35–42% of auto injury claims were fraud
What the study measured: A share of claimed medical costs on auto injury claims judged excess in 1993, inferred from state patterns; it includes buildup on real injuries, not only invented ones.
How the figure tends to be repeated: As if one injury claim in five were fraudulent
What the study measured: Bodily injury (21%) and personal injury protection (18%) claims closed with payment in 2012 that file reviewers judged to have the appearance of fraud and/or buildup.
How the figure tends to be repeated: As if 8% of all claims were fraud
What the study measured: The insurer's own estimate of the share of its auto theft and collision claims involving fraud, used to calibrate a research model.
How the figure tends to be repeated: As if it were a share of comp claims
What the study measured: The Department's estimate of $1–3 billion a year of fraud, against $25.1 billion the system cost employers in 2015: a dollar range, not a share of claims.
What percentage of insurance claims are fraud? Why there is no single number
There is no single number because fraud is only known where someone investigated, and investigation is not random. Regulators count suspected fraud that insurers report; researchers estimate it indirectly from patterns or from reviewers' judgement; insurers know it for the claims their SIUs worked. Each method sees a different slice, and each is honest about its slice. The trouble starts when a figure leaves its study and is repeated without its definition.
The examples on this page come from the studies themselves and, for the last section, from a fictional sample carrier in Claims Fraud Detection. The dollar estimates of what fraud costs are traced in a companion guide; this one stays with percentages.
Number one: RAND's excess-claims estimate, 1995
RAND's Institute for Civil Justice concluded that "35-42 percent of claimed medical costs for automobile injuries are excess." The unit is dollars of medical cost, not claims, and the year of the data is 1993 (RAND DB-139). Its research brief rounds it to "about one-third of the automobile injury medical costs submitted to insurers."
The definition is broad on purpose: "the term excess medical claiming includes claims based on staged or nonexistent accidents, claims by people involved in real accidents for nonexistent injuries, and buildup of claims for real injuries" (RAND RB-9023). The method was indirect. The researchers took the ratio of soft-tissue to hard injury claims in Michigan and New York, whose no-fault systems gave little reason to invent minor injuries, as a baseline, and read the excess in other states from how far their ratios exceeded it. It is a careful estimate of how much the incentives of each state's system inflated medical claiming, and it is three decades old.
Number two: the Insurance Research Council's file reviews, 2015
The Insurance Research Council, a division of The Institutes supported by property-casualty insurers, had reviewers read closed auto injury claims. "Twenty-one percent of bodily injury (BI) claims and 18 percent of personal injury protection (PIP) claims closed with payment had the appearance of fraud and/or buildup in 2012, according to file reviewers" (IRC). The study rested on "more than 35,000 auto injury claims closed with payment" from twelve insurers representing 52 percent of the private passenger auto market.
Shares of claims in four studies: what was counted, and what was not
Bodily injury claims closed with payment, 2012 (IRC file review)
- Appearance of fraud and/or buildup · 21%
- No such appearance · 79%
Personal injury protection claims, 2012 (IRC file review)
- Appearance of fraud and/or buildup · 18%
- No such appearance · 82%
One European insurer's auto theft and collision claims (company estimate)
- With fraud · 8%
- Without · 92%
California workers' compensation claims, 2016 (not a fraud rate)
- Referred to an SIU · 4.56%
- Not referred · 95.44%
Three limits travel with the IRC numbers. "Appearance" is a reviewer's judgement on a closed file, not an investigation's finding. Fraud and buildup are counted together, and buildup is the larger part: claims with its appearance "accounted for 15 percent of dollars paid for BI and PIP claims in 2012." And the publisher is funded by the industry it studies, which does not make it wrong but is why its figures should be read with their definitions attached.
Number three: one insurer's own count
The closest thing to a measured rate comes from inside one insurer. Dionne, Giuliano and Picard calibrated an audit model on the auto theft and collision claims of a large European insurer, whose data gave "the current proportion of claims with fraud" as 8% (Dionne, Giuliano and Picard). Their sample shows how the estimate is built and why it is uncertain.
Inside one insurer's files: referred claims, and claims nobody suspected
857
claims its handlers sent to the SIU over the study period
673
of them classed as established or suspected fraud
184
of them contained no fraud
55of 1,000
claims the insurer did not suspect still showed some indication of fraud
The last number is the one to remember. Among roughly a thousand claims chosen at random from those the insurer had not suspected, "The 55 remaining files contained some indication of fraud." Any rate built only from investigated claims misses that group. A fraud percentage is therefore a property of how hard an insurer looks as much as of its policyholders.
Number four: California's estimate for workers' compensation
California gives a dollar range, not a share. Its Department of Insurance "states that the amount of workers' compensation fraud in the State ranges from an estimated $1 billion to $3 billion annually," in a report that also cites the Department of Industrial Relations' estimate that workers' compensation cost the state's employers "$25.1 billion in 2015" (CDI). Set side by side, the two imply roughly 4% to 12% of system cost, our arithmetic on figures from different sources and years.
The prosecutions point the same way, from below. District attorneys' workers' compensation cases in fiscal 2023-24 carried chargeable fraud of $1.2 billion, which the Department describes as follows:
The total chargeable fraud was $1,202,966,076 representing only a small portion of actual fraud since so many fraudulent activities remain to be identified or investigated.
California Department of Insurance, Workers' Compensation Fraud Program
The same report shows how little of the claim stream is even suspected. Among the 50 insurers with over 500 workers' compensation claims in 2016, 4.56% of claims went to an SIU and 0.73% were reported to the Department and district attorneys. Those are referral rates, not fraud rates, and the Department warns that they are self-reported and unverified.
Hard fraud vs soft fraud: why the numbers differ
Hard fraud is a staged or invented loss; soft fraud is an honest loss made bigger, and the studies with high percentages count mostly the second. The NAIC defines them plainly: "Hard fraud occurs when a policyholder deliberately destroys property with the intent of collecting on the insurance policy." "Soft fraud, which is more common, occurs when a policyholder exaggerates an otherwise legitimate claim or intentionally omits or lies about information on an application to obtain a lower premium" (NAIC). The NAIC adds that soft fraud "is often considered a crime of opportunity."
That split explains most of the gap between the figures. RAND and the IRC count buildup, which is soft, and reach double-digit shares. Regulators' referral counts and prosecutions are weighted towards hard fraud, which leaves evidence an investigator can take to a prosecutor, and their numbers look small against claim volumes. Neither is wrong; they are counting different behaviour. The red flags adjusters are trained on mostly point at the second kind, because the first is what a referral has to prove.
What is buildup in insurance claims?
Buildup is the inflation of a real claim: more treatment, more items, higher values than the loss justifies. The IRC defines it as "the inflation of otherwise legitimate claims" and found it "The most common type of abuse." RAND's version is "buildup of claims for real injuries." On the injury side it shows up as treatment that grows to cross a threshold; RAND's brief shows soft-injury claims in a dollar-threshold state clustering just past the threshold that opens the door to general damages.
On the property side it looks like a contents list that grows between the first call and the proof of loss, or jewelry claimed well above what the application declared. That is why a claim can be partly honest and partly fraudulent, and why most of the studies above report shares of dollars or of "fraud and/or buildup" together rather than a clean fraud rate.
Where the big dollar figures come from
The national dollar figures quoted beside these percentages trace back to estimates whose methods are not shown on the page that quotes them. The table follows each to the source it names.
Following the national figures back to where they start
| The figure | Where it appears | What that page cites |
|---|---|---|
| More than $40 billion a year of non-health insurance fraud; $400–$700 per family per year | FBI overview page, undated | No source or method shown |
| About $30 billion a year; $200–$300 a year per family | FBI story, 31 January 2012 | The Insurance Information Institute in the same sentence; the National Insurance Crime Bureau for the per-family figure |
| $4,000 to $7,000 per family over ten years | NAIC insurance fraud topic page | The FBI |
| $1 billion to $3 billion a year, workers' compensation in California | California Department of Insurance report on 2016 data | The Department's own estimate |
None of these is a percentage of claims, and none shows how it was calculated. A figure that appears on a government page is not thereby a government measurement: the FBI's 2012 story gives its $30 billion in a sentence sourced to the Insurance Information Institute, and its per-family figure to the National Insurance Crime Bureau.
How is insurance fraud measured? Four methods, four blind spots
Fraud is measured by inference, by file review, by investigation outcome or by referral count, and each has a blind spot. Inference, RAND's method, needs a clean baseline and a model of incentives, and dates quickly. File review, the IRC's, depends on what reviewers can see in a closed file and how they judge it. Investigation outcomes, the SIU's, only exist for claims someone chose to investigate. Referral counts, the regulators', measure suspicion and the effort behind it, not fraud.
The fix for the third method is the one a carrier controls: investigate a random sample of claims nobody flagged. The Dionne study's control group did exactly that, and found indications of fraud in 55 of about 1,000. Without such a sample a carrier's fraud rate is just its referral policy reflected back.
What rate should a carrier plan with? Its own, as Claims Fraud Detection measures it
A carrier should plan with its own confirmed rates, measured two ways: on the claims it referred, by score band, and on a random sample of the claims it did not. The fictional sample carrier in Claims Fraud Detection reads every new claim, 1,284 in its last 24 hours, and sends 1% of the claims below its referral line to the SIU at random. Between 1 July and 20 October, 14 of the 702 sampled claims were confirmed, 2%, against confirmed rates rising from 18% to 68% across the score bands above the line.
A carrier's own rate in Claims Fraud Detection: confirmed by band, and in a random sample below the line
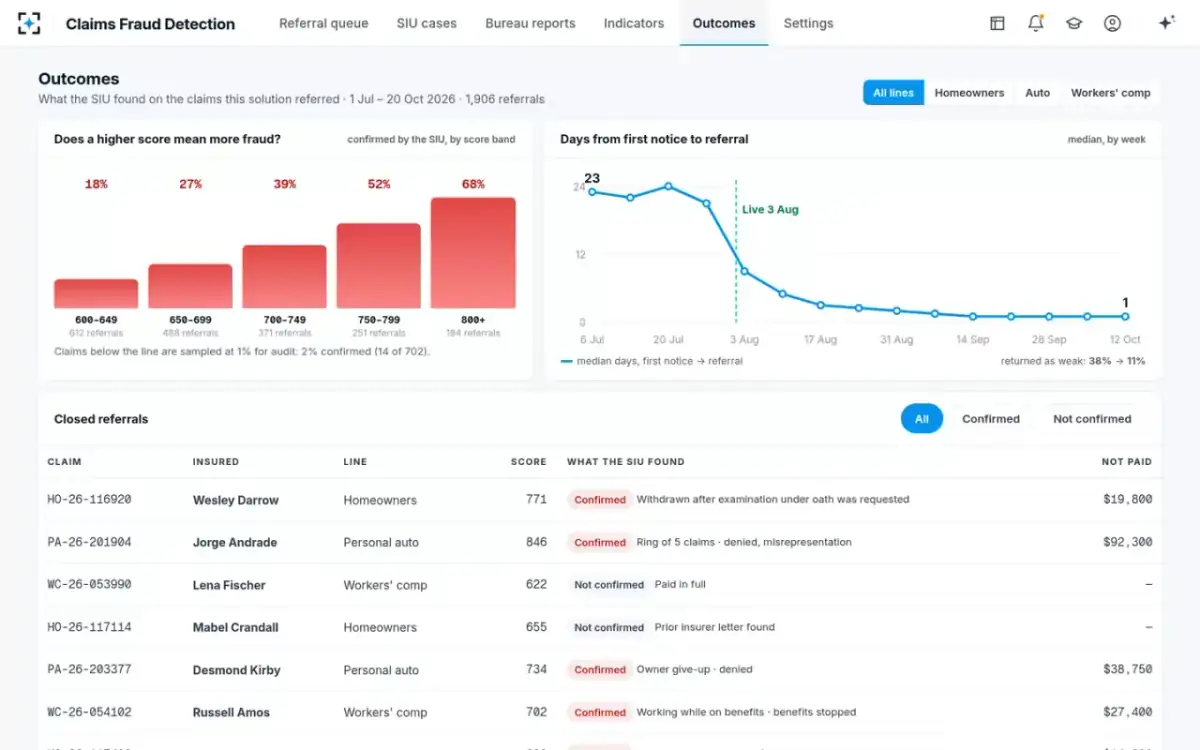
Those two numbers answer the question a CFO actually has. The banded rates say how much of what the SIU investigates turns out to be fraud; the audit sample says how much fraud goes through without anyone looking. Neither needs a national statistic, and both improve every quarter they are kept. How a score's bands should be tested is set out in what to validate in a fraud scoring model.
Questions people ask
How common is insurance fraud?
Common enough to be measured in billions, too varied to be one percentage. California's insurers reported 12,559 suspected fraudulent auto claims to the Fraud Division in fiscal 2023-24, and New York's Department of Financial Services received 51,419 reports of suspected insurance fraud in 2025. Reports measure suspicion; the studies that estimate prevalence count buildup and fraud together.
What percentage of insurance claims are fraudulent in auto injury?
The insurer-funded Insurance Research Council found that 21% of bodily injury and 18% of personal injury protection claims closed with payment in 2012 had the appearance of fraud and/or buildup, adding $5.6 to $7.7 billion, 13% to 17% of payments. RAND estimated in 1995 that 35% to 42% of claimed auto injury medical costs were excess. Both include buildup.
What is soft fraud?
The NAIC defines soft fraud as a policyholder exaggerating "an otherwise legitimate claim" or lying on an application to get a lower premium, and calls it more common than hard fraud and "often considered a crime of opportunity." Inflating a contents list or adding treatment to a real injury are typical examples.
Where does the insurance fraud statistic come from?
Usually from an estimate several steps removed from its method. The FBI's overview page gives more than $40 billion a year without a source; its 2012 story quotes industry bodies; the NAIC's topic page attributes a per-family figure to the FBI. The research figures, from RAND and the IRC, show their methods but cover auto injury claims only, in 1993 and 2012.
Is most insurance fraud committed by organised rings?
No study measures the split, but California's Legislature found organised automobile fraud in major urban centres to be "a significant portion of all individual fraud-related automobile insurance cases," and says staged collisions draw in drivers, stagers and cappers alongside lawyers, doctors, chiropractors and body shops (CDI). Rings are found by reading across claims, as the cases in staged accident rings show.
Why don't regulators publish a fraud rate?
Because they see referrals and prosecutions, not the claims nobody reported. California calls even $1.2 billion of chargeable workers' compensation fraud a small part of the real total, and its insurers' SIU referral data are self-reported and unverified. A rate would need investigation of a random sample of all claims, which only insurers can do.