Fraud risk scoring models rank insurance claims by how likely they are to involve fraud, so the special investigations unit (SIU) can choose which ones to investigate. Validating one means showing three things: that a higher score really means more confirmed fraud at the score where referrals happen, that the outcomes it learns from are not only its own past choices, and what it does to honest claims. A single accuracy figure shows none of them. Under the NAIC's model bulletin on AI, a fraud score that routes claims sits inside the insurer's written AI program, with validation, inventory and third-party diligence an examiner may ask to see. Botminds' Claims Fraud Detection scores every new claim as a sum of readable reasons and keeps the evidence a validation needs: what the SIU found, by score band, every quarter.
Sample figures on this page come from a fictional carrier as it runs through the solution. The research figures come from a peer-reviewed study of a European insurer's fraud audits and from the NAIC's model bulletin, linked where they appear.
What the guidance asks of a fraud score, and the evidence that answers it
| Guidance element | What it says | Evidence a fraud score should produce |
|---|---|---|
| Inventory (NAIC bulletin 3.3) | An inventory describing each predictive model, with detailed records of how it was built and is used | A versioned indicator list or model, with its release date and who approved it |
| Traceability (3.3) | Assessments of "interpretability, repeatability, robustness, regular tuning, reproducibility, traceability, model drift" | A run log per claim, and a score that can be recomputed from its reasons |
| Validation (3.4) | Comparing how the model did on held-out data when it was built with how it does after go-live | Confirmed rate by score band, quarter by quarter, against the development estimate |
| Bias analysis (3.2) | Data practices including "bias analysis and minimization" | A locked list of what may never be a reason, and testing of the reasons that remain |
| Third parties (4.1–4.2) | Due diligence, audit rights, and cooperation with regulatory inquiries | Contract terms giving audit rights over a vendor's score and its data |
| Closed referrals (California) | The SIU must document why a referral's red flags are reasonably clearly not fraud | Written closure reasons that become the "not confirmed" outcomes the model learns from |
What is a fraud risk scoring model?
A fraud risk scoring model turns what is known about a claim into a number that orders claims for investigation. The NAIC's bulletin defines a predictive model as "the mining of historic data using algorithms and/or machine learning to identify patterns and predict outcomes that can be used to make or support the making of decisions," and a fraud score fits that definition whether it is a gradient-boosted model or a points table built from red flags (NAIC model bulletin).
The academic literature reached the points table by a different road. Dionne, Giuliano and Picard, calibrating their model on a large European insurer's auto theft and collision claims, showed that the optimal auditing strategy "takes the form of a 'Red Flags Strategy' which consists in referring claims to a Special Investigative Unit (SIU) when certain fraud indicators are observed" (Dionne, Giuliano and Picard). Their suspicion index, a ranked combination of indicators with a threshold above which claims are audited, is in effect what most carriers call a fraud score with a referral line.
Claims Fraud Detection uses the additive form deliberately. Each claim starts from a baseline for its loss type, adds the points of each approved indicator the file supports and takes off points for each innocent explanation found. The sample burglary claim scored 120 + 760 − 68 = 812. Validation then has two layers: is each indicator worth its points, and does the total rank claims the way the SIU's findings say it should.
Do fraud scoring models need model risk management?
Yes, in substance, though not under banking rules. For insurers, the reference point is the NAIC bulletin, adopted by 29 jurisdictions as of 8 October 2026, which expects a written program for AI systems that make or support regulated decisions and names fraud detection among them. Its controls are meant to be "commensurate with" the risk to consumers, and one of the factors it weighs is how far people are involved in the final decision (the bulletin's proportionality test). A fraud score that only routes claims to a person sits lower on that scale than one that denies them; it does not sit outside it.
Banking guidance is often borrowed and should be dated carefully. The Federal Reserve, OCC and FDIC replaced SR 11-7 on 17 April 2026 with SR 26-2, which aims its guidance chiefly at banks with more than $30 billion in assets (SR 26-2). It does not bind an insurer, and neither does the NIST AI Risk Management Framework, which NIST offers for voluntary use. Both are useful vocabularies; the bulletin is what an insurance examiner will hold up. How a bank's model team reads SR 26-2 is covered in the banking guide on customer risk rating models.
Why a single AUC is the wrong validation for a fraud score
An area-under-the-curve figure measures how well a model ranks every claim against every other, but the SIU only ever acts on the claims above one line. What matters is how the model performs where the line sits: how many referrals there are, what share are confirmed, and what share of the fraud in the book they catch.
One insurer's audit strategy, in four numbers
9.23%
of claim files audited under the optimal strategy the study derived
67%
of fraudulent claims audited at that line
4%
of honest claims audited at the same line
57.8%
hit rate: audited claims that proved fraudulent
Those four numbers are what a referral line trades. Lower it and more fraud is caught, more honest claims are investigated, and the hit rate falls; the study chooses the line that minimises investigation cost plus fraud paid. A validation file should report the same four at the carrier's own line, and at the lines either side of it, so the people setting the threshold can see what moving it would cost. The cost of each kind of wrong referral works through that trade in money.
Does a higher score mean more fraud? Read the confirmed rate by band
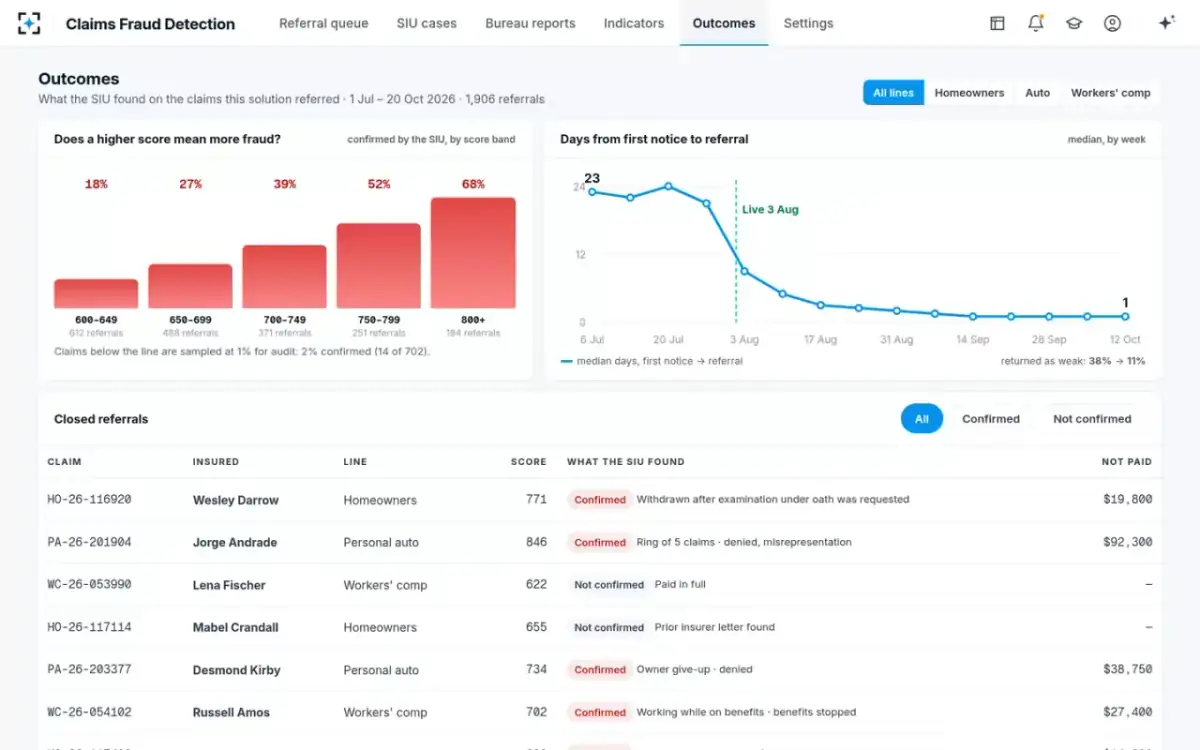
The most useful single chart for a fraud score is the share of referrals the SIU confirmed, by score band. If the bars do not rise, the score is not ranking. If they rise but the lowest band above the line is confirmed less often than claims sampled at random below it, the line is in the wrong place.
Confirmed by the SIU, by score band: the bars rise, and the line is earning its place
Two cautions keep this chart honest. First, the bands hold different numbers of referrals, from 612 down to 184; a confirmed rate on a few dozen referrals has a wide margin of error, and an indicator seen on 30 referrals, like one in the sample list confirmed on 19 of them, tells you less than its 63% suggests. Second, the chart can only be drawn for claims the SIU looked at. Without the random sample below the line, the bottom bar would be missing, and nobody could say whether the line is too high.
Outcomes by score band in Claims Fraud Detection, with the audit sample below the line
The labels are the SIU's own decisions, and they are biased
A fraud model learns from claims the SIU confirmed or cleared, and the SIU only sees claims someone referred. That makes every label partly a product of the old referral rules, and it hides fraud the old rules never sent. The Dionne study shows the size of the gap on real files: of 857 claims the insurer's handlers had sent to its SIU, 184 contained no fraud, while 55 files in a random control group of about 1,000 claims the insurer did not suspect showed some sign of fraud (the study is read in full in what percentage of insurance claims are fraud).
Three practices reduce the bias, and a validation file should show all three. A random audit sample below the referral line gives outcomes for claims the score did not choose; the sample carrier sends 1% of them to the SIU at random. Closure reasons written in plain words, which California already requires when the SIU declines a referral at preliminary review, distinguish "not fraud" from "not investigated". And outcomes are read per indicator as well as per score, because an indicator that only ever fires alongside others can look strong on borrowed evidence.
California's rule makes the second practice cheaper than it sounds. Where the SIU concludes a referral's flags are reasonably clearly not fraud, it must write its reasons into the claim or SIU file (10 CCR § 2698.36(c)). Those reasons are exactly the negative labels a model needs, if they are written so a machine can read them.
What is a good false positive rate for fraud detection?
There is no regulatory figure; the right rate is the one where the cost of investigating honest claims stops being worth the fraud it uncovers. In the Dionne model, the cost of honest claims referred is the audit cost times the share of honest claims audited, and the line is set where that, plus the fraud paid on claims not audited, is lowest. At their insurer's optimum, 4% of honest claims were audited and 42.2% of audits found no fraud.
For a carrier, the practical test is the lowest band above the line. In the sample, referrals scoring 600 to 649 were confirmed 18% of the time, so 82% of them cost an investigation without a confirmed fraud. Whether that is acceptable depends on what an investigation costs, what those claims are worth and how many honest claimants were inconvenienced; it is a decision for the fraud manager and the claims executive, made with the numbers in front of them, not a property of the model.
Can a fraud score be biased? Yes, through its reasons and its proxies
A fraud score can discriminate unfairly even when no protected trait is in it, because other inputs can stand in for one. California's claims regulation bars discrimination in claims settlement on ten listed traits, from age and race to language and disability, and on where the insured property or person is (10 CCR § 2695.7(a); the list is quoted in the guide to red flags in insurance claims). Colorado's SB21-169 goes further for the data and models themselves, requiring insurers to test whether "any external consumer data and information source, algorithm, or predictive model" unfairly discriminates, under rules its commissioner adopts line by line (Colorado SB21-169).
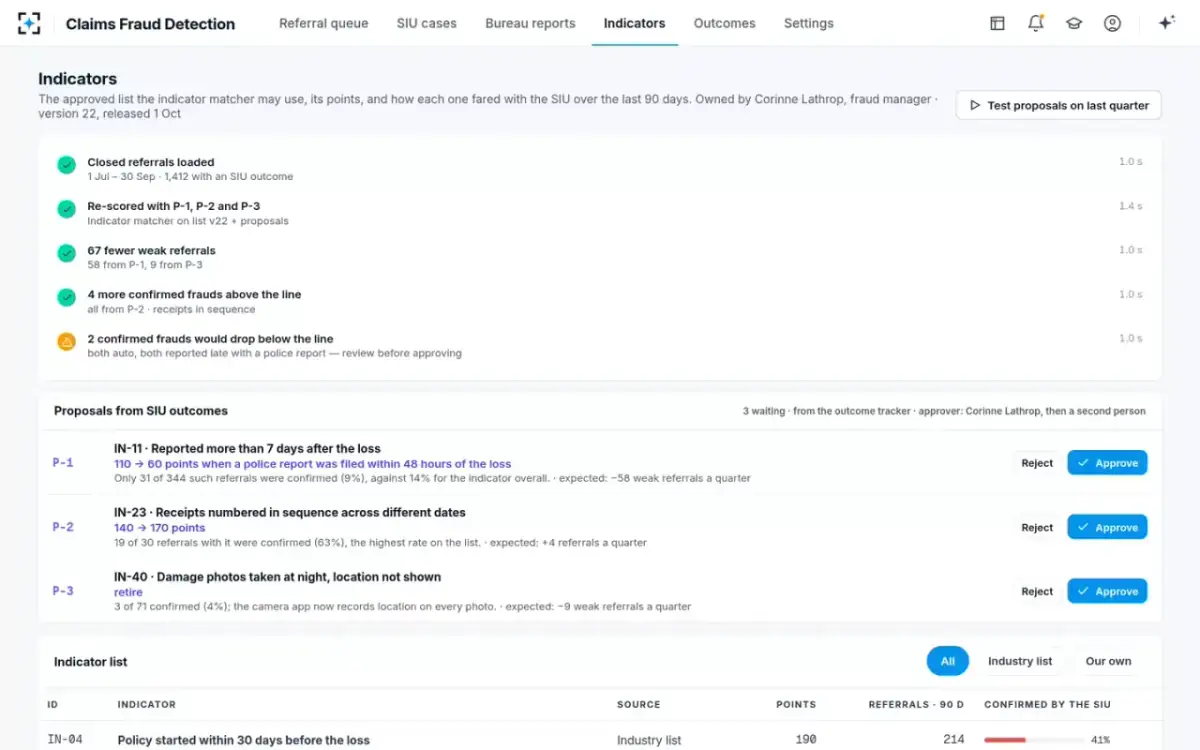
The sample carrier locks the obvious inputs off its list: protected traits, a ZIP code or neighbourhood on its own, and credit-based insurance scores. The subtler work is testing the reasons that remain. The sample shows one being caught. The indicator "reported more than 7 days after the loss" was confirmed on only 31 of 344 referrals (9%) where a police report had been filed within 48 hours, against 14% for the indicator overall; claimants who went to the police promptly but took time to list their losses were being scored as if they had hidden something. The outcome tracker proposed cutting it from 110 to 60 points in that case.
How often should a fraud model be retrained? When the outcomes say so, and only with two signatures
A fraud score should be reviewed on a fixed cycle and changed when its outcomes drift, not on a calendar alone. The NAIC bulletin defines model drift as a model's performance wearing away over time as the data underneath it changes, and fraud data drifts fast because fraudsters adapt and because the carrier's own processes change. One of the sample proposals is a case of the second kind: the indicator "damage photos taken at night, location not shown" was confirmed on 3 of 71 referrals, because the carrier's camera app now records location on every photo, and the outcome tracker proposed retiring it.
How a change to the fraud score is proposed, tested and approved in Claims Fraud Detection
Agent
Outcome trackerReads what the SIU found on every closed referral and compares each indicator's confirmed rate with its points.
Never: Changes a point or an indicator itself.
Agent
Back-test on last quarterRe-scores last quarter's 1,412 closed referrals with the proposals: 67 fewer weak referrals, 4 more confirmed frauds above the line.
Agent
The warningLists what the change would lose: 2 confirmed frauds would drop below the line, both auto, both reported late with a police report.
A person decides
Fraud managerReviews each proposal with its evidence and approves, rejects or edits it.
A person decides
Second approverConfirms the change; the list is released as a new version with its date.
The warning step is the one most validation processes skip. Every recalibration that removes weak referrals also removes some strong ones, and the people approving it should see which. Here, two confirmed frauds would fall below the line, and the fraud manager can decide whether 67 fewer weak referrals a quarter are worth them.
Proposals from SIU outcomes, tested on last quarter before anyone approves
How do you explain a fraud score to an examiner?
Show the arithmetic, the version and the evidence. An examiner asking about one claim should be able to see the indicator list in force that day, each reason with its points and its source line, the innocent explanations checked and the person who decided the referral. Asked about the model as a whole, the carrier should produce the confirmed rate by band, the audit sample, the closure reasons and the history of every change with its approvers. The bulletin's own list of what a department may request includes "Documentation related to validation, testing, and auditing, including evaluation of Model Drift."
A score that is only a model output makes the first request hard. The trace of one claim through the agents shows what the per-claim answer looks like when every reason is written down at the time. For a comparison from the casualty side, where the score predicts litigation rather than fraud, the guide on validating a litigation score asks many of the same questions.
The validation file for a claims fraud score
- The model or indicator list, versioned, with every change and its two approvers
Inventory and documentation under the NAIC bulletin, Section 3.3.
- Confirmed rate by score band, every quarter
With the number of referrals in each band, so small bands are read with caution.
- Results at the referral line and either side of it
Referrals, hit rate, share of confirmed fraud caught, share of honest claims referred.
- A random audit sample below the line
The only outcomes the score did not choose; without it the line cannot be tested.
- Closure reasons, written so they can be counted
The negative labels; in California the SIU must write them anyway.
- Per-indicator confirmed rates, with proposals and their back-tests
Including the confirmed frauds each change would lose.
- The locked list of what may never be a reason, and the tests of proxies
Protected traits, territory, credit-based scores, and anything that stands in for them.
- Third-party terms
Audit rights and regulatory cooperation for any vendor's score or data.
Questions people ask
How do you validate a fraud scoring model?
Compare its ranking with what the SIU found: the confirmed rate by score band should rise, and the band just above the line should beat a random sample below it. Report results at the operating line, not only overall, and repeat the comparison every quarter against the development estimate, which is the form of validation the NAIC bulletin describes.
What does the NAIC AI bulletin require for fraud models?
It requires no specific test. It expects a written program covering AI systems used in paying claims and in detecting fraud, with governance, inventories, validation, bias analysis and third-party diligence proportionate to the risk, and it lists the documents a department may request. Twenty-nine jurisdictions had adopted it as of 8 October 2026.
Is SR 11-7 required for insurance fraud models?
No. SR 11-7 was banking guidance, and it was replaced on 17 April 2026 by SR 26-2 from the Federal Reserve, OCC and FDIC, aimed mainly at banking organisations with over $30 billion in assets. Insurers may borrow its vocabulary; their examiners work from state law and the NAIC bulletin.
Who should validate a fraud model?
Someone other than the people who built it or set its line. The NAIC bulletin asks governance to keep decision-makers and lines of defence independent at each stage of an AI system's life. In practice that is model risk or internal audit, with the SIU supplying the outcomes and the fraud manager owning the decisions.
How many referrals do you need to validate a fraud score?
Enough in each band that the confirmed rate would not swing on a handful of cases. The sample bands hold 184 to 612 referrals over about four months; an indicator seen on 30 referrals gives a far less certain rate. Pool quarters or widen bands rather than over-reading a small count.
What is model drift in fraud detection?
The NAIC's bulletin describes it as performance that decays over time as the data changes. In fraud it shows up as indicators whose confirmed rate falls, because schemes adapt or the carrier's own processes change, as when a camera app starts recording photo locations and an old red flag stops meaning anything.