How much insurance fraud costs the industry has no current, measured answer. The national figures in circulation are estimates: the FBI's overview page puts non-health insurance fraud at "more than $40 billion per year" without a date or a method, and the most rigorous studies, by RAND and the insurer-funded Insurance Research Council, measured auto injury claims in 1993 and 2012. What can be counted is what regulators see: California's Fraud Division logged $727 million of potential loss on the suspected fraud referred to it in fiscal 2023-24 across three programs. For a single carrier the money that can be managed sits in two errors, a fraudulent claim paid because nobody referred it and an honest claim held because somebody did, and both can be priced. Botminds' Claims Fraud Detection is built to move both: it reads every new claim at first notice and refers the suspect ones to the special investigations unit (SIU) with their evidence, and it lowers a claim's score when the file explains a reason innocently.
What California's insurers put in front of the Fraud Division in one year
$207.6M
potential loss on 12,559 suspected fraudulent auto claims
$362.2M
potential loss on 4,580 property, life and casualty referrals
$157.2M
potential loss on 2,932 workers' compensation referrals
$1.2B
chargeable workers' compensation fraud in district attorneys' cases
by the Department’s own account, a small part of the real total
The two ways a fraud program loses money
A fraud program loses money by missing fraud and by chasing honesty, and the two costs land on different people. A missed fraud is paid, never reported and never recovered. A wrongly held honest claim costs investigator and adjuster time, delays a claimant who did nothing wrong and, at the margin, exposes the carrier under its claims rules. Most programs count the first and ignore the second.
Two kinds of wrong, and who pays for each
A fraud nobody referred
The claim is paid in full
The carrier, then every policyholder in the rating pool
No referral, so no state report
The prosecutor never sees the scheme
No investigation, so nothing to recover
Restitution is only ordered after a conviction
The scheme learns it worked
The next claim from the same people or the same shop
An honest claim held
An investigator's hours on a claim that was honest
The SIU budget, and the claims it could have worked instead
The adjuster's time answering questions and rebuilding the file
Every other claim on that desk
A slower decision for the claimant
The claimant first; then the carrier, if the delay breaks a claims rule
A referral returned as weak
The SIU's trust in the next referral from that desk
The cascade explains why a fraud program cannot be judged on recoveries. Recoveries come only from the left column, and only at its end, after a conviction. Most of the money a program saves is claims it never paid, and most of what it wastes is investigators' time on claims that were honest. A program that counts neither is pricing a third of its own work.
How much does insurance fraud cost the industry? What the estimates measure
Each national figure answers a different question, which is why they cannot be added or compared. The table sets out the ones still quoted, what they count and how old the data is. The question of what share of claims they imply is traced separately in what percentage of insurance claims are fraud.
The cost estimates still quoted, and what each one counts
| Estimate | Who, and when | What it counts |
|---|---|---|
| $13–18 billion in auto premiums | RAND Institute for Civil Justice, 1995, on 1993 claims | Excess medical claiming on auto injury claims, fraud and buildup together; insurers paid $9–13 billion in compensation and other costs |
| $5.6–7.7 billion | Insurance Research Council, 2015, on 2012 claims; funded by insurers | Excess payments from fraud and buildup on auto injury claims: 13% to 17% of payments under the five main coverages |
| More than $40 billion a year | FBI overview page, undated | All non-health insurance fraud; no method or source shown |
| About $30 billion a year | FBI story, 2012, leaning on industry figures | Non-health insurance fraud, in a sentence citing the Insurance Information Institute |
| $1 billion to $3 billion a year | California Department of Insurance, in its report on 2016 data | Workers' compensation fraud in California alone |
The two research studies are the most careful and the most limited. RAND put the excess at 35 to 42 percent of claimed auto-injury medical costs, counting buildup of real injuries as well as invented ones (RAND; read closely in what percentage of insurance claims are fraud). The IRC's figure rests on more than 35,000 closed claims from twelve insurers, and the IRC itself notes that "the additional costs associated with these efforts to fight fraud and buildup are not included" (IRC). Neither covers property, workers' compensation or commercial lines, and neither is recent.
Who pays for insurance fraud?
Policyholders pay most of it, through premiums, and employers and insurers pay for the fight against it. California's Department of Insurance puts it plainly for workers' compensation: "Insurance companies pick up the tab, passing the cost onto policyholders, taxpayers, and the general public" (CDI). The per-family figures that circulate all trace back through the FBI: its overview page says fraud "costs the average U.S. family between $400 and $700 per year in the form of increased premiums," its 2012 story gave "$200 to $300 a year per family" on the National Insurance Crime Bureau's numbers, and the NAIC's fraud page attributes "$4,000 and $7,000 in increased premiums over a 10-year period" to the FBI (NAIC). None shows its arithmetic.
The enforcement bill is easier to see. California funds workers' compensation fraud investigation and prosecution from an assessment on employers: "The total aggregate assessment for fiscal year 2023-24 was $85,700,386." Its property, life and casualty program is paid for by "a $2,100 assessment for each certificate of authority in California." Fraud costs a carrier its losses, its SIU and its share of the state's bill, before a single referral is wrong.
What California's referrals put at stake, per referral
Dividing each program's potential loss by its referrals gives a rough price for the claim a carrier did not refer: the average amount at stake on a suspected fraud that the industry did report. It is our arithmetic on the Department's totals, and it is an average across very different claims, but it shows how much the line of business changes the stakes.
Potential loss per suspected fraud referral, California, fiscal 2023-24
What is the cost of a missed fraudulent claim?
The direct cost is the claim paid; the larger cost is what the payment teaches. Dionne, Giuliano and Picard, calibrating an audit model on a large European insurer's auto claims, found that even the cost-minimising strategy left a third of fraudulent claims unaudited and paid, and that the strategy's value comes partly from deterrence: claims are audited "in order to detect fraud but auditing also acts as a deterrence device" (Dionne, Giuliano and Picard). A missed fraud is a signal to the next claimant that the file will not be read.
That is why the same study warns against judging an SIU only on what it saves per case:
A consequence of this result is that the SIU should not be organized as a profit center of the insurance company, for otherwise its objective would be in conflict with the implementation of the optimal auditing strategy.
Dionne, Giuliano and Picard, Optimal Auditing with Scoring
A missed fraud also costs the regulatory chain. In California an insurer must report on reasonable belief within 60 days and "regardless of payment status," so a fraud discovered after payment still has to be reported; one that is never discovered simply never reaches the Fraud Division, which cannot prosecute what it never sees. The path from referral to prosecution shows how few even of the reported ones get there.
What does a false positive cost an insurer?
A false positive costs investigation time, adjuster time and the claimant's patience, and each can be priced. The audit cost in the Dionne study was €280 per claim, "including investigation costs, lawyers fees, SIU overheads," on an average claim of €1,284. In the United States, the Bureau of Labor Statistics puts the median wage of claims adjusters, examiners and investigators at $78,000 in May 2025 (BLS), about $37.50 an hour over a 2,080-hour year before benefits and overheads, our arithmetic; every hour an investigator and an adjuster spend on an honest claim is priced from there.
The claimant's cost is time, and California's claims rules put limits on it. An insurer must accept or deny within 40 days of proof of claim, and may take 80 only where specific information the Department can review supports the belief that the claim is fraudulent (10 CCR § 2695.7(k); the guide to claim scoring quotes the rule). It must also investigate thoroughly, fairly and objectively, and stop asking for information the claim does not need (§ 2695.7(d)). A referral built on a weak flag is how an honest claim drifts towards both lines. Rules on prompt payment in other states are compared in the Property and Auto Claims guide on prompt payment laws by state.
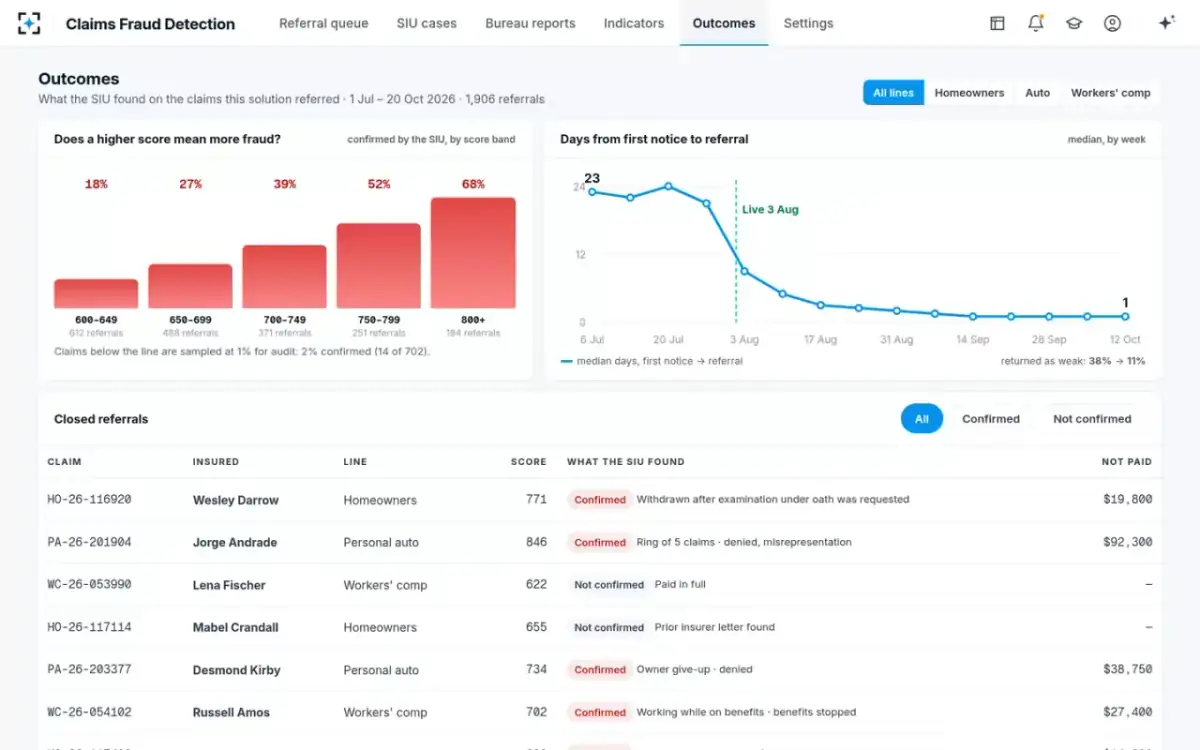
The last cost is inside the carrier. A referral the SIU sends back as weak costs the intake analyst the hours spent rebuilding the file, and costs the adjuster credibility on the next one. On the fictional sample carrier, 38% of referrals came back from the SIU as weak before Claims Fraud Detection went live; the solution's design target is 11%. Neither is a measured customer result; both are the kind of number every SIU can count on its own desk.
What the SIU found on Claims Fraud Detection referrals, and what was not paid
Pricing both errors on your own book
The total cost of a referral line is the investigation cost of every honest claim it sends, plus the investigation cost of every fraud it sends, plus the fraud paid on everything it misses. The Dionne study writes it exactly that way, choosing the line that minimises "excessive auditing of non-fraudulent claims against inadequate deterrence and detection of fraudulent claims." A carrier can fill in the same terms from its own data.
The cost of a referral line, written as a sum a carrier can fill in
Honest claims referred
honest referrals × cost per investigation
From the SIU's closed referrals marked not confirmed, and its hours per case.
SIU manager
Fraud referred
confirmed referrals × cost per investigation
The price of catching what the line catches.
SIU manager
Fraud missed
fraud below the line × average paid
Estimated from a random audit sample below the line; without one this term is a guess.
Fraud manager
Fraud not paid
confirmed referrals × amount not paid
The saving: claims denied, withdrawn or reduced after investigation.
Claims finance
The study's own worked example shows the scale. On about 500,000 claims averaging €1,284, with 8% fraudulent, paying everything cost €642 million, €51 million of it fraud. Auditing 9.23% of files at €280 each, and still paying the third of fraud left unaudited, cost €621 million: "a saving of €21 M, which represents 41% of the current cost of fraudulent claims." Those are one European insurer's figures from the 2000s, and the paper says the saving would be larger with deterrence counted. The method travels; the numbers do not.
How do you calculate fraud savings? Count what was not paid, separately from what came back
Fraud savings are the claims, or parts of claims, not paid because an investigation found fraud; recoveries are money returned after it was paid. The two differ by orders of magnitude. New York's insurers reported "approximately $3.5 billion in savings and approximately $40.3 million in recoveries" from their SIUs' investigations in 2024, according to the Department of Financial Services (NY DFS), roughly 87 dollars saved for every dollar recovered, our arithmetic.
Restitution ordered by courts is smaller still and arrives last. California's district attorneys secured restitution orders of $31,543,396 in workers' compensation fraud convictions in fiscal 2023-24, of which $11,682,851 was collected. Texas reported $50.9 million in court-ordered restitution from cases its Fraud Unit contributed to in fiscal 2025 (TDI). A business case that leans on recoveries undercounts the program by a wide margin; one that counts savings must say how they were measured, because "not paid" includes claims withdrawn when an examination under oath was requested.
What is a good fraud detection ROI? Test Claims Fraud Detection on your own referrals
No regulator or study sets one, and a figure quoted without its terms is marketing. A defensible return compares the four terms above before and after a change, on the carrier's own closed referrals: fraud not paid, plus fraud found that the old line missed, less investigation hours, less the tool's cost. Claims Fraud Detection's design targets are referrals one day after first notice instead of an estimated 23, and 11% of referrals returned as weak instead of the sample carrier's 38%; the honest way to turn those into money is to run the solution on a sample of the carrier's own closed referrals and price the difference.
Two traps distort the result. Raising referrals raises savings and investigation cost together, so a program can show rising savings while losing money on its marginal referrals. And small claims are underpriced: California's own report concedes that, with limited resources, good referrals of low value may never be opened as cases by the state (CDI), but a carrier still pays them if nobody questions them.
Questions people ask
How much does insurance fraud cost per year?
There is no current, measured national figure. The FBI's undated overview gives more than $40 billion a year for non-health insurance fraud; the most rigorous studies measured auto injury claims only, at $5.6 to $7.7 billion of excess payments in 2012 according to the insurer-funded Insurance Research Council. California alone logged $727 million of potential loss on referrals in fiscal 2023-24.
How much do premiums go up because of fraud?
The figures quoted, $400 to $700 a year per family on the FBI's overview page and $200 to $300 in its 2012 story citing the National Insurance Crime Bureau, show no method. RAND's 1995 study estimated that excess medical claiming may have cost consumers $13 to $18 billion in auto insurance premiums in 1993, which is the most transparent estimate but an old one.
Does the insurer get its money back from fraudsters?
Rarely in full. Restitution follows conviction: in California's workers' compensation program, $31.5 million was ordered in fiscal 2023-24 and $11.7 million collected. Most of a fraud program's value is in claims not paid, which New York's insurers reported at about $3.5 billion against $40.3 million recovered in 2024.
Who funds insurance fraud investigations in California?
Employers fund the workers' compensation program through an assessment, $85,700,386 in fiscal 2023-24, and insurers fund the property, life and casualty program through a $2,100 assessment per certificate of authority. The Fraud Assessment Commission sets the workers' compensation assessment each year.
Is claim buildup counted as fraud in these figures?
In the research figures, yes. RAND's excess claiming counts the padding of real injury claims, and the IRC found buildup, inflating a claim that is otherwise genuine, the most common type of abuse: claims with its appearance accounted for 15 percent of dollars paid on bodily injury and personal injury protection claims in 2012. Regulators' referral totals count suspected fraud, not buildup.
What does a weak SIU referral cost?
The intake analyst's hours rebuilding the file, the adjuster's time answering questions, and a slower claim for a claimant who may have done nothing wrong. Count it on your own desk: referrals returned or closed without investigation, times the hours each took, times the loaded hourly cost.