The claims management KPIs that move money in property and auto claims are the ones that measure waiting: how many days each open file has gone without anything moving it, which state deadlines fall due on files nobody is pushing, and what the rental, storage and hotel meters on those files cost each day. The familiar KPIs, such as the loss adjustment expense ratio, average days to close and closure rate, are outcomes. They arrive after the money is spent. Waiting measures arrive while there is still time to act, and every one of them can be computed from dates a claim system already holds.
That is the idea behind Claims Cycle Time Monitoring, Botminds' solution that reads every open property and auto file each morning, works out who each file is waiting on and when anything last moved it, and prices each day of waiting. It is hard work to do by hand because a claim diary looks busy even when a file is stuck. This guide defines the measures and their formulas, then shows them on a fictional sample team: 318 open files and nine adjusters in Columbus, Ohio. Every person, company and claim figure in the sample is invented.
What claims handling costs the U.S. property and casualty industry
$86.0B
loss adjustment expense incurred in 2025
NAIC, net of reinsurance
9.0%
of net premiums earned went to adjusting claims in 2025
our arithmetic from NAIC figures
$162.9B
of loss adjustment expense still unpaid on the books at year end
NAIC, 31 Dec 2025
What are the claims management KPIs that matter most?
Four families matter, and only one of them is usually on the wall. Outcome KPIs (loss adjustment expense ratio, average paid severity, days to close) tell finance what the year cost. Flow KPIs (quiet days, files crossing a threshold this week) tell a supervisor which files are stuck now. Compliance KPIs (deadlines due, letters late) tell the claims director where a regulator would find a violation. Cost-of-delay KPIs (the daily meters) tell everyone what the stuck files are spending.
The order matters because the last three lead the first. A file that sits for three weeks waiting on a supplement approval shows up in the outcome numbers only when it closes, as extra rental days, a longer cycle time and perhaps a complaint. By then the money is spent. A team that reviews only outcomes is reading last quarter's quiet files.
A claims KPI scorecard: what each measure needs and what it warns of
| KPI | Formula | Fields it needs | What it warns of |
|---|---|---|---|
| Quiet days | Today minus the date of the last meaningful activity on the file | Activity dates with a type: document, payment, decision, two-way contact | A file nobody is moving, whatever its age |
| Files past 14 days quiet | Count of open files with quiet days of 14 or more | Quiet days per file | The backlog a supervisor must work this week |
| Crossing this week | Files that will pass 14 quiet days within 7 days with nothing booked | Quiet days plus booked events (inspection, parts date, statement) | Tomorrow’s backlog, while it can still be avoided |
| Clocks at risk | Statutory deadlines due in 14 days on files past 7 days quiet | Notice, proof-of-loss and decision dates; the state on each file | A letter or decision that will be late |
| Daily meter | Sum of daily rental, storage and hotel charges on files quiet 7 days or more | Vendor bills: rental direct bill, yard invoices, hotel folios | What the waiting costs, per day |
| Loss adjustment expense ratio | Loss adjustment expense ÷ earned premium | Annual statement or general ledger | What the year’s handling cost, after the fact |
Loss adjustment expense ratio: the outcome KPI everyone reports
The loss adjustment expense ratio is the cost of investigating, adjusting and settling claims divided by earned premium, and it is the claims KPI most often reported to a board because it comes straight from the financial statements. In 2025 the U.S. property and casualty industry incurred $86.0 billion of it against $958.7 billion of net premiums earned, about 9.0% in our arithmetic, according to the NAIC's full-year results. In the NAIC's ten-year table it has grown from $61.8 billion in 2016 to $86.0 billion in 2025.
The ratio is useful and slow. It aggregates salaried adjusters, independent adjusters, legal and outside services across every line, and it moves only when the year's costs are booked. It cannot tell a manager which files are costing money today. Nor does it capture the costs of a stuck claim that are paid as policy benefits rather than adjusting expense: rental days paid under the policy, storage on a total loss, additional living expense while a family waits in a hotel.
The NAIC's balance sheet makes the same point from the other side. At the end of 2025 the industry carried $162.9 billion of unpaid loss adjustment expense, the cost of finishing the claims still open. Each quiet day on an open file adds to that work rather than finishing it.
What is claims leakage in insurance, and which part can a KPI see?
Claims leakage is money paid out on claims beyond what was owed or needed: overpaid estimates, missed recoveries, and expense that a better-run file would not have incurred. The published estimates of its size that we found come from vendors and consultancies, and we do not repeat them. What a claims team can measure for itself is the part of leakage caused by time, because that part leaves dated evidence on the file.
Time-driven leakage has three sources. The first is the daily meters: rental, storage and hotel charges that run while a file waits, priced from the vendors' own bills. The second is statutory interest. Florida adds interest to any residential property payment made after the 60-day pay-or-deny deadline, counted back to the day the insurer received notice of the claim (Fla. Stat. §627.70131(7)(a)). Texas goes further: an insurer that breaks its prompt-payment rules owes, on top of the claim, "interest on the amount of the claim at the rate of 18 percent a year as damages, together with reasonable and necessary attorney's fees" (Tex. Ins. Code §542.060(a); a different rate applies to suits under chapter 542A). The third is the handling time of the calls and escalations a quiet file attracts.
Outcome KPIs and waiting KPIs answer different questions
Outcome KPIs: At month or year end, once costs are booked.
Waiting KPIs: Every morning, as activity lands or fails to.
Outcome KPIs: The book of claims as a whole.
Waiting KPIs: One file, one waiting party, one deadline.
Outcome KPIs: Finance and claims leadership, by changing budgets and staffing.
Waiting KPIs: The adjuster and supervisor, by sending one message or approving one step.
Outcome KPIs: The total, after the fact, mixed with everything else.
Waiting KPIs: Rental, storage, hotel and interest that are accruing now.
Outcome KPIs: Financial statements.
Waiting KPIs: Dated activity, vendor bills and the state on each file.
Quiet days: the KPI that leads the rest
Quiet days are the days since the last activity that moved a file, and they are a better leading KPI than days open because they ignore the age a file has earned honestly. A forty-day-old file that received a supplement yesterday is moving; a twelve-day-old file that has had nothing but notes for ten days is not. The measure depends entirely on what counts as moving a file, so that definition must be written down before any number is reported.
In the sample, four kinds of event reset the clock: a document arrives (estimate, supplement, report, invoice, payoff letter), a payment is issued or a reserve changes, an approval or coverage decision is made, or a two-way conversation takes place. Notes, routing between desks, an outbound voicemail or unanswered email and a pushed diary date are recorded but do not reset it. Each team can change that list. What it cannot do is count everything, because then the measure reports effort rather than progress.
The data is already required. California's claims regulation obliges insurers to "record in the file the date the licensee received, date(s) the licensee processed and date the licensee transmitted or mailed every material and relevant document in the file" (10 CCR 2695.3(b)(2)). Florida requires dated records of every claim-related communication, request for information, inspection, estimate and payment or denial on a residential property claim (§627.70131(4)(b)). Quiet days are those dates read in order. Why days open misleads as a cycle-time measure is the subject of what claim cycle time should count.
Price the meters: rental, storage and hotel on files that wait
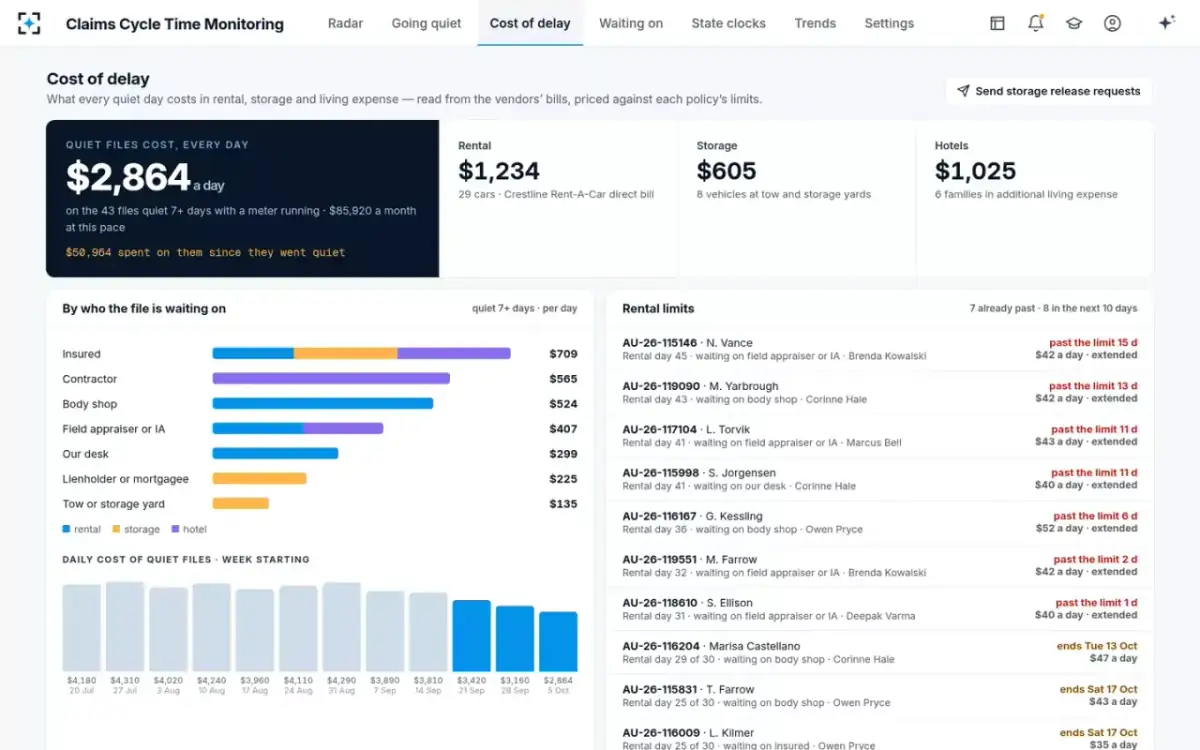
The daily meter is the sum of the per-day charges running on files quiet seven days or more, and it is the KPI that turns a backlog into a number finance recognises. It should be priced from the bills, not from averages: the rental company's direct bill gives the rate and days billed, the storage yard's invoice the daily rate, the hotel folio the nightly rate. Split by the party each file is waiting on, it shows where the money leaks.
Where a sample team’s $2,864 a day goes, by who the file is waiting on
The split changes what a supervisor does next. The insured tops the sample's list, which sounds like nothing the carrier can fix until the files are opened: a contents list not yet sent, a repair authorisation unsigned, a call nobody returned. The insurer's own desk appears too, at $299 a day, which is the line most diaries hide because the file note says "waiting on the shop". How that happens is traced in when a pending claim is waiting on the insurer.
Prices for what the meters buy have risen faster than general inflation. The consumer price index for lodging away from home rose 27.3% between January 2020 and September 2026, and for motor vehicle maintenance and repair 56.1% (BLS data; our arithmetic). Longer and dearer repairs mean more rental days per claim, so the same quiet week costs more than it did.
The cost of delay, read from the vendors’ bills
Clocks at risk: the compliance KPI with a price
Clocks at risk count the statutory deadlines due in the next two weeks on files that are already quiet, and they belong on the same scorecard because a quiet file is the usual way a deadline is missed. State rules set an acknowledgement clock, a decision clock, a cadence for written status letters while the decision is pending, and a payment clock; the four differ by state, as set out in prompt payment laws by state.
Examiners count these deadlines file by file. Pennsylvania's market conduct reports express findings as an error ratio, "calculated by dividing the number of policies with violations by the total number of policies reviewed". In one 2025 examination of hail claims at two affiliated insurers, examiners reviewed 150 homeowner files and every one of the five violations they cited was a status letter not sent on time under 31 Pa. Code §146.6, for error ratios of 1% and 5%. A team that tracks its own status letters in the same way, as a share of files due, reports the number an examiner would compute.
Which claims KPIs belong on which desk?
Each KPI should go to the person who can change it, at the frequency at which it moves. Reporting quiet days to finance monthly wastes them; reporting the loss adjustment expense ratio to an adjuster daily is noise. The sample's alert rules follow that logic: the file owner hears three days before a predicted crossing of 14 quiet days, the supervisor when a file crosses, and the customer experience lead at 30 days or when a customer's second call goes unanswered.
A weekly claims KPI review that leads instead of reports
- Adjuster, daily: own files crossing 14 quiet days this week
With the waiting party and the one next step for each.
- Supervisor, daily: files past 14 quiet days, and clocks due in 14 days
Sorted by daily meter, so the costliest wait is worked first.
- Desk appraiser, daily: supplements with a customer in a rental
A queue worked largest first leaves the small supplement with a running rental at the back.
- Operations manager, weekly: files past 30 quiet days by team and adjuster
With days to close and rental days per claim beside it, so a fall in one is not bought with a rise in another.
- Finance, monthly: the daily meter trend and statutory interest paid
The part of leakage that time causes, priced from bills.
- Compliance, monthly: status letters sent late as a share of letters due
The error ratio an examiner would compute.
How do you read a cycle time trend without fooling yourself?
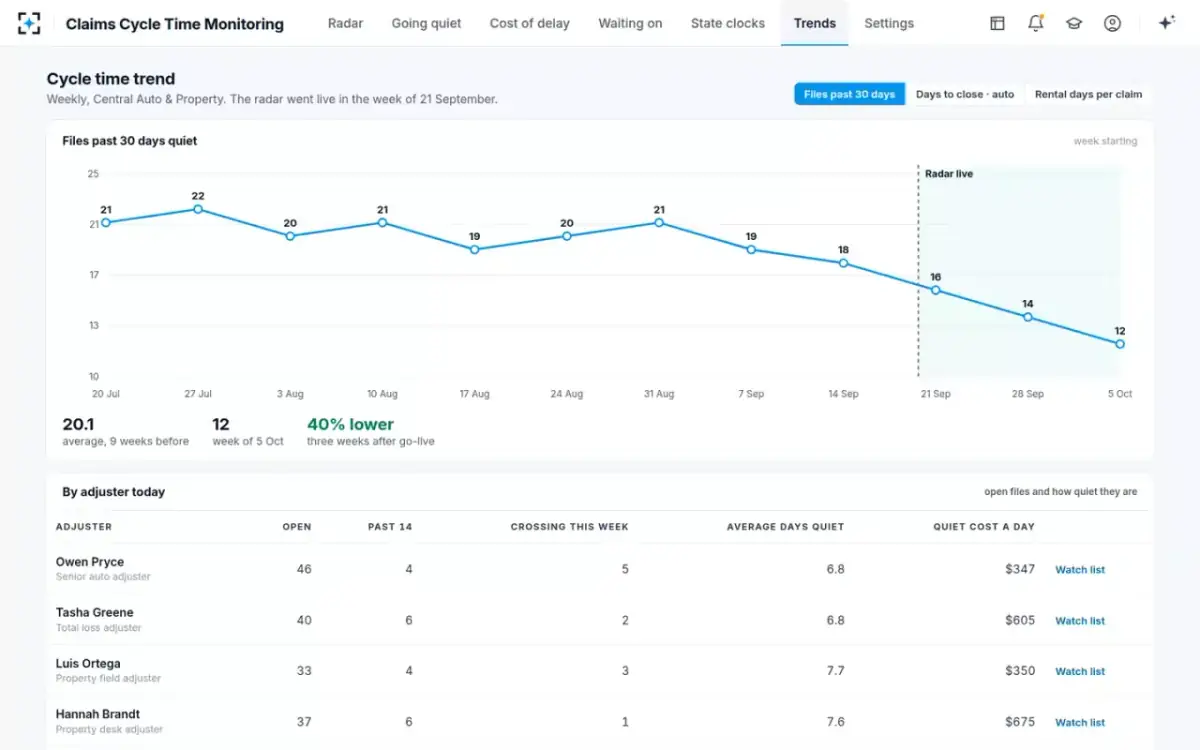
Read the count of files past 30 quiet days weekly, against a baseline of several weeks taken before any change, and always beside an outcome measure that could be gamed in the opposite direction. The sample shows the pattern: files past 30 quiet days averaged 20.1 a week over the nine weeks before monitoring started and stood at 12 in its third week. That is fictional sample data and proves nothing about any real team. The solution's design target is 40% fewer files past 30 quiet days three weeks after go-live, a goal to be measured on a carrier's own files.
Files past 30 days quiet, week by week
Two traps recur. The first is redefining progress: if a note starts resetting the clock, the count falls and nothing has changed, which is why the definition is fixed in settings and every change is kept as a new version. The second is closing files to shorten the list. A file closed without payment and then reopened has a short cycle time and a dissatisfied customer, so a team that reports quiet days should also report reopen rates.
How Claims Cycle Time Monitoring computes these KPIs
The solution runs six agents each morning at a time the team sets, 06:00 in the sample. One reads every note, task, document, payment, call and vendor update and marks whether each moved the file; one works out who the file is waiting on, following the chain when that party is itself waiting on the insurer; one predicts when each file will cross 14 and 30 quiet days, from how the waiting party behaves on closed files and what is already booked; one prices each day from the vendors' bills; one tracks the state clocks and drafts status letters; one drafts the next step for each quiet file. In the sample's morning sweep it read 2,914 activities on 318 files and found that 1,087 had moved a file.
The limits are part of the KPI's credibility. The agents are read-only on the claim system, never extend or end a rental, never approve a supplement or a payment and never contact a customer; the adjuster sends, the desk appraiser approves supplements and the supervisor decides anything past authority. The predictor uses only the waiting party's behaviour, what is booked and the file's own dates, never the claimant's personal characteristics. For the arithmetic of what a stalled total loss costs per day, see pricing each day of total loss delay.
Questions people ask
What is a good KPI for claims processing?
One that a person can act on the day it moves. Quiet days per file, files crossing 14 quiet days this week and statutory deadlines due on quiet files meet that test; average days to close and the loss adjustment expense ratio do not, because they arrive after the cost. Report both kinds, with the leading ones daily.
What are the main P&C claims metrics?
Insurers report losses, loss adjustment expense and reserve development in their annual statements, and the NAIC aggregates them; in 2025 the industry's net loss ratio, including adjusting expense, was 66.5%. We found no regulator that publishes a standard definition of operational measures such as cycle time or reopen rate, so each insurer defines its own and should write the definition down.
What does claims leakage mean?
Money paid on claims beyond what was owed or needed, through overpayment, missed recovery or avoidable expense. The share caused by delay can be measured from the file: rental, storage and hotel charges on quiet files, and statutory interest such as Florida's on residential property payments made after its 60-day deadline.
What is a good loss adjustment expense ratio?
There is no regulatory benchmark, and the ratio varies widely by line. As context, the NAIC's 2025 figures put industry loss adjustment expense at about 9.0% of net premiums earned in our arithmetic. Compare a book against its own history and line mix rather than against an industry average.
What are claims work metrics?
Measures of the work itself rather than the money: open files per adjuster, files touched, quiet days, letters sent on time, supplements answered. In the sample, the morning sweep found that only 1,087 of 2,914 activities moved a file, which is why counting touches overstates progress.
How often should claims KPIs be reviewed?
At the speed each one moves. Files crossing a quiet threshold and deadlines due change daily and belong in the morning huddle; trends by team and adjuster belong in a weekly review; the loss adjustment expense ratio and interest paid belong in the monthly or quarterly finance review.