Industry loss estimates are published figures for the insured loss one catastrophe caused to the whole market: modelling firms issue ranges within days of landfall, and an industry index publishes its own estimate later and revises it for months. For a reinsurer they are the most important number of the first week, because industry loss warranties settle on an index, because the quickest way to price a book is a share of the industry figure, and because the risk committee will ask how the company's loss compares. They are also the number most likely to be wrong early and to disagree with the reinsurer's own model. Botminds' Catastrophe Event Response is an agentic solution that keeps every published estimate as a dated version, re-prices every program and layer on each, and shows which estimate led each loss pick, so the second line can test the choice rather than reconstruct it.
Where this page uses a worked example, it comes from the solution's sample event: Hurricane Delphine, a fictional Florida hurricane, as it runs through Northmoor Re, a fictional reinsurer. Those names and figures are sample data. Everything else is from regulators, a state fund, the U.S. Treasury and peer-reviewed research, linked where it appears.
Eight questions for any event loss pick, and the evidence that answers each
| Question | Why it matters | Evidence to ask for |
|---|---|---|
| Which estimate leads, and who chose it? | Index, modeller midpoint and own footprint can differ by billions. | The written order of sources and the dated release used in each run |
| How wide is the range, and where does the pick sit? | A midpoint hides a range that may cross several layers. | Each modeller range, with the pick marked inside it |
| What would move the pick by a material amount? | Layers turn small moves in the industry figure into large ones in the loss. | The industry figure at which each layer attaches and exhausts |
| Which model, version and settings? | Demand surge, storm surge and long-term rates are switches. | Model name, version and settings for every run, as Florida asks insurers |
| How current is the exposure behind each share? | A stale cedant file mis-states the share of industry. | The exposure file and date per program; stale files flagged |
| Does the pick reconcile to cedant advices? | Advices are claims, not models. | Each advice against the model, with gaps over a threshold explained |
| Is every loss inside the event? | Hours clauses decide what is one occurrence. | The event definition applied to each program, from its wording |
| When will the pick be revisited? | An unrevisited pick drifts from the market. | Written triggers, and the log of each revision with its signature |
What are industry loss estimates?
An industry loss estimate is one figure, sometimes with a range, for the total insured property loss from one event across all insurers in a territory. It is not any company's loss and not the economic loss to the region; it counts insured damage as the publisher defines it. Its value to a reinsurer is that everyone sees the same number at the same time.
Three uses make it central. Industry loss warranties pay when a named index passes a trigger; Treasury's Federal Insurance Office, citing industry trackers, put that market's capacity "estimated at between $4 and $6 billion" in 2025. Reinsurers price their books quickly by applying each cedant's share of the industry figure. And boards compare the company's loss with the industry's to ask whether the book behaved as modelled.
The sample event shows how quickly the figure can change. Six published numbers arrived in four days, from $14.0 billion on landfall day to the index's $38.0 billion on day four. How a reinsurer re-prices its book on each of them is traced in event loss estimates, minute by minute. This page is about whether to believe them.
Who publishes industry loss estimates?
Real-time industry loss estimates in the U.S. are published by private firms: catastrophe modelling companies issue ranges, and a commercial industry index publishes estimates that many contracts reference. We found no federal agency that publishes a real-time insured loss figure for an event, and the one federal series that tracked disaster costs after each event has stopped.
That series, NOAA's billion-dollar weather and climate disasters, was itself built partly from the industry index. Its archive lists among its inputs "the Insurance Services Office (ISO) Property Claim Services (PCS), Federal Emergency Management Agency (FEMA) National Flood Insurance Program (NFIP)" data, and it carries no updates after 2024. What reinsurers can use in its place, and the limits of each source, is set out in the guide to NOAA's retired billion-dollar series.
Public bodies publish other numbers that matter after a U.S. hurricane. Florida's Office of Insurance Regulation runs a catastrophe data call after a major storm and publishes aggregated claim counts and reported losses; the Florida Hurricane Catastrophe Fund publishes its own projected losses by storm. Neither is an industry estimate in the market's sense, and both arrive later, but they are reported by the insurers themselves, which no model output is.
Why do cat model estimates differ?
Catastrophe model estimates differ because the models disagree about hazard, vulnerability and how to treat the same exposure, and because the people running them make different choices. The NAIC's catastrophe modelling primer is direct about it: two models fed the same exposure can give materially different answers, because their data specifications and assumptions differ (NAIC primer). How that spread shows up in a cedant's PML is traced number by number in a companion guide.
The choices are visible in what regulators ask. Florida's catastrophe reporting form asks each insurer which model and version produced its event estimate and whether three settings were switched on: long-term event rates, demand surge and storm surge (Form CRF-26A). Demand surge, the rise in repair costs after a large event, and surge flooding are each large enough to move an estimate materially, and both are switches. Two estimates for the same storm can differ simply because one firm left a switch off.
"These variations and uncertainties often motivate companies to use model settings that best suit their books of business, adjust the modeled output, or combine the results from multiple models, producing a range of outcomes tailored to their specific needs."
NAIC, Catastrophe Modeling Primer, 2025
Uncertainty also depends on the peril. NOAA's own researchers, quantifying the error around the federal disaster cost estimates in a paper in Natural Hazards, found that "drought and flooding events have higher potential uncertainty values around their loss estimates due to less coverage of insured assets", while severe local storms carried less, because wind and hail damage is well insured. The same logic applies to a hurricane estimate: the wind share is measured by claims, the surge and flood share partly guessed.
How accurate are early hurricane loss estimates?
We found no public body that publishes a comparison of first industry estimates against final losses, so a reinsurer cannot look up how accurate early hurricane estimates have been. What public data does show is how long the final number takes. The Florida Hurricane Catastrophe Fund, which reimburses Florida residential insurers above a retention, was still paying and re-projecting Hurricane Ian more than three years after its September 2022 landfall.
Paid against projected at Florida's hurricane fund, years after landfall
Two lessons follow for the second line. The first is that the number used for a loss pick in week one will be revised for years, so the pick must say which estimate it rests on. The second is that a layered program sees development late: Milton's projected fund loss was $1.5 billion fifteen months after landfall, yet only $11 million had been paid, because losses reach an upper layer only after everything below it is paid. A reinsurer's high layers behave the same way.
The sample event gives the shape of the early weeks. From the first modeller midpoint of $22.0 billion to the index's $38.0 billion the industry figure rose 73%; the reinsurer's gross rose from $147.7 million to $286.7 million, because layers are thresholds and several were crossed. Early error is therefore amplified in a catastrophe book, not averaged out.
The second line's questions, with the evidence for each
A chief risk officer or model risk team testing an event loss pick should ask the eight questions in the table at the top of this page, and each has a piece of evidence that answers it. The questions are not about whether the model is good; they are about whether the pick is explained, current and inside the contracts.
Worked on the sample event, the first three take a minute each when the evidence exists. Which estimate led: the industry index's first release of $38.0 billion, published at 07:10 on day four, under a written order that puts the index first once it publishes. How wide the range: the last modeller range ran from $30 billion to $39 billion, so the index sat near its top, and the pick moved $28.8 million from the interim figure signed at the $34.5 billion midpoint. What would move it: Gulfstar Mutual's fifth layer attaches at $37.9 billion and exhausts at $51.7 billion, and the industry loss warranty triggers at $40.0 billion, so a resurvey of a few billion dollars upward changes both the reinsurer's loss and what it recovers.
The fourth question has a regulatory echo. Florida asks insurers for the model and version behind their event estimates, so a reinsurer whose cedants file those numbers will be asked the same question by its own committee. The seventh is the one most often missed in a spreadsheet, because the event definition lives in the wording and not in the model.
Which estimate should a reinsurer use?
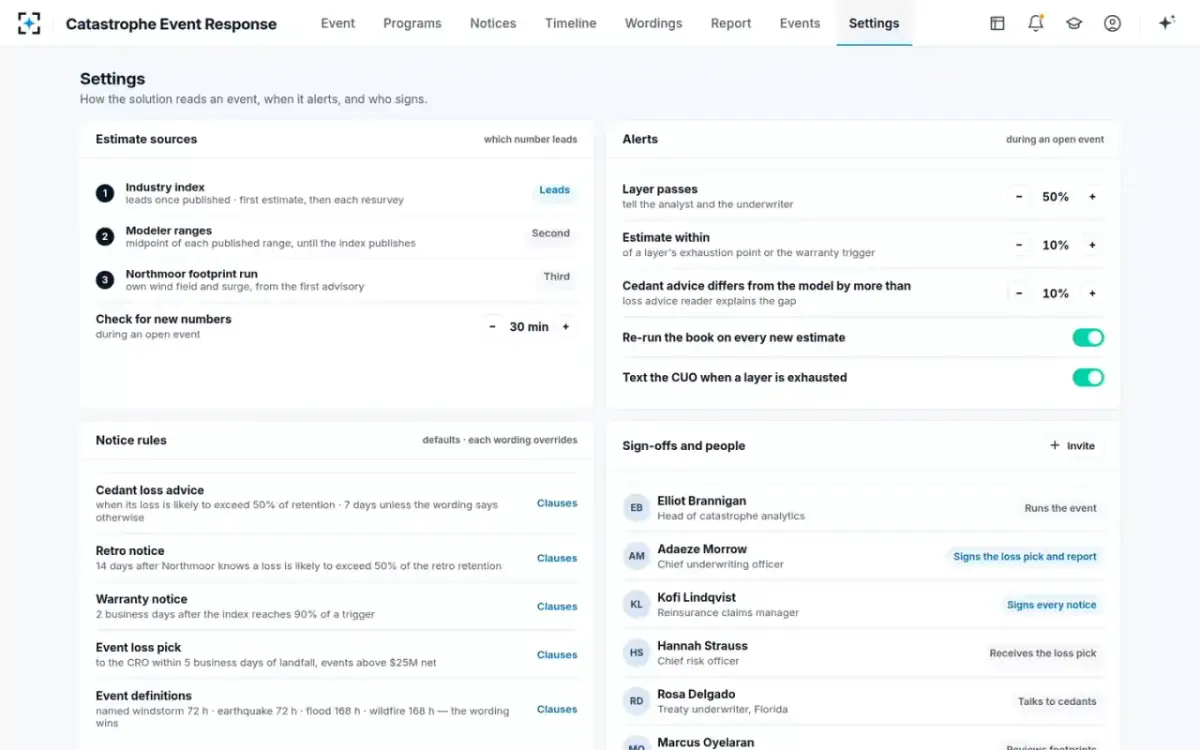
A reinsurer should use the estimate its contracts settle on for anything index-linked, and a written, ordered choice for everything else, named in each pick. There is no right answer for all events, but there is a wrong process: switching sources without saying so. The sample reinsurer's order is the industry index once published, then the midpoint of modeller ranges, then its own footprint run, which leads only until the first modeller publishes.
The industry index and your own footprint run, compared as event estimates
Industry index estimate: Days after landfall; in the sample event, day four.
Your own footprint run: From the first advisory, refreshed with each new footprint.
Industry index estimate: Insured loss to the whole market, from reported and surveyed data.
Your own footprint run: Modelled loss to your cedants’ exposure, from your wind field and surge.
Industry index estimate: Industry loss warranties and index-triggered covers.
Your own footprint run: Nothing directly; it informs indemnity reserves.
Industry index estimate: Late, revised by resurvey, and not your book.
Your own footprint run: Only as good as your footprint and your cedants’ files.
Industry index estimate: Lead once published; reconcile to it.
Your own footprint run: Lead until others publish; keep as an independent check.
The order of estimates, written down as a setting in Catastrophe Event Response
How is model risk governed for an event estimate?
Model risk for an event estimate is governed like any other model use: an owner, documented inputs and choices, independent challenge, and a trail that lets the result be reproduced. What is different after a catastrophe is the speed: the inputs change daily, so the trail has to be kept as the work happens, not written up afterwards.
Three controls do most of the work. Version every input, so that each run is tied to one estimate, one footprint version, one exposure file and one set of treaty terms; the solution never mixes footprint versions inside a run for this reason. Keep the arithmetic open, so a reviewer can follow any layer from the industry figure to the reinsurer's share. And separate proposal from decision: the agents propose the pick and draft the report, and a named executive signs it. How supervisors describe these expectations for models and AI in insurance is covered in what supervisors expect of AI catastrophe modeling.
What the sample reinsurer's day-four pick rested on
1
estimate: the industry index first release, $38.0bn
v4
footprint: wind field and surge, built 07:05
40
layers priced on one set of treaty terms, each with its arithmetic
7
sources cited in the event report sent for signature
When the pick is revisited
An event loss pick should be revisited on written triggers rather than when someone remembers, and the triggers should be about the contracts, not only the industry number. A 5% move in the industry figure that crosses no layer may change little; a 2% move that exhausts a layer changes the reinsurance premium, the retro recovery and possibly a notice.
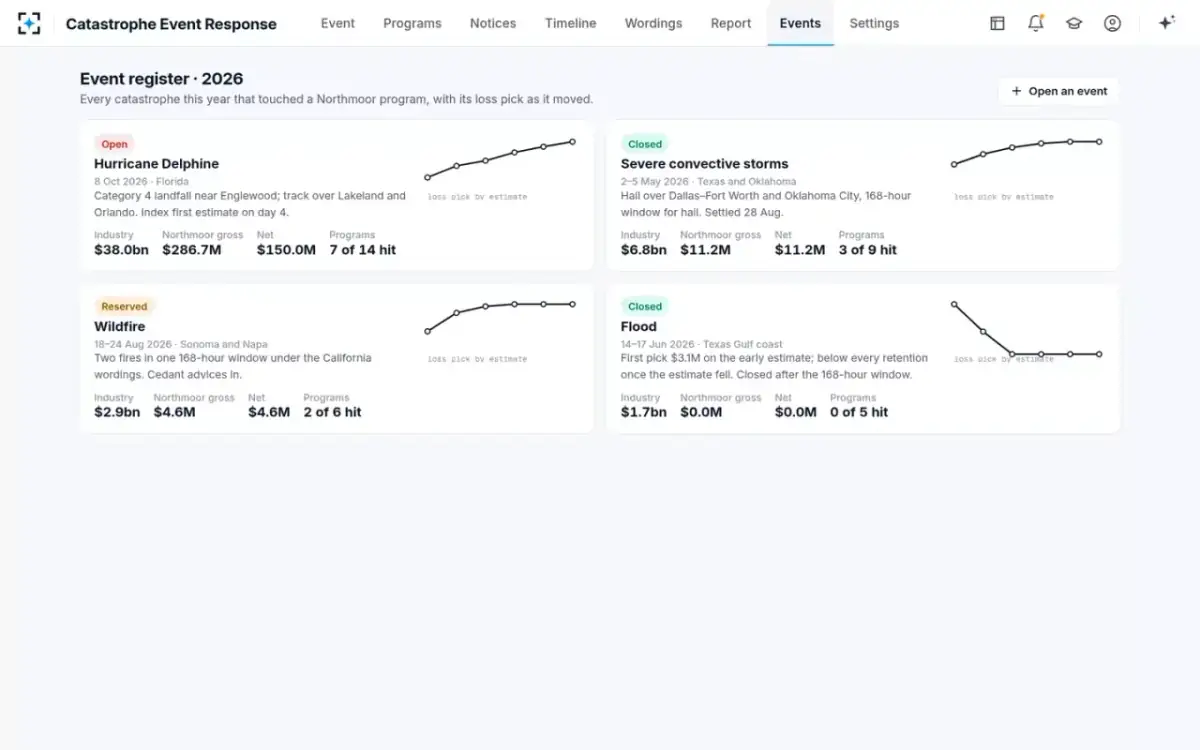
The sample reinsurer's triggers are: a re-run on every new estimate; an alert when an estimate comes within 10% of a layer's exhaustion point or the warranty trigger; an alert when a layer passes 50%; a text to the chief underwriting officer when a layer is exhausted; and an explanation whenever a cedant's advice differs from the model by more than 10%. Each revision is signed. In the event register, every 2026 event carries its pick as it moved by estimate, which is what a second-line reviewer needs to see the drift.
Every 2026 event and how its loss pick moved, in Catastrophe Event Response
Revisiting also has an end. Florida's hurricane fund asks for quarterly updated loss reports until it commutes a storm, which can be five years after the contract year ends; a reinsurer's event pick will be overtaken by cedant advices and paid claims long before that. The practical rule is to keep revisiting the industry figure until the cedants' own numbers are better, and then to say so.
Questions people ask
What is an industry loss warranty?
An industry loss warranty is a contract that pays a fixed amount when an industry loss index for a defined event and territory passes a trigger. The sample reinsurer's is a $50 million Florida wind warranty with a $40 billion trigger. Treasury's Federal Insurance Office, citing industry trackers, estimated ILW capacity at $4 to $6 billion in 2025.
Why is the industry loss estimate different from my company's model?
Because it measures something else: insured loss to the whole market from reported and surveyed claims, while your model measures loss to your exposure on your assumptions. The NAIC notes that model results can vary significantly even with the same exposure data, so a gap is expected; what matters is that it is explained.
How long until the final loss for a hurricane is known?
Years, for the upper layers. Florida's hurricane fund was still projecting Hurricane Ian's losses more than three years after landfall, and its reimbursement contract allows final loss reports up to 60 months after the end of the contract year.
Do regulators check insurers' event estimates?
Some collect them. Florida's catastrophe reporting form asks insurers for gross and net event estimates, the reinsurance-covered amount, and the model, version and settings used, with a model output attached to the first filing. That makes the estimate a document a regulator can compare over time.
Should a reinsurer average several industry estimates?
Averaging is one defensible choice if it is written down in advance; the NAIC primer notes that companies combine results from multiple models to produce a range. The risk is switching methods mid-event without saying so, which makes successive picks impossible to compare.