Event loss estimates are a reinsurer's working figures for what one catastrophe will cost it: the ground-up loss to each cedant in the footprint, the share of that loss reaching each layer of each program, the reinsurer's line on it, and the result net of its own retrocession. They start from an outside number, a modeller's published range or an industry index estimate, and every time that number moves the whole book has to be re-priced. Doing that in spreadsheets takes a night per estimate, which is how a reinsurer's own figures fall a day behind the industry's. Botminds' Catastrophe Event Response is an agentic solution that re-prices every program and layer when a new estimate lands, reads each wording's event definition, and drafts the notices the new number triggers, while the loss pick and every notice stay with named people.
The trace on this page follows the solution's sample event: Hurricane Delphine, a fictional Category 4 storm that made landfall near Englewood, Florida, at 02:15 on Thursday 8 October, as it runs through Northmoor Re, a fictional reinsurer with 14 Florida programs and 40 layers. Names, figures and timestamps from the event are sample data, not a customer result.
Thirty minutes from a new estimate to a reviewed report: the agents take four of them
- Agents re-run the book07:10 to 07:14
- Head of catastrophe analytics reviews the run and the drafted report07:14 to 07:40
- Release copied in; exposure re-match started; layers and retro not yet re-pricedstill running at 07:40
What is an event loss estimate?
An event loss estimate is a point figure, with a range around it, for the loss one catastrophe will cause to a defined book: an industry, an insurer, a program or a reinsurer's share of a layer. For a reinsurer it has three levels. The industry figure says how big the event is; the program figure says how much of it each cedant carries; the layer figure says how much reaches the reinsurer, after retentions, limits, lines, reinstatements and the event's hours.
Regulators treat an event estimate as a model output with a version, not as an opinion. After a Florida hurricane, the Office of Insurance Regulation's catastrophe reporting form asks each insurer for its estimated loss gross of reinsurance, its projected net retention and the amount covered by reinsurance, and adds: "For the first template only, attach a model output for the company's book of business for this event." It also asks which model and version produced the number and whether demand surge, storm surge and long-term settings were switched on. A reinsurer's own estimate deserves the same discipline, because the next one will be compared with it.
The cedant's gross, net and ceded figures have to add up. The same form says the gross estimate must equal the projected net retention plus the amount covered by reinsurance, so a cedant's estimate is already a statement about its reinsurers' layers. When the cedant and the reinsurer use different estimates, the first conversation of the week is about which one is right.
How do reinsurers estimate event losses?
Reinsurers estimate event losses in one of two ways, and the two can be run side by side. The first starts from an industry figure and applies each cedant's share of it, worked out from the cedant's exposure inside the footprint. The second runs the reinsurer's own footprint, a wind field and surge model of the actual storm, directly against each cedant's exposure. The first is fast and consistent with how industry-indexed contracts settle; the second is independent of anyone else's number and available from the first advisory.
A third route sits between them. A catastrophe model's simulated storms carry their losses to the reinsurer's own portfolio; the NAIC's primer describes the output as "an event loss table or a year loss table with a list of simulated events and associated loss amounts." Picking the simulated storms whose track and intensity sit nearest the real one gives a quick range before any footprint exists. It is a sense check, not an estimate, because no simulated storm is the real one and the table was built on last renewal's exposure.
Either way the arithmetic is the same once a ground-up loss exists for a program. In the sample, Gulfstar Mutual's 61,240 insured locations inside the footprint make it 2.90% of the industry loss, so at the index's $38.0 billion its ground-up loss is $1,102 million. Its tower of six layers above a $100 million retention then decides what reaches Northmoor.
Then a different kind of input arrives, and it matters most: the cedants' own loss advices. They are counts and reserves from real claims, not model output, and they arrive on the clocks the wordings set. The first advice in the sample event came on day two. Comparing them with the model, and explaining any gap over 10%, is the part of the work that starts to replace modelled numbers with observed ones. Which outside number should lead until then, and how the second line should test it, is the subject of industry loss estimates and the questions a CRO asks.
07:10 on day four: the industry estimate lands
At 07:10 on Monday 12 October the industry index published its first estimate for Delphine, $38.0 billion. Until then the sample reinsurer had been working from modeller ranges, most recently a midpoint of $34.5 billion, and had signed an interim loss pick the evening before. The new figure was 10% higher, and it moved several layers across their exhaustion points.
Catastrophe Event Response at 07:12: the footprint, one program's layers, and every estimate since landfall
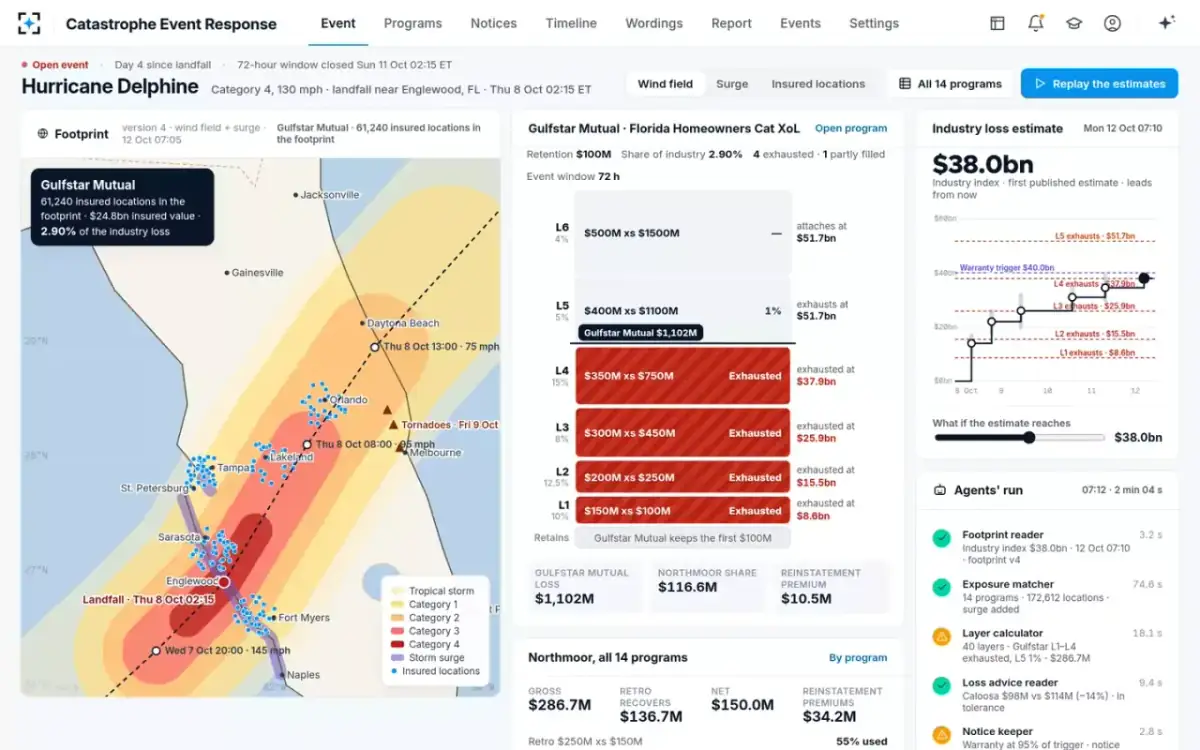
The footprint reader picked the release up on its scheduled check. During an open event it looks at the advisory feed, the modellers and the industry index every 30 minutes, and it is read-only on what it finds: it versions a published estimate but never edits one. At 07:12 the run began, on one estimate and one footprint version, because the solution never mixes footprint versions inside a run.
Step by step: what each agent in Catastrophe Event Response does, and what it may not do
Six agents ran in sequence in 2 minutes and 4 seconds. Each has a written limit, and the limits are the point: the run produces a proposal, drafts and a report, and nothing in it is booked, sent or signed.
One new estimate through Catastrophe Event Response: six agents propose, three people decide
Agent
Footprint readerReads the $38.0bn index release, versions it, and fixes the run to footprint version 4, wind field and surge.
Never: Edits a published estimate, or mixes footprint versions in one run
Agent
Exposure matcherRe-overlays 172,612 insured locations across 14 programs and sets each cedant’s share of the industry loss.
Never: Changes a cedant’s file; it flags exposure older than the last renewal
Agent
Layer calculatorApplies retention, limit, Northmoor’s line, reinstatements and the event definition to 40 layers, and nets the retrocession.
Never: Books a reserve; it proposes the event loss pick
Agent
Loss advice readerMatches each cedant advice to its program and event window and explains any gap over 10% from the model.
Never: Edits a cedant figure
Agent
Notice keeperFinds the industry loss warranty at 95% of its $40.0bn trigger and drafts the notice its Clause 6 requires.
Never: Sends anything; the claims manager signs
Agent
Report writerRebuilds the management event report at $38.0bn and cites every figure to its estimate, footprint, exposure file or clause.
Never: Issues the report; it is a draft until the CUO signs
A person decides
Head of catastrophe analyticsReviews the run and the draft at 07:40, and decides whether the index leads.
A person decides
Reinsurance claims managerReads, edits if needed, signs and sends the warranty notice and the cedant chasers.
A person decides
Chief underwriting officerSigns the event loss pick with a password and the meaning of the signature.
The exposure matcher is the slowest step, because it touches every location. The layer calculator is the one with the most consequence, because it turns a share of an industry number into money on 40 layers and then nets the retrocession: at $38.0 billion, Northmoor's gross across the book is $286.7 million, its $250 million excess of $150 million retrocession recovers $136.7 million, and the net is $150.0 million before $34.2 million of reinstatement premiums due to it.
The notice keeper's output is the easiest to overlook and the costliest to miss. The index reaching $38.0 billion put Northmoor's industry loss warranty at 95% of its $40 billion trigger, and the warranty's Clause 6 asks for notice within two business days once the reported index reaches 90% of the trigger. The draft was ready for the claims manager within minutes of the release.
One layer's arithmetic, shown in full
Every figure the layer calculator produces can be opened and checked, because an event loss estimate that cannot be traced will not survive the risk committee. The table below is Gulfstar's fourth layer, $350 million excess of $750 million, at the index estimate.
Gulfstar Mutual, Layer 4, at the $38.0bn index estimate: five lines of arithmetic
| Step | Formula | Result |
|---|---|---|
| Ground-up loss | industry estimate × share of industry: $38.0bn × 2.90% | $1,102M |
| Loss to the layer | min(limit, max(0, ground-up − attachment)): min($350M, $1,102M − $750M) | $350.0M, exhausted |
| Reinsurer’s share | layer loss × line: $350.0M × 15% | $52.5M |
| Reinstatement premium | layer loss ÷ limit × 5.5% rate on line × limit × line | $2.9M |
| Exhaustion point | (attachment + limit) ÷ share of industry: $1,100M ÷ 2.90% | $37.9bn industry |
The same arithmetic on screen, with the inputs it used
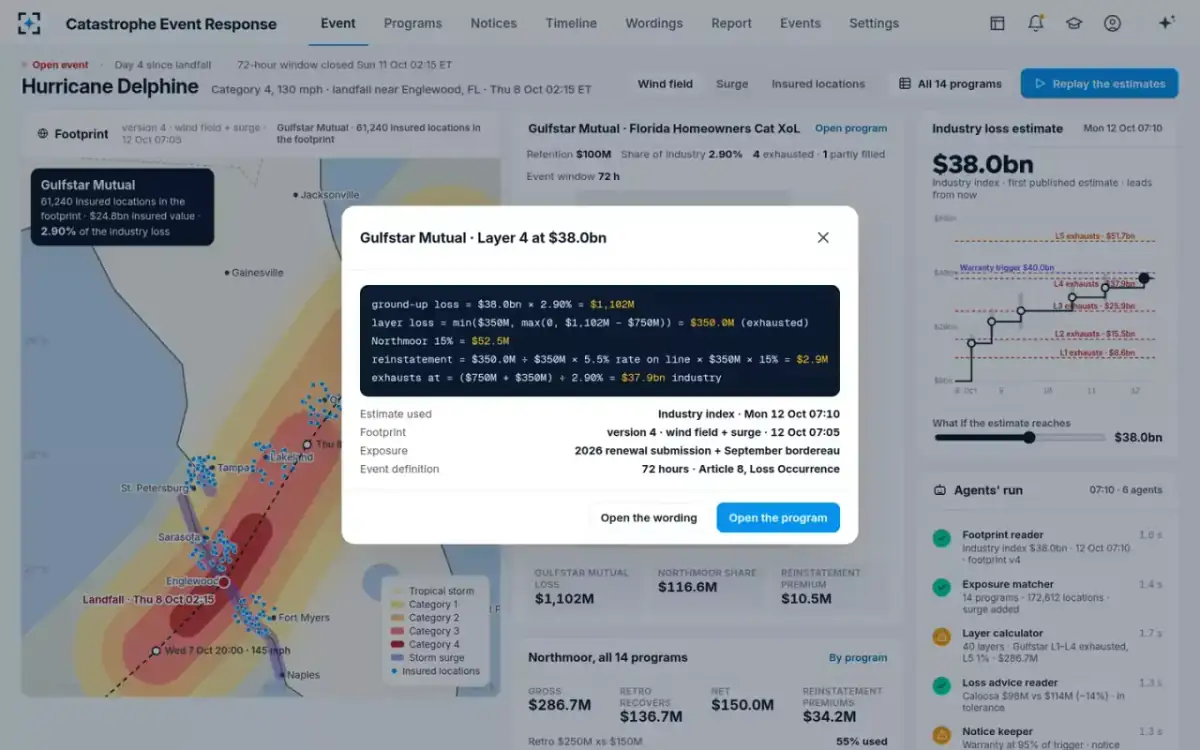
The exhaustion point is the line a chief underwriting officer reads first. It says that this layer was always going to be full once the industry passed $37.9 billion, and it lets the underwriter answer a cedant's question, whether the next layer is in play, with a number: Gulfstar's fifth layer attaches at $37.9 billion and exhausts at $51.7 billion. How a reinstatement like this one is priced, and why few cat treaties reinstate pro rata as to time, is worked through in one hurricane through a property catastrophe excess of loss book.
The event definition is part of the estimate
An event loss estimate is only as right as its idea of what counts as the event, and that idea is written in each wording, not in the model. The wordings in the sample book, like the treaty the English Court of Appeal construed in Unipol v Covéa in 2024, limit one loss occurrence to a period of consecutive hours whose start the reinsured may choose, and they differ in the length, in when the clock may start and in which perils count. The same storm can therefore put different losses into different programs.
The sample event shows three ways it happens. Gulfstar's wording counts losses in any 72 consecutive hours and includes storm surge with the windstorm. Palmetto Shore agreed 96 hours at its last renewal and chose a start of 22:00 on Wednesday 7 October, so its window runs to 22:00 on Sunday and takes in the Brevard County tornadoes and late surge claims as one event, under one retention. Sabal Specialty's commercial wording excludes flood but includes storm surge, which decides how its Tampa Bay claims are read. Nine wordings sit behind the sample book; five differ from the reinsurer's own standard.
An estimate that applies one house default to every program will be wrong in exactly the programs that negotiated something different. That is why the solution reads event definitions from each signed wording before the season and lets the wording override the defaults of 72 hours for named windstorm and earthquake and 168 hours for flood and wildfire. The run on day four used Gulfstar's 72 hours from Article 8, and the layer panel says so.
How fast can a reinsurer estimate a hurricane loss?
A reinsurer can have a first estimate by program within hours of landfall from its own footprint, and a re-priced book within minutes of each industry release if the arithmetic is automated. By hand, on the sample team's own account, the same re-pricing takes a night per estimate. The binding constraint is not computation but inputs: a footprint good enough to trust, exposure current enough to match, and wordings read before the storm.
The solution's design target is a first loss view by program and layer within one day of landfall; the sample re-run of 14 programs and 40 layers took 2 minutes 4 seconds. The comparison below is for the two hours after an estimate lands, not the whole event.
The two hours after a new industry estimate, by spreadsheet and in Catastrophe Event Response
By spreadsheet: Someone sees the release in an email and copies it into the model sheet.
With the agents: Picked up on the next 30-minute check and versioned with its time and source.
By spreadsheet: Re-matched program by program; last week’s file reused where the new one is not in.
With the agents: All 14 programs re-matched on one footprint version; stale files flagged, not used silently.
By spreadsheet: Each tower recalculated; the retrocession netted last, if there is time.
With the agents: 40 layers and the retro netted in the same run, every figure with its arithmetic.
By spreadsheet: Noticed when someone remembers the warranty trigger.
With the agents: The warranty notice drafted the minute the index passed 90% of the trigger.
By spreadsheet: Rewritten the next day from the new spreadsheet.
With the agents: Rebuilt at 07:13 with each figure cited, for review at 07:40.
Why the number moved six times in four days
The number moved because each source knew more than the last. Delphine's first published figure, $14.0 billion, came on landfall day. Modeller ranges followed, then a footprint with surge added on day two, then a revised modeller range, and on day four the industry index. Each one is a different method on more information, and each moved the reinsurer's gross.
Six industry estimates for one storm in four days, and what each did to the reinsurer's gross
Two things in that series matter for how a reinsurer works. The first is that the gross moved faster than the industry number, because layers are thresholds: the industry figure rose 73% from the first modeller midpoint to the index, and Northmoor's gross almost doubled. The second is that the retrocession behaved like a switch. At $22.0 billion the retro recovered nothing; at $38.0 billion it recovered $136.7 million.
An earlier estimate, replayed: at $22.0bn the retrocession recovers nothing
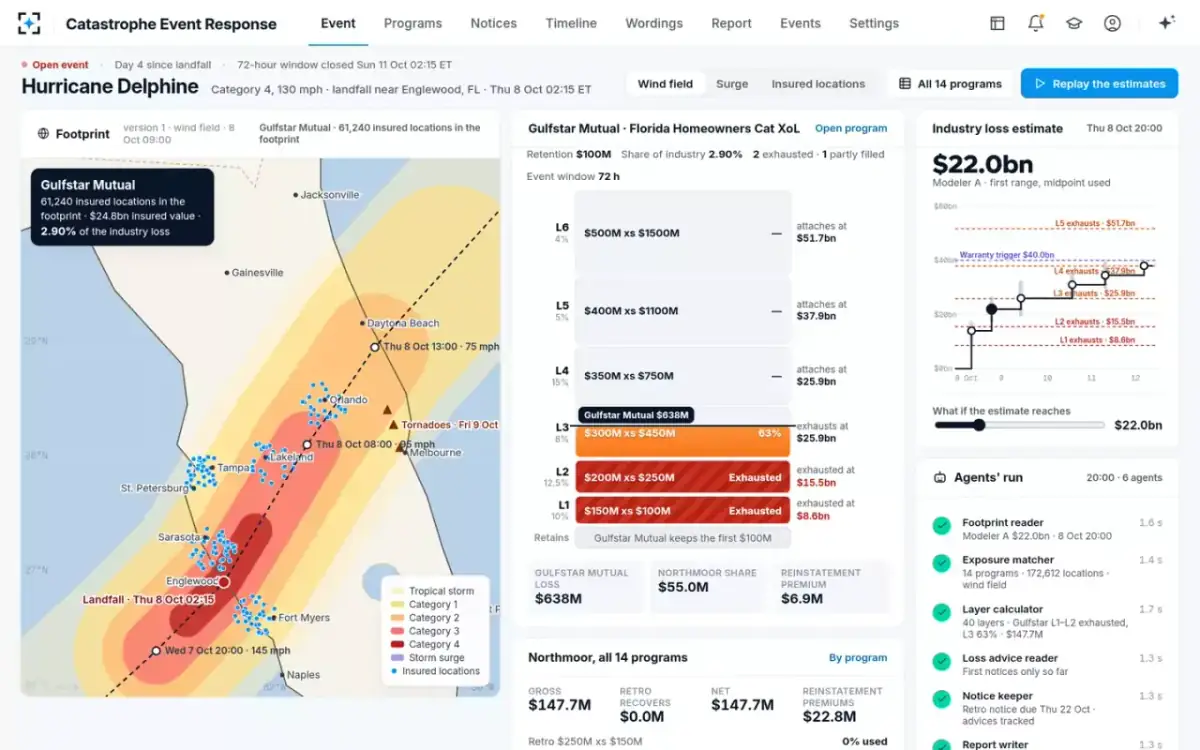
Even the last number is not final. The National Hurricane Center's post-storm Tropical Cyclone Reports, published later, carry the "post-analysis best track (six-hourly positions and intensities)", and an industry index can resurvey for months. An estimate that cannot be replayed on the inputs it used becomes impossible to explain once those later numbers arrive. What each day's wait for a settled number costs, in reserves, recoveries and collateral, is set out in the loss pick after a catastrophe.
What stays with people: the pick, the notices, the choice of estimate
The loss pick, every notice, and the choice of which estimate leads stay with people, and the solution is built so that it cannot be otherwise. The agents propose the pick and draft the notices; the chief underwriting officer signs the pick, the reinsurance claims manager signs every notice, and in the sample setup a reserve change over $25 million needs both the CUO and the chief risk officer.
That is also where supervisors and most surveyed firms have landed. In the Bank of England and FCA's 2026 survey of UK financial services firms, 80% of respondents had AI agents in production that recommend actions while humans decide and execute, and only 2% had deployed agents with broad autonomy. EIOPA's opinion on AI governance lists human oversight among the areas insurers should cover, alongside data governance, documentation and explainability, scaled to the risk of the use (EIOPA-BoS-25-360).
There is also a practical reason. An event loss pick goes to a risk committee and, in parts, to retrocessionaires, warranty counterparties and rating agencies. Each of those parties needs a person who can say why the number is what it is, and which estimate, footprint and wording it rests on. The agents make that answer quick to give; they cannot give it.
Questions people ask
What is the difference between an event loss estimate and an industry loss estimate?
An industry loss estimate is one figure for the insured loss to the whole market from one event, published by a modeller or an index. An event loss estimate is a company's own figure for its book, usually built by taking its share of the industry figure or running its own footprint against its exposure, then applying its contract terms.
What is an event loss table?
An event loss table is a catastrophe model's list of simulated events with the loss each would cause to a given portfolio. The NAIC's primer describes it as a list of simulated events and associated loss amounts, produced at levels from county to individual location. It describes possible events; an event loss estimate describes one that happened.
How often do hurricane loss estimates change?
Often in the first week and occasionally for months after. In the sample event six published figures arrived in four days, from $14.0 billion to $38.0 billion, and an industry index can resurvey after its first estimate as claims are reported.
Who decides the reserve after a catastrophe at a reinsurer?
A named executive, commonly the chief underwriting officer or a reserving committee, signs the event loss pick, and the reserve follows it. In the sample setup the agents propose the pick and the CUO signs it, and any reserve change over $25 million needs the chief risk officer's signature as well.
What does gross of reinsurance mean in an event estimate?
It means the loss before any reinsurance recovery. Florida's regulator asks insurers for the gross estimate, the projected net retention and the amount covered by reinsurance, and requires the gross to equal the other two added together.