NOAA's billion-dollar weather and climate disasters series counted every U.S. event that caused at least $1 billion of direct losses, adjusted for inflation, from 1980 to 2024, and it has stopped. NOAA's satellite and information service announced that the product "will be retired, with no updates beyond calendar year 2024", and the data centre that ran it says it ceased supporting it in May 2025. The archive stays online: 403 events and about $2.9 trillion of losses in 2024 dollars. For catastrophe analysts, reinsurers and students who used it to show how disaster losses have grown, the question is what it measured, what it did not, and what can stand in. Botminds' Catastrophe Event Response, an agentic solution for a reinsurer's work after each event, keeps one answer close to home: the company's own register of events and how each loss pick moved.
The figures on this page are from NOAA's archived dataset, our arithmetic on it, and the public bodies named beside each. Where the guide shows the solution, it uses its sample events, which are fictional sample data.
Billion-dollar disasters per year, averaged by period, and their yearly cost
Is NOAA still tracking billion-dollar disasters?
No. NOAA stopped tracking billion-dollar disasters after calendar year 2024, and no 2025 or 2026 figures will be published in the series. The National Centers for Environmental Information, which produced it, states on the dataset's archive page that it "ceased providing support for this product in May 2025 in response to an initiative to implement reductions within the U.S. federal government." The archive lists its update frequency as not planned.
What remains is a complete, citable archive of 1980 to 2024. NOAA's notice says all past reports and their underlying data remain authoritative and archived, and the event file can still be downloaded from NCEI's archive under its DOI. A chart of billion-dollar disasters by year can therefore still be drawn, but it ends in 2024, and any trend line that runs past that year is someone else's estimate.
How many billion-dollar disasters were there?
The series lists 403 billion-dollar disasters in the United States from 1980 to 2024, with total losses of $2,917 billion in 2024 dollars and 16,918 deaths. The count rose decade by decade, from about three events a year in the 1980s to 23 a year in 2020–2024, and the costs rose with it. The two highest counts are its last two years: 27 events in 2023 and 27 in 2024.
NOAA's billion-dollar disasters series, as archived
403
U.S. events from 1980 to 2024 with at least $1bn of direct losses
$2.9tn
total losses, CPI-adjusted to 2024 dollars
27
events in 2023, and again in 2024: the highest counts in the series
2024
the last year it will ever include
The costliest single year was 2017, with 19 events and $395.9 billion in 2024 dollars, the year of Harvey, Irma and Maria. In 2024 the 27 events cost $182.7 billion, and two Florida hurricanes, Helene at $78.7 billion and Milton at $34.3 billion, made up most of it. The costliest single event in the archive is Hurricane Katrina in 2005, at $201.3 billion; Ian in 2022 is third, at $119.6 billion.
The rising count has more than one cause, and the series does not separate them. More assets in exposed places raise losses even if hazards stay the same, and the $1 billion threshold is fixed in inflation-adjusted dollars, so the same storm on a richer coast crosses it more easily. Any change in hazard comes on top of that. The NAIC's catastrophe modelling primer, which reproduces the series with caveats, notes that "The National Hurricane Center (NHC), reinsurance industry, and catastrophe modelers all use the NCEI’s data by integrating the NCEI’s findings into their assessments". Those users now have a gap from 2025.
What the series measured, and what it did not
The series measured total direct losses, insured and uninsured: damage to homes, businesses and public buildings and their contents, business interruption, vehicles and boats, offshore platforms, public infrastructure and agricultural assets. By its authors' own description it left out losses to natural capital, healthcare costs and values for loss of life, and it never measured insured losses on their own or any event below the threshold. That makes it a different number from the industry loss estimates a reinsurer uses after an event, and comparing the two directly is a common mistake.
It was also built largely from insurance data. NOAA's own method, set out by its researchers in a peer-reviewed paper in Natural Hazards, takes insured loss payments and scales them up to total losses: "insured loss payment data ($) are inflated by a factor representing the reciprocal of the insurance market participation rate for a specific type of insurance for each impacted state." The inputs named on its archive page include the commercial industry loss index, the federal flood program's claims, federal disaster assistance and agricultural loss data. The series was, in part, a public re-use of numbers the insurance market already produced.
Its uncertainty differed by peril. The same research ran Monte Carlo simulations around three events to put confidence intervals on the estimates, and found the total for Hurricane Ike most sensitive to assumptions about commercial insurance participation in Texas. Flood and drought, where insurance covers less, carry wider uncertainty than wind and hail, where it covers more. A trend built on the series inherits those differences.
Why did NOAA stop the billion dollar disasters database?
NOAA stopped the database as part of reductions across the U.S. federal government, according to its own archive page, which gives that as the reason it ceased supporting the product in May 2025. The NESDIS notice of change lists the product as retired and points users to the archived reports and data. Neither page gives any further reason, and neither proposes a federal replacement.
"All past reports, spanning 1980-2024, and their underlying data remain authoritative, archived, and available"
NOAA NESDIS, notice of changes, Billion Dollar Weather and Climate Disasters
Which perils drove the cost
Hurricanes drove the cost; severe storms drove the count. Tropical cyclones were 67 of the 403 events, about one in six, but 53% of the total losses. Severe local storms, hail, tornado and straight-line wind, were half of all events and 18% of the losses. For a property catastrophe reinsurer that split is the familiar one: a few hurricanes set the year, and many convective storms fill the retentions underneath.
Share of NOAA's 403 billion-dollar disasters, by number and by cost
By number of events, 1980–2024
- Severe storms · 50%
- Tropical cyclones · 17%
- Flood and drought · 19%
- Wildfire, winter storm, freeze · 14%
By cost, 1980–2024, in 2024 dollars
- Tropical cyclones · 53%
- Severe storms · 18%
- Flood and drought · 19%
- Wildfire, winter storm, freeze · 10%
The last year shows the same pattern. Of the 27 events in 2024, 17 were severe storms and five were tropical cyclones, yet the tropical cyclones accounted for about two-thirds of the year's $182.7 billion. A reinsurer's own event history can look the same in miniature: in the solution's fictional sample year, a spring convective outbreak cost the sample reinsurer $11.2 million, while one autumn hurricane cost it $286.7 million gross.
How to use the archive now without misleading anyone
The archive is still the best public long series of U.S. disaster costs, and it can be used honestly if four limits are stated with it. Each limit is one that a careful reader, or a regulator, will raise.
First, say that it stops. A chart that ends in 2024 is accurate; a chart that splices a 2025 point from another source onto it mixes two methods, because no other source scales insured losses to total losses the way NOAA did. Second, say that it measures total direct losses, not insured losses, so it cannot be compared with an industry loss estimate or with a reinsurer's own loss without a conversion the series never published. Third, say that the threshold is in inflation-adjusted dollars, not adjusted for growth in exposure, so part of the rising count is more property in harm's way rather than more or worse events. Fourth, cite the archived version and its DOI, so a reader can find exactly the data used; the event file has been revised more than once, and the archive keeps 21 versions.
Used that way, the series still answers the questions it was built for: how often U.S. weather and climate events cross a high loss threshold, which perils drive the cost, and how both changed over 45 years. It cannot answer the question a reinsurer faces after the next storm, which is what that storm costs its own book, and it never could.
Where can I find disaster loss data after 2024?
No single public source replaces the series. After 2024 a U.S. analyst has to assemble disaster loss data from several bodies, each measuring something narrower: European supervisors for global totals, Florida's regulator and hurricane fund for Florida storms, the National Hurricane Center for each hurricane's track and damage, and the company's own claims and contracts for everything specific to its book.
Public sources a reinsurer can use after NOAA's series, and the limit of each
| Source | What it gives | The limit to state |
|---|---|---|
| NOAA NCEI archive, 1980–2024 | Every U.S. billion-dollar event with total losses and deaths | Ends in 2024; total, not insured, losses |
| EIOPA Financial Stability Report | Global natural catastrophe losses and the insured share, each year | EIOPA restates an industry estimate; not U.S.-specific |
| Florida OIR catastrophe claims data | Claims and reported losses for a Florida storm, from insurers’ filings | Florida only; insurer-reported and revised over time |
| Florida Hurricane Catastrophe Fund reports | Projected and paid fund losses by hurricane | Residential, above insurers’ retentions, Florida only |
| NHC Tropical Cyclone Reports | Track, intensity and damage for each storm, after the season | Physical event, with damage noted, not insured loss |
| Your own event register | Your loss pick for each event, as it moved, and why | Your book only; as good as what you kept |
Each source answers a different question. Florida's Office of Insurance Regulation runs a catastrophe data call after a major storm and publishes aggregated claims, which is the closest public thing to an insured loss count for a Florida event. The hurricane fund publishes its own projected losses by storm in its annual report, and Ian's were still being revised at the end of 2025. The National Hurricane Center's Tropical Cyclone Reports give each storm's best track and a note of damages. How a reinsurer should weigh those against the market's industry estimates is the subject of industry loss estimates and the CRO's questions.
What were insured catastrophe losses in 2025?
The most recent figure from a public supervisor puts global natural catastrophe losses in 2025 at about USD 224 billion, with roughly 48% insured. It comes from EIOPA's June 2026 Financial Stability Report, which restates a reinsurer's published estimate: "Globally, losses from natural disasters declined by 39% to approximately USD 224 bn (EUR 190.6 bn) in 2025, with the insured share being around 48%." The same report puts 2024 at USD 368 billion, North America at 86.1% of 2025's insured losses, and the Los Angeles wildfires at almost 40% of them.
For U.S. hurricanes, 2025 was quiet at landfall. Florida's hurricane fund reported that the season produced 13 named storms and five major hurricanes, yet "Florida and the continental United States were spared and no hurricanes made landfall for the first time since 2015." Severe convective storms, wildfires and floods carried the North American year instead, in EIOPA's account.
Europe's gap is wider and better measured. EIOPA and the European Stability Mechanism, proposing an EU-wide catastrophe pool in April 2026, wrote that Europe's protection gap had in the past "left around 75% of economic losses from natural catastrophes uninsured". We found no U.S. federal body that now publishes a comparable annual figure.
What data do reinsurers use for cat trends now?
Reinsurers now build catastrophe trends from three kinds of data: commercial industry loss indices and modelling firms, which they already licensed; public bodies' narrower series, such as Florida's regulator and hurricane fund; and their own event history, which is the only source that measures their book. The NOAA series was a free, consistent backdrop for the first two. Its end makes the third more important.
A useful event history holds more than the final loss. It holds every estimate the company priced on, every pick it signed, when each moved, and why: the footprint version, the exposure file and the wording behind each number. Florida's regulator already collects part of this from insurers, through the fourth stage of its annual reinsurance data call, which gathers data reporting the impact of storms on insurers' reinsurance contracts. A reinsurer that keeps the same detail for its own book has a trend series no federal budget can retire.
A company's own catastrophe series: the event register in Catastrophe Event Response
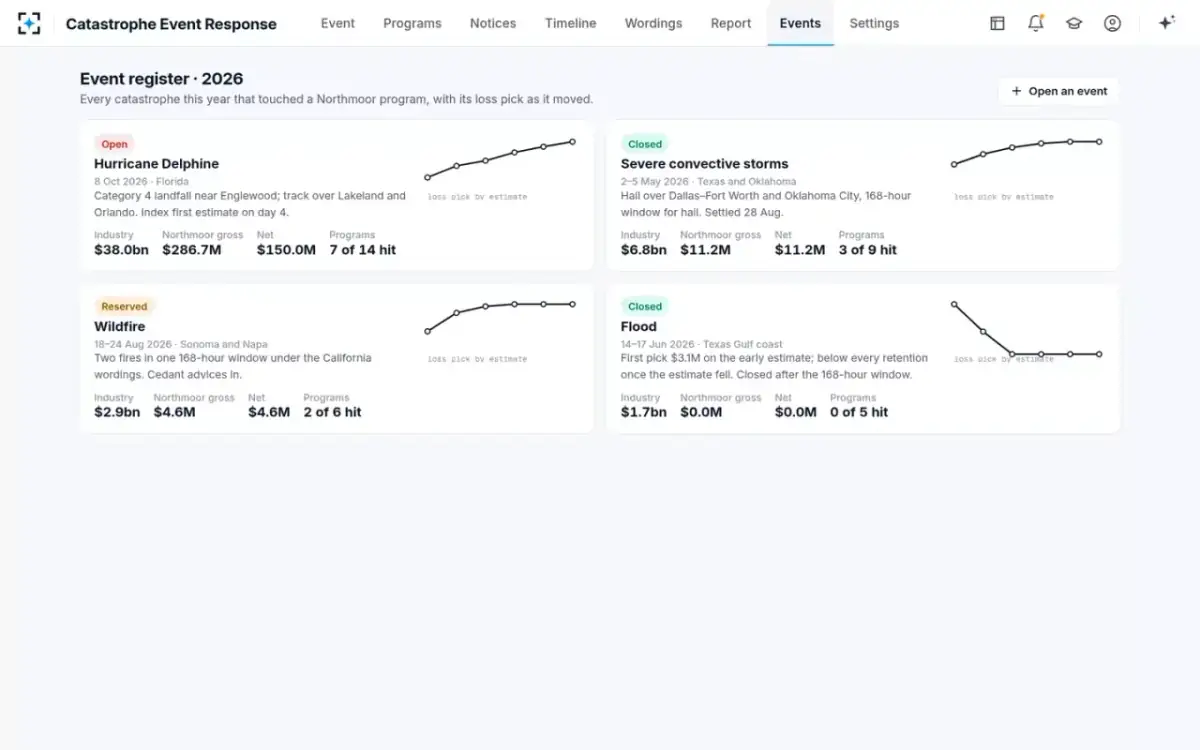
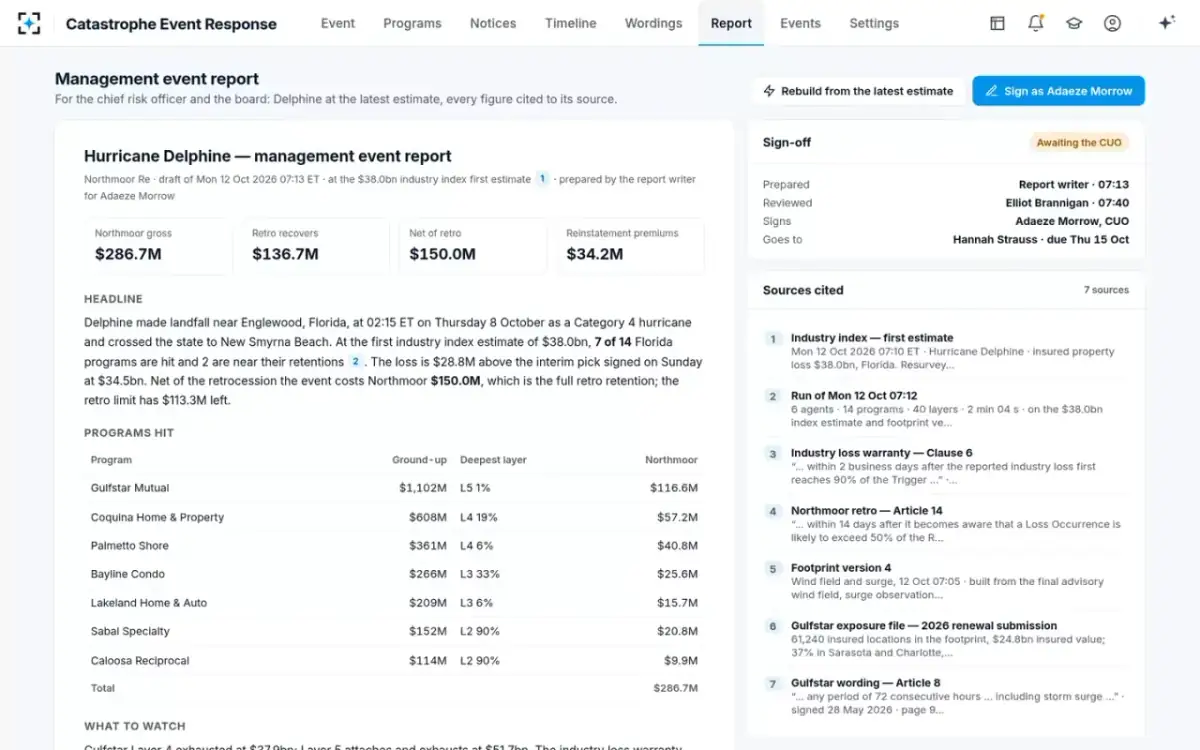
Each event in that register also carries the documents behind it. In the solution, the management event report for every event cites each figure to its estimate, footprint, exposure file or clause, so a figure from three seasons ago can still be explained. The same habit makes the Florida fund's later reports usable: they arrive quarterly for years, as the FHCF reimbursement contract guide sets out, and a company that kept its own picks can compare them.
What Catastrophe Event Response keeps for each event: a cited report
Questions people ask
Is the NOAA billion-dollar disasters data still available?
Yes, for 1980 to 2024. The reports and the event file are archived at NOAA's National Centers for Environmental Information under DOI 10.25921/stkw-7w73, and NOAA describes them as remaining authoritative. No later years will be added.
Were NOAA's billion-dollar figures insured losses?
No. They were total direct losses, insured and uninsured, estimated largely by scaling up insured loss data by insurance participation rates. Insured losses for the same events are lower, and for flood and drought much lower.
How many billion-dollar disasters were there in 2024?
Twenty-seven, with total losses of $182.7 billion, according to NOAA's archived data. Seventeen were severe storms and five were tropical cyclones, including Helene and Milton in Florida.
What was the costliest year in the series?
2017, with 19 events and $395.9 billion of losses in 2024 dollars, driven by Hurricanes Harvey, Irma and Maria. The costliest single event was Hurricane Katrina in 2005, at $201.3 billion.
Is there a billion-dollar disaster count for 2025?
Not from NOAA. EIOPA's June 2026 report, restating a reinsurer's estimate, puts global natural catastrophe losses in 2025 at about USD 224 billion with roughly 48% insured, but no U.S. federal agency publishes a 2025 count on NOAA's method.