A tail factor selection tool should do three jobs: compute the candidate tails by more than one method, record which one the actuary chose and why, and keep all of it beside the selected factor so the choice can be checked and re-run later. Most tools do the first and leave the other two to a memo and a spreadsheet. That is backwards for the tail, which the CAS Tail Factor Working Party describes as having "a highly leveraged impact on loss development since they form a portion of the loss development of all accident years analyzed" (CAS Tail Factor Working Party, The Estimation of Loss Development Tail Factors: A Summary Report, 2013). This guide sets out what to keep beside a tail factor, how the methods compare, what to test before buying, and where Botminds' Actuarial Assumption Management fits: it does not fit curves, but it keeps every tail linked to its cell, memo paragraph, data and decision, and re-runs the selected method when new triangles load.
One ten-year paid triangle, eleven indicated tails: why the method has to be kept with the factor
What is a tail factor in reserving?
A tail factor is the development factor that carries losses from the oldest age in the triangle to ultimate. When the data runs out while the factors are still above 1.000, the actuary "will need to determine a tail factor to bring the claims from the latest observable development period to an ultimate value", in the words of the CAS study note on reserving, which labels it "120-Ultimate" or "To Ult" (Friedland, Estimating Unpaid Claims Using Basic Techniques, CAS). For short-tailed property lines it is often 1.000. For long-tailed liability lines, the study note observes, some claims can take more than fifteen years to settle, and the tail can be material.
The working party adds a second reason the tail is hard: tail development "reflects development occurring after the last development period in the reserving data triangle and is therefore somewhat more difficult to estimate than the various link ratios developed from the data triangle". The pick with the least observed data is also the one applied to every accident year.
How sensitive are reserves to the tail factor?
Very, because the tail multiplies every accident year's projection. A tail of 1.12 instead of 1.10 raises every year's ultimate by about 1.8%, from the oldest year to the newest. The study note's warning is blunt: "The tail factor is crucial as it influences the unpaid claim estimate for all accident years (in the experience period) and can create a disproportionate leverage on the total estimated unpaid claims."
The direct effect on the oldest years is simple to price. Take a fictional insurer's commercial lines book as it runs through Actuarial Assumption Management: its general liability occurrence tail of 1.12 applies to $209.4 million of losses already beyond 120 months on the June 2026 data. Each 0.01 in the tail is about $2.1 million of IBNR on those losses alone. When the selected method's indication moved from 1.123 to 1.145, the reserve effect on those losses was about $4.7 million. ASOP No. 43 asks the actuary to weigh how sensitive the estimate is to reasonable alternatives (ASOP No. 43, section 3.6.2), and for a tail the alternatives in the chart above are a ready list.
What methods are used to estimate tail factors?
The working party surveyed the CAS literature, rating bureaus, insurers and consultants and grouped the methods into families: Bondy-type methods; algebraic methods relating paid and incurred losses, such as Sherman-Boor; methods based on benchmark data; curve-fitting methods such as exponential decay, McClenahan, Skurnick, Sherman's inverse power curve, Pipia and England-Verrall; methods based on remaining open claim counts; methods based on the peculiarities of the remaining open claims, including a claim-by-claim judgment estimate; and a handful of others.
Each family rests on a different assumption about how development decays, which is why the results in the chart spread so widely. On curve fits the working party is direct: "all curve-fitting methods make some very significant assumptions as to how development factors will decay", it is wise to compare several, considering bias in "(1) the choice of the function, (2) actual points used in the fit and, (3) estimation of parameters", and "the user is cautioned to not just use them blindly". Its conclusion declines to name a winner: "The most appropriate approach for a given analysis is likely to depend on the circumstances of the analysis."
Can you use industry benchmarks for tail factors?
Yes, with care and with the edition noted. The working party notes that "Many actuaries review benchmark data when selecting a tail factor", from rating bureaus, reinsurance association studies and annual statement data, and that benchmarks "can serve a useful function, especially in the small-to-medium credibility situations". The condition follows in the same paragraph.
"One must be careful, though, to make sure that either the benchmark data is a good match for the book of business being analyzed, or that appropriate adjustments are applied either to the benchmark data or the book of business being analyzed."
CAS Tail Factor Working Party, 2013, section 4.7
One benchmark gets a specific warning. Tails inferred from the IBNR the industry has booked on its oldest years rely on that IBNR being adequate, and "history has shown that this figure has often been inadequate", which "would suggest that tail factors based on this method would be understated". The modeling standard points the same way: industry experience is a fallback to the company's own experience, used when that is not available or reliable enough, and "properly modified" to the circumstances (ASOP No. 56, section 3.1.6). A benchmark tail kept beside the factor therefore needs three things: the source, the edition, and the adjustment.
How do you select a tail factor?
Compute it more than one way, decide which assumptions fit the book, weight or choose, and write down why. In practice that often means a company curve fit and an adjusted industry benchmark, weighted by credibility and by what the actuary knows about the claims still open. The study note quotes Joseph Thorne's 1978 caution, still apt: "Care must be taken in projecting the tail from older accident years to recent accident years." Changes in claims handling, mix or the legal environment can make an old year's tail a poor guide to a new one.
Here is the selection in the sample, from the year-end 2023 memo: the company's triangles indicated 1.094 by an inverse power curve fitted to ages 48 to 120, but the last three diagonals showed case reserve strengthening on 2014–2016 construction defect claims the fit did not yet reflect, so the industry tail of 1.138 got two-thirds weight, giving 1.123, rounded to 1.12. That is a good selection paragraph. Whether case reserves are adequate in the first place is a claims question; the guide on case reserve adequacy covers it. What the tail selection needs is the record of what was seen and what it did to the weights.
A tail factor with everything kept beside it: cell, inputs, weights, memo, data and decision
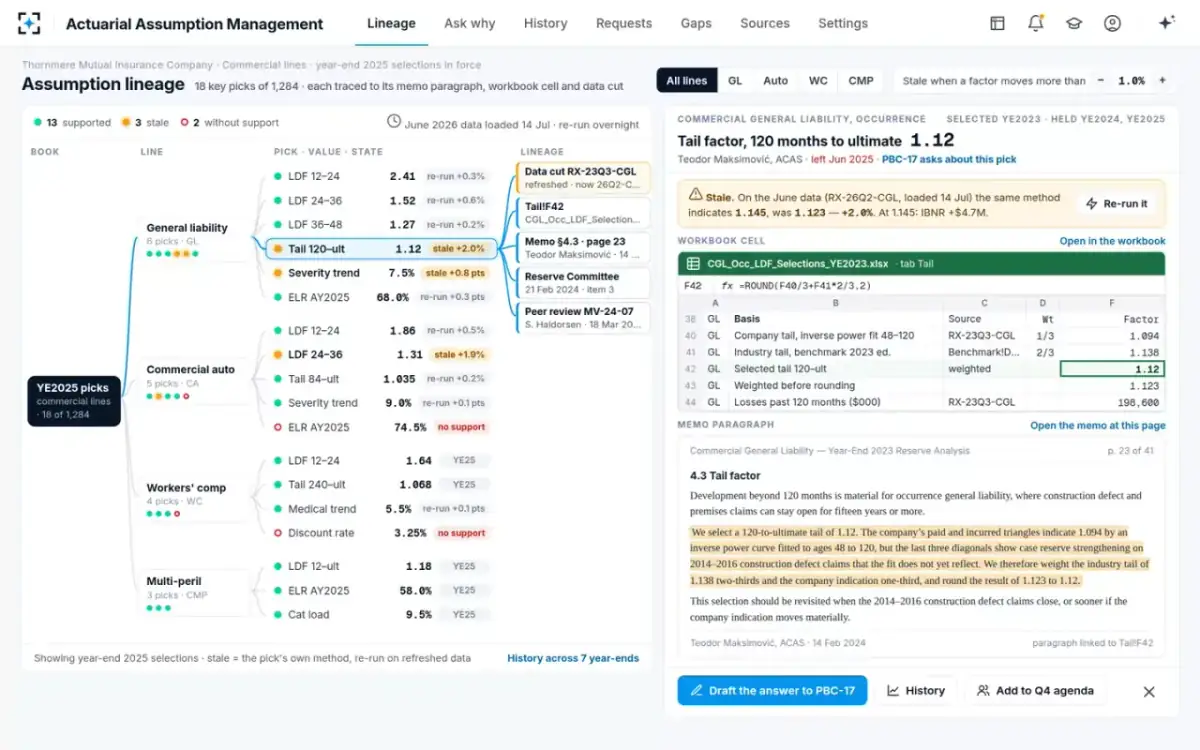
What to keep beside a tail factor
Everything a reviewer would need to re-perform the selection and a successor would need to update it. The list is longer than for any other pick because the tail has the most alternatives and the least data.
What a tail factor selection tool should keep beside the factor
- Every method computed, with its result
Not only the one selected: a reviewer needs the spread to judge the choice.
- The fit’s ages and points
Which ages the curve was fitted to and which points were excluded, since the result depends on both.
- Each benchmark’s source, edition and adjustment
Which publication, which year, and how it was adapted to the book.
- The weights and the formula
The cell that combines them, at the workbook version the memo used.
- The written reason
What the actuary saw in the triangle or the open claims that set the weights.
- The sensitivity
The reserve effect of the main alternatives, on the losses the tail applies to.
- The data cut and its valuation date
So the indication can be recomputed on the same numbers.
- The decision and the review
Committee acceptance and any peer review or model validation finding.
- The reopening condition
What should make someone look again, written at selection time.
- A re-run on each data refresh
The same method and weights on new data, with the move and its reserve effect.
What should a tail factor selection tool do?
Two kinds of product answer the search. Fitting tools, inside reserving software or as spreadsheet templates such as the Excel companion the working party published, compute candidate tails. Support tools keep what was selected and why. A reserving team needs both, and should know which it is buying.
A tail fitting tool and a tool that keeps the tail's support
Tail fitting tool: Yes: curve fits, Bondy-type, benchmarks
Tool that keeps the support (Actuarial Assumption Management): No; reads the fits your workbook computed
Tail fitting tool: Sometimes, as a field
Tool that keeps the support (Actuarial Assumption Management): Links the selected cell at the signed version
Tail fitting tool: Rarely; the memo lives elsewhere
Tool that keeps the support (Actuarial Assumption Management): Links the memo paragraph to the cell
Tail fitting tool: No
Tool that keeps the support (Actuarial Assumption Management): Links committee minutes and peer review notes
Tail fitting tool: Each analysis stands alone
Tool that keeps the support (Actuarial Assumption Management): Matches the same tail across years, selected against indicated
Tail fitting tool: Refit when someone runs it
Tool that keeps the support (Actuarial Assumption Management): Re-runs the selected method and weights on each refresh; flags a move past the threshold
Tail fitting tool: Exports exhibits
Tool that keeps the support (Actuarial Assumption Management): Drafts a cited answer for the appointed actuary to sign
Tail fitting tool: If the user selects a new one
Tool that keeps the support (Actuarial Assumption Management): Never: a re-selection is a person’s decision
Questions to ask before buying a tail factor selection tool
A demonstration on clean data shows the fitting. The questions below test the keeping, on your own triangles and files, which is where a tail selection is actually challenged.
Questions for a tail factor selection tool, and what a good answer looks like
| Question | Why it matters | A good answer |
|---|---|---|
| Which tail methods does it compute, and can I see all of them for one segment at once? | The spread is the evidence for the choice | At least a curve fit, a Bondy-type method and an adjusted benchmark, side by side |
| Does it record the fit’s ages and excluded points? | Results move with the points used | Stored with the result, not just the output factor |
| How does it hold a benchmark? | Benchmarks are republished and editions differ | Source, edition and adjustment stored with the value |
| Where does the reason live? | Regulators ask for a descriptive rationale | Linked to the factor, not in a separate folder |
| What happens at the next data refresh? | Held tails go stale silently | The selected method and weights are re-run and the move reported |
| Can it show this tail for every past year-end? | Holds and drifts only show over time | Selected against indicated, year by year, with who chose it |
| Can anything in it change a selected factor without a person? | Responsibility must stay with a named actuary | No, and the setting is locked |
NAIC regulators supply the standard the last three answers must meet. They expect appointed actuaries to support each assumption with a described reason rather than a label, and in a roll-forward to make clear why ultimate selections changed (NAIC Actuarial Opinion (C) Working Group, 2026 Regulatory Guidance). A tool that cannot show the reason or the history leaves the actuary to rebuild both under deadline. The broader case for tools that cite rather than write is made in AI for actuarial documentation.
When should a tail factor be revisited?
When its own reopening condition is met, when a benchmark it weights is republished, and whenever new diagonals move its selected method past a threshold set in advance. A calendar review alone misses the holds. In the sample, the tail selected at 1.12 when the method indicated 1.123 was held at the next two year-ends with "no change; see YE2023 memo §4.3" and "consistent with the prior year", while the same method indicated 1.134 and then 1.139. The memo's own condition, to revisit when the construction defect claims close or the company indication moves materially, was never checked against the data.
The selected method, re-run on new triangles: the move, the reserve effect, the pick unchanged
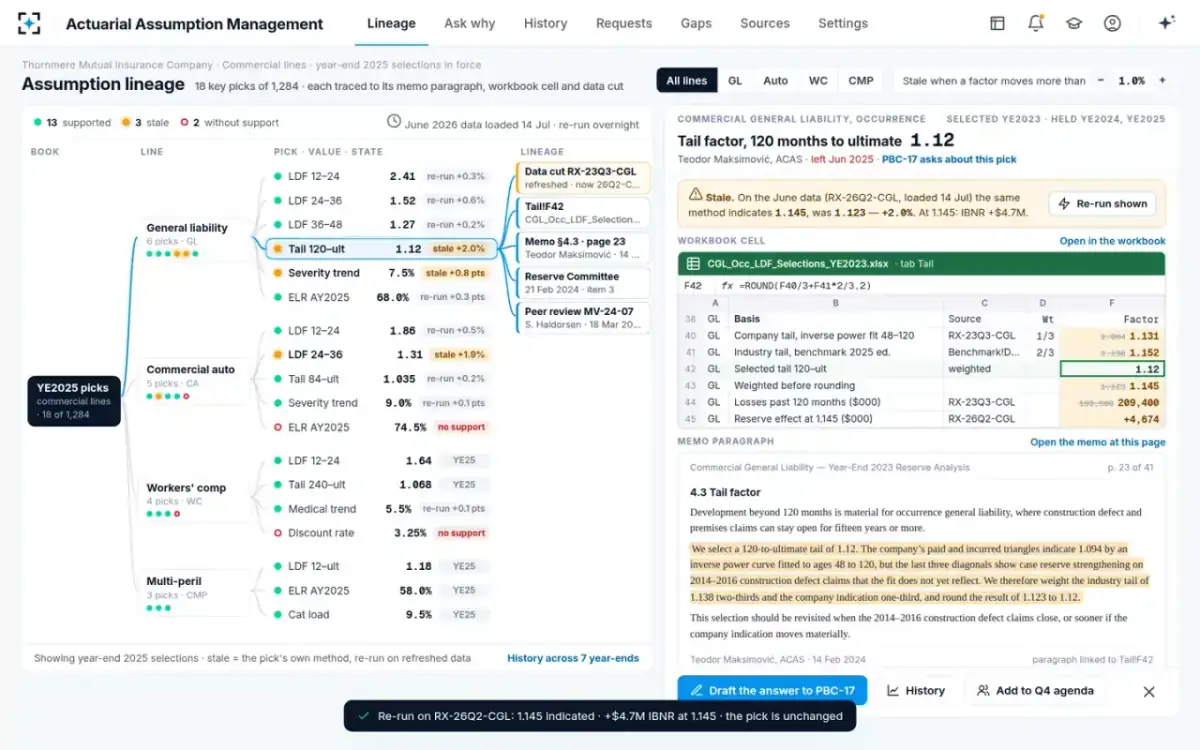
Where Actuarial Assumption Management fits beside your tail tools
It fits beside whatever computes your tails. Its agents read the selection workbook at every saved version and the memo by paragraph, link the tail to its cell, inputs, weights, data cut, committee minute and peer review, and match it across year-ends. When triangles or a benchmark refresh, the selected method is re-run with its original weights, and a move past the threshold, 1.0% by default for factors, marks the tail stale with its reserve effect. When an auditor asks why the tail is what it is, the answer is drafted from those sources, one claim per sentence, each cited, for the appointed actuary to sign. The full trace of one tail, from cell to signed note, is in the guide on the PBC request list for the reserve audit.
It does not fit curves, compute Bondy or benchmark tails, or tell you which method is right; that is your reserving tool and your actuaries. It never selects or changes a tail. And it cannot keep what was never written: if the reason for a weight exists only in someone's memory, the tool reports a gap and drafts a request to the line's owner. For the memo that should carry that reason, see the actuarial memo template for a reserve selection.
Questions people ask
What is a typical tail factor for general liability?
There is no single figure; it depends on the line, the data age where the tail starts, paid or incurred, and the company's claims practice. On one ten-year paid triangle, the CAS Tail Factor Working Party's methods ranged from 1.025 to 1.137, which is why the method and its inputs need to be kept with any selected value.
Is the inverse power curve the best tail method?
No method is best in general. The working party called Sherman's inverse power curve "a welcome improvement" over methods that all assume exponential decay, but cautioned that every curve fit makes significant assumptions about how development decays, and concluded the right approach depends on the circumstances.
Should paid and incurred tails be selected separately?
Usually they are, because they develop differently, and the pair should be consistent. One approach the CAS study note describes uses the ratio of reported to paid losses at the latest age to set a paid tail when reported development is considered complete. Either way, the relationship between the two should be written down.
Does a tail factor need its own sensitivity disclosure?
Where reasonable alternatives would materially change the estimate, ASOP 43 asks the actuary to tell the principal and discuss the effect. For a long-tailed line the tail is often the selection where that test is met, so stating the reserve effect of the main alternatives in the memo is good practice.
Can a tail factor be below 1.000?
Yes, for lines where recoveries after payment, such as salvage and subrogation, bring cumulative losses down at late ages. The CAS study note notes that development factors may then approach 1.000 from below. The documentation needs are the same.