Insurance companies total cars more easily today because fixing a car has become dearer much faster than the cars themselves have gained value. From January 2020 to September 2026 the US consumer price index for motor vehicle maintenance and repair rose 56%, against 36% for used cars and trucks (BLS repair index; BLS used-car index; our arithmetic). Since January 2022 the gap has opened fastest: repair up 44%, used cars down 12%. A total loss is a ratio of repair cost to the car's value, so when the top of the ratio climbs and the bottom stalls, more crashes cross the line where paying for the car is cheaper than fixing it, including crashes that leave the car driveable.
A total loss does not end at that decision. The insurer still has to agree a value the owner accepts, pay off the lender, collect the title, obtain a salvage title, report the car to the federal title system and sell the wreck, while a storage yard bills by the day. Botminds' Total Loss Claims Management was built for that stretch: specialist agents read the documents, build the value, chase payoffs and titles and price every day of storage, and people approve every payment, letter, move and sale. This page is about the trend that keeps filling that stretch.
Repair prices have outrun used-car prices since 2020, and the gap keeps widening
How many car insurance claims are total losses? No public count, one clear direction
No regulator or research body publishes a national share of auto claims that end in a total loss. The percentages that circulate come from industry data firms counting the claims that pass through their own systems, and they count different things, so they rarely agree. Insurers do report each total to the federal title system every month (28 CFR §25.55), but that register is a title-history check, not a published rate.
The public evidence measures the ratio's two halves instead, and both point the same way. The repair half comes from the Bureau of Labor Statistics, whose repair index rose in every one of the years charted above. IIHS reads the same data as "the average price of vehicle repairs has risen more than 40% since 2020" (IIHS-HLDI, 2026). The value half is the used-car index, which ended September 2026 below where it stood in January 2022.
The size of the claims themselves tells the same story. The Highway Loss Data Institute, the nonprofit that gathers and publishes insurers' loss data, found that 2.7% of collision claims on cars cost more than $20,000 in 2017 (HLDI, 2018). In 2024, 8.5% cost $20,000 or more, by our arithmetic from its table (HLDI, 2025). The amounts are not adjusted for inflation, which is part of the point: claims have moved up the price range faster than the cars they are paid on.
Collision claims have moved up the price range: one in twelve now tops $20,000
Collision claims by amount paid, 2017
- Under $3,000 · 51.6%
- $3,000–9,999 · 36.4%
- $10,000–19,999 · 9.3%
- $20,000+ · 2.7%
Collision claims by amount paid, 2024
- Under $3,000 · 31%
- $3,000–9,999 · 43.9%
- $10,000–19,999 · 16.6%
- $20,000+ · 8.5%
Why are so many cars being totaled? Dearer repairs, stalled values, bigger claims
Because the cost of repairing a car has risen faster than the value of the cars being crashed. Every state's test, whether a fixed percentage or a formula, compares those two numbers, and since 2020 they have moved in opposite directions for most of the period.
Repairs cost more
The repair index rose 56% between January 2020 and September 2026, and 44% of that came after January 2022. Part of the climb is technology. In one HLDI comparison of otherwise identical 2017–22 model year vehicles with and without driver assistance features, it found collision claim severity "about 10% higher for the equipped vehicles", even though those cars filed about 10% fewer collision claims (IIHS-HLDI, 2026). Its explanation cuts both ways: "the sensors are expensive and often require calibration after replacement", and the systems prevent many of the low-speed fender benders that used to keep the average claim down. A bumper that once needed a cover and paint may now carry radar and a camera.
Car values have stalled
Used-car prices did the opposite. They jumped 55% between January 2020 and January 2022, which for a while worked the other way and kept more damaged cars on the repair side of the line. Since then they have fallen 12% while repairs kept rising; by January 2024 the two indexes stood level against their 2020 base, and repair has led since. A car that is worth less meets a repair bill that costs more.
The claims that arrive are bigger
Over half of collision claims cost less than $3,000 in 2017; by 2024 about 30% did, and HLDI notes that "only 5% of claims cost $25,000 or more" while those claims took 23.8% of collision dollars (HLDI, 2025). Some of that shift is inflation and some is fewer small crashes reaching insurers. Either way, the average file on a collision desk is now a more expensive one, and the expensive files are the ones that end in a total.
A crash that cost 65% of a car’s value to fix in 2020 now reaches New York’s 75% line
The indexes hide the mechanism, so take one rule. Under New York's 75% trigger, a crash that cost 65% of the car's value to repair at January 2020 prices costs about 75% at September 2026 prices, before the car has aged a day. That car has crossed from "repair" to "total" without its owner noticing anything except the letter. Most totals still come from worse crashes than that, but the line has moved down into crashes that used to be routine repairs, and it moves furthest on older, cheaper cars, where the same repair is a larger share of a smaller value.
Are older cars more likely to be totaled? The same repair is a bigger share
Yes: the repair bill depends on the parts and labour, not on the car's age, while the value it is measured against falls every year. Take one $6,000 repair, the same bumper, sensor and paint on two cars of one model. On a car worth $20,000 it is 30% of value, nowhere near any state's line. On the same model five years older, worth $8,000, it is 75%, and in New York that is a total (our arithmetic against 11 NYCRR 216.7).
The trend above compounds the age effect rather than replacing it. An owner keeps a car longer, it loses value each year, and the repair price for the parts it carries rises with the repair index. A car that was a comfortable repair at four years old can be a total at eight from an identical crash. That is why disputes cluster on older, still-running cars: the owner sees a sound car and a modest dent, and the insurer sees a ratio.
Formula states sharpen it further. Under a total loss formula the expected salvage proceeds are added to the repair cost, so the test becomes repair plus salvage against value. A newer wreck with sought-after parts fetches more at auction, which pushes the left side up; an older wreck fetches less, but its value has fallen faster still. Take a fictional sample file through Total Loss Claims Management: a 2019 Honda CR-V with a $19,840 repair estimate and a projected salvage of $5,100 crossed a value of $21,503 by more than $3,000.
Why do insurance companies total cars with little damage, or cars that still drive?
Because the test is money, not mobility or how the damage looks. Texas's Office of Public Insurance Counsel puts it in one line: a total loss "means that your vehicle costs more to fix than to replace" (OPIC). A seven-year-old car with a crumpled corner can run perfectly and still cost more to repair than the insurer would pay for the whole car, and as the ratio above shifts, more of those cars go to auction rather than to a body shop.
"Little damage" is usually a misreading of where the cost sits. A front corner that looks cosmetic can hide a bumper-mounted radar unit, parking sensors and the camera's mounting, each replaced and then calibrated, which is the severity effect HLDI measured above. On a new car that bill is a repair. On a car worth a third as much, the identical bill is a total, and the owner, who sees only the dent, reads it as the insurer being quick to write the car off.
The driveable total is where the trend reaches the owner most sharply. The owner of an older car that still runs sees a modest repair and a payment that may not buy a similar car. That is where disputes start. "Auto total loss" was one of the ten biggest complaint topics at Massachusetts' insurance regulator in 2025, with 127 complaints among the 2,167 it closed (Massachusetts Division of Insurance). In the UK, the Financial Conduct Authority found that "some firms reported average settlement values that were lower than the available guide prices" (FCA, 2024). How the value of a totaled car is built, comparable by comparable, is the subject of how a total loss value is calculated.
Where is the line? Percentage thresholds and the total loss formula
States draw it in one of two ways: a fixed percentage of the car's value, or a formula that adds the wreck's salvage value to the repair cost and compares the sum with the car's value. Under either, the adjuster is weighing the same three numbers: the repair estimate, what the car was worth just before the crash, and what the wreck will fetch.
The fixed lines vary in more than the number. Texas defines a salvage vehicle as one whose repair cost "exceeds the actual cash value of the motor vehicle immediately before the damage", leaving repainting materials and sales tax out of the repair cost (§501.091). New York sets 75%: above it, an owner who keeps the car must hand the insurer the title, and the car is branded "REBUILT SALVAGE" (11 NYCRR 216.7). Florida's 80% applies to uninsured vehicles; for insured ones a car is a total when the insurer pays to replace it (§319.30). Iowa raised its line from 50% to 70% in 2021, which many published lists still miss (Iowa DOT). The full state table is in the total loss rules that change by state.
Either way the line is a ratio, and a ratio does not care which side moved. When repair prices rise 56% and used-car prices 36%, both methods total more cars without a single statute changing.
What one more total loss costs after the decision
A repair claim ends, roughly, when the car leaves the shop. A total loss starts a second piece of work in which almost every step waits on someone outside the insurer: the owner, the lender, the state and the auction. Each extra total adds all of it.
What one more total puts on the desk after the decision
- A value the owner can check
Built from two or more comparable cars in the local market within 90 days, with taxes and fees, and every deduction itemized “as to dollar amount” (NAIC Model 902).
- A lender to pay off
Often for more than the car is worth: 11.6% of auto loans in 2018–22 rolled in negative equity, and those loans averaged 119.3% of the car’s value (CFPB).
- A title to collect
From the owner, the lender, or both, before the car can change hands; in New York a 75% repair estimate requires it even when the owner keeps the car.
- A salvage title to obtain
If the title never comes, a Texas insurer can apply for one in its own name only from the 30th day after payment, after at least two written notices (Tex. Transp. Code §501.0925).
- A federal report to file
Insurers report total losses on current and four prior model years to the National Motor Vehicle Title Information System every month (28 CFR §25.55).
- A storage bill running
The yard bills for every day the car waits; in Texas a licensed storage facility may charge up to $22.85 a day for a car (TDLR).
- A reopen window
35 days in which the owner can come back if no comparable car can be bought for the payment (NAIC Model 902; kept by California, New York and Washington).
- A value that may be challenged
Valuation adjustments are being fought in class actions, and the federal appeals courts are split on whether they can be tried together (Ambrosio v. Progressive, 9th Cir. 2025).
Nobody publishes how long this takes. The law sets the pace of the owner's side: in Texas an insurer must acknowledge a claim within 15 days, accept or reject it within 15 business days of receiving the last document it asked for, and pay within five business days of saying yes (Tex. Ins. Code ch. 542). Nothing comparable sets the pace of the car's side: when a title never arrives, Texas makes the insurer wait until at least the 30th day after payment before it can apply for one in its own name (§501.0925). The owner is usually paid well before the file can close, which is why a total loss runs on two clocks, one for the customer and one for the car; today’s total loss process follows both.
Total Loss Claims Management: one adjuster's book of totals on one route
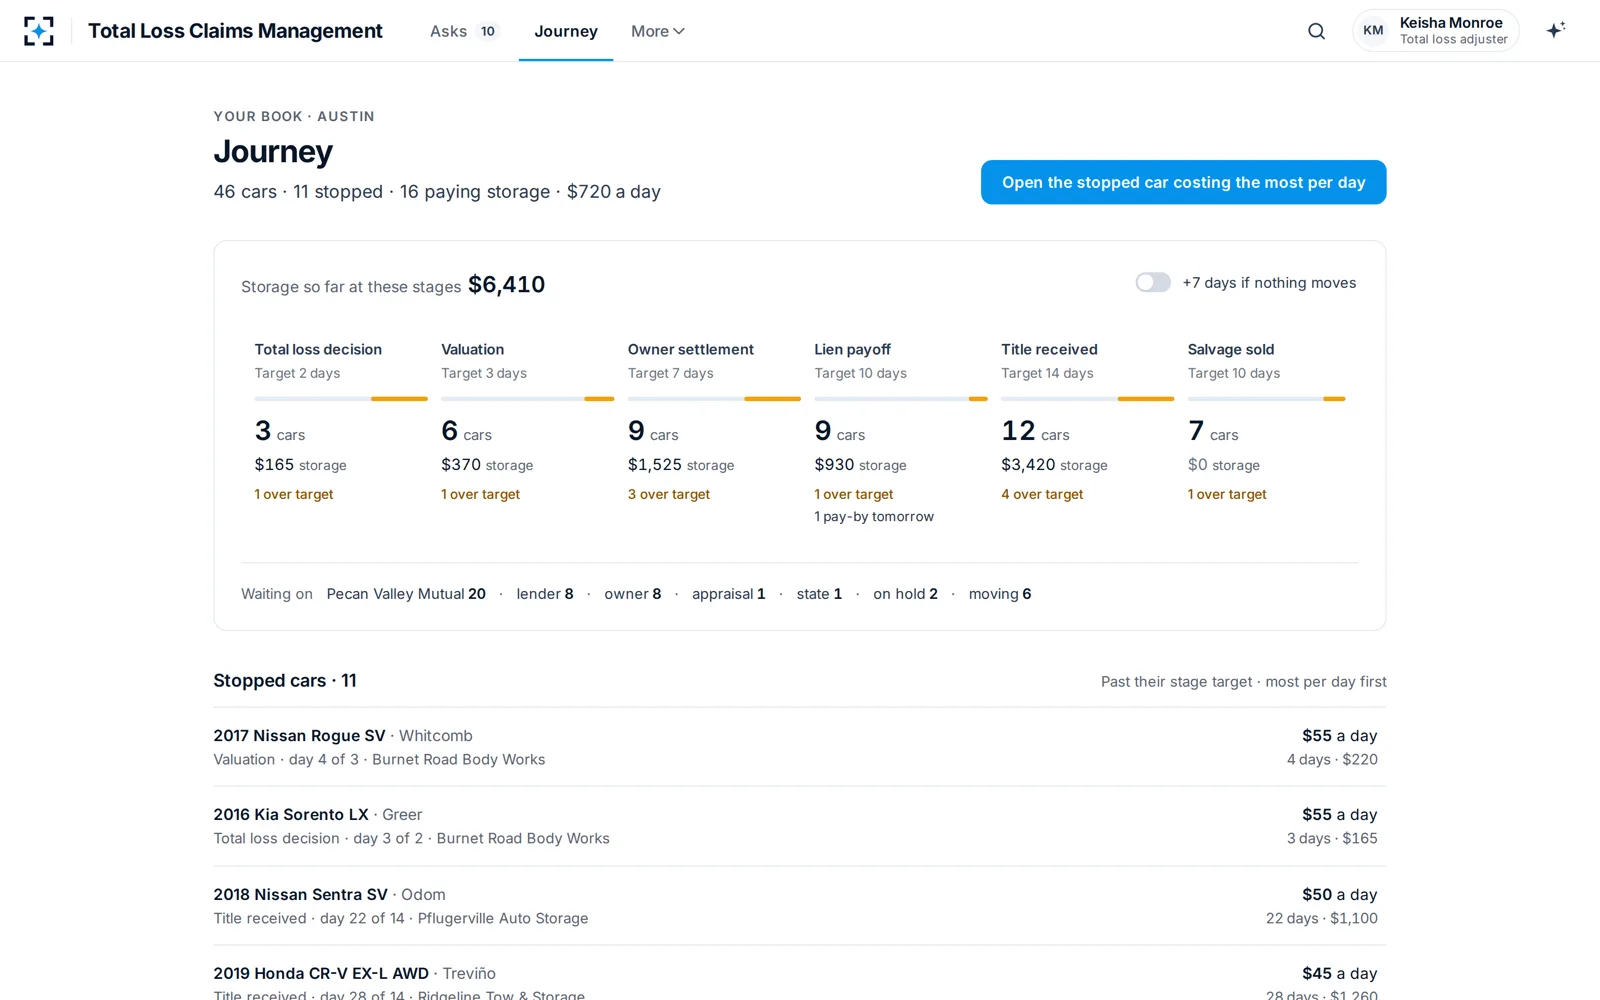
The trend line above, seen from one desk: every extra total is another row that stays open long after the payment.
The storage figures on a screen like this one are the cost the price indexes do not show. What each waiting day costs in storage, rental and salvage, and how to measure the return on shortening it, is worked through in what a totaled car costs while it waits.
Sizing the tail: costlier claims, and fewer people to work them
The money sits in the expensive files. In HLDI's 2024 figures, claims of $25,000 or more were 5.2% of collision claims but 23.8% of the dollars paid, close to a quarter of the collision bill from one claim in twenty (HLDI, 2025). Those are the files most likely to end in a total, and each of them carries the payoff, title and salvage tail described above.
The people who carry that volume are not growing with it. The Bureau of Labor Statistics counts 389,700 claims adjusters, appraisers, examiners and investigators in 2025 and projects a 6% decline by 2035 (BLS). It also expects technology "to automate some of the tasks that these workers currently perform". More expensive files, each with a longer tail, worked by a shrinking desk: that is the arithmetic every total-loss director is now living with.
“The average price of vehicle repairs has risen more than 40% since 2020.”
IIHS-HLDI, August 2026
If the trend holds, the work moves from the decision to the weeks after it
The decision itself is increasingly automated; the tail is not. In the NAIC's survey of large auto insurers, 135 of 193 used AI or machine learning in claims, 55 to evaluate images of loss and 50 to determine settlement amounts, and none to deny claims; "early total loss recognition" was among the uses insurers wrote in (NAIC, 2022). BLS notes that "computer software can evaluate photographs of damaged property and calculate an estimated claim amount" (BLS). Spotting the total early is becoming routine. Collecting a title from an owner who has moved, or a payoff letter before it expires, is not.
Regulation is adding work to each file at the same time. Washington's amended valuation rule, in force from 18 October 2026, allows only a closed list of adjustments, a search radius of up to 150 miles, and taxes and fees whether or not the owner keeps the car (WAC 284-30-391). By 8 October 2026, 29 jurisdictions had adopted the NAIC's model bulletin on insurers' use of AI, which names claim management explicitly (NAIC).
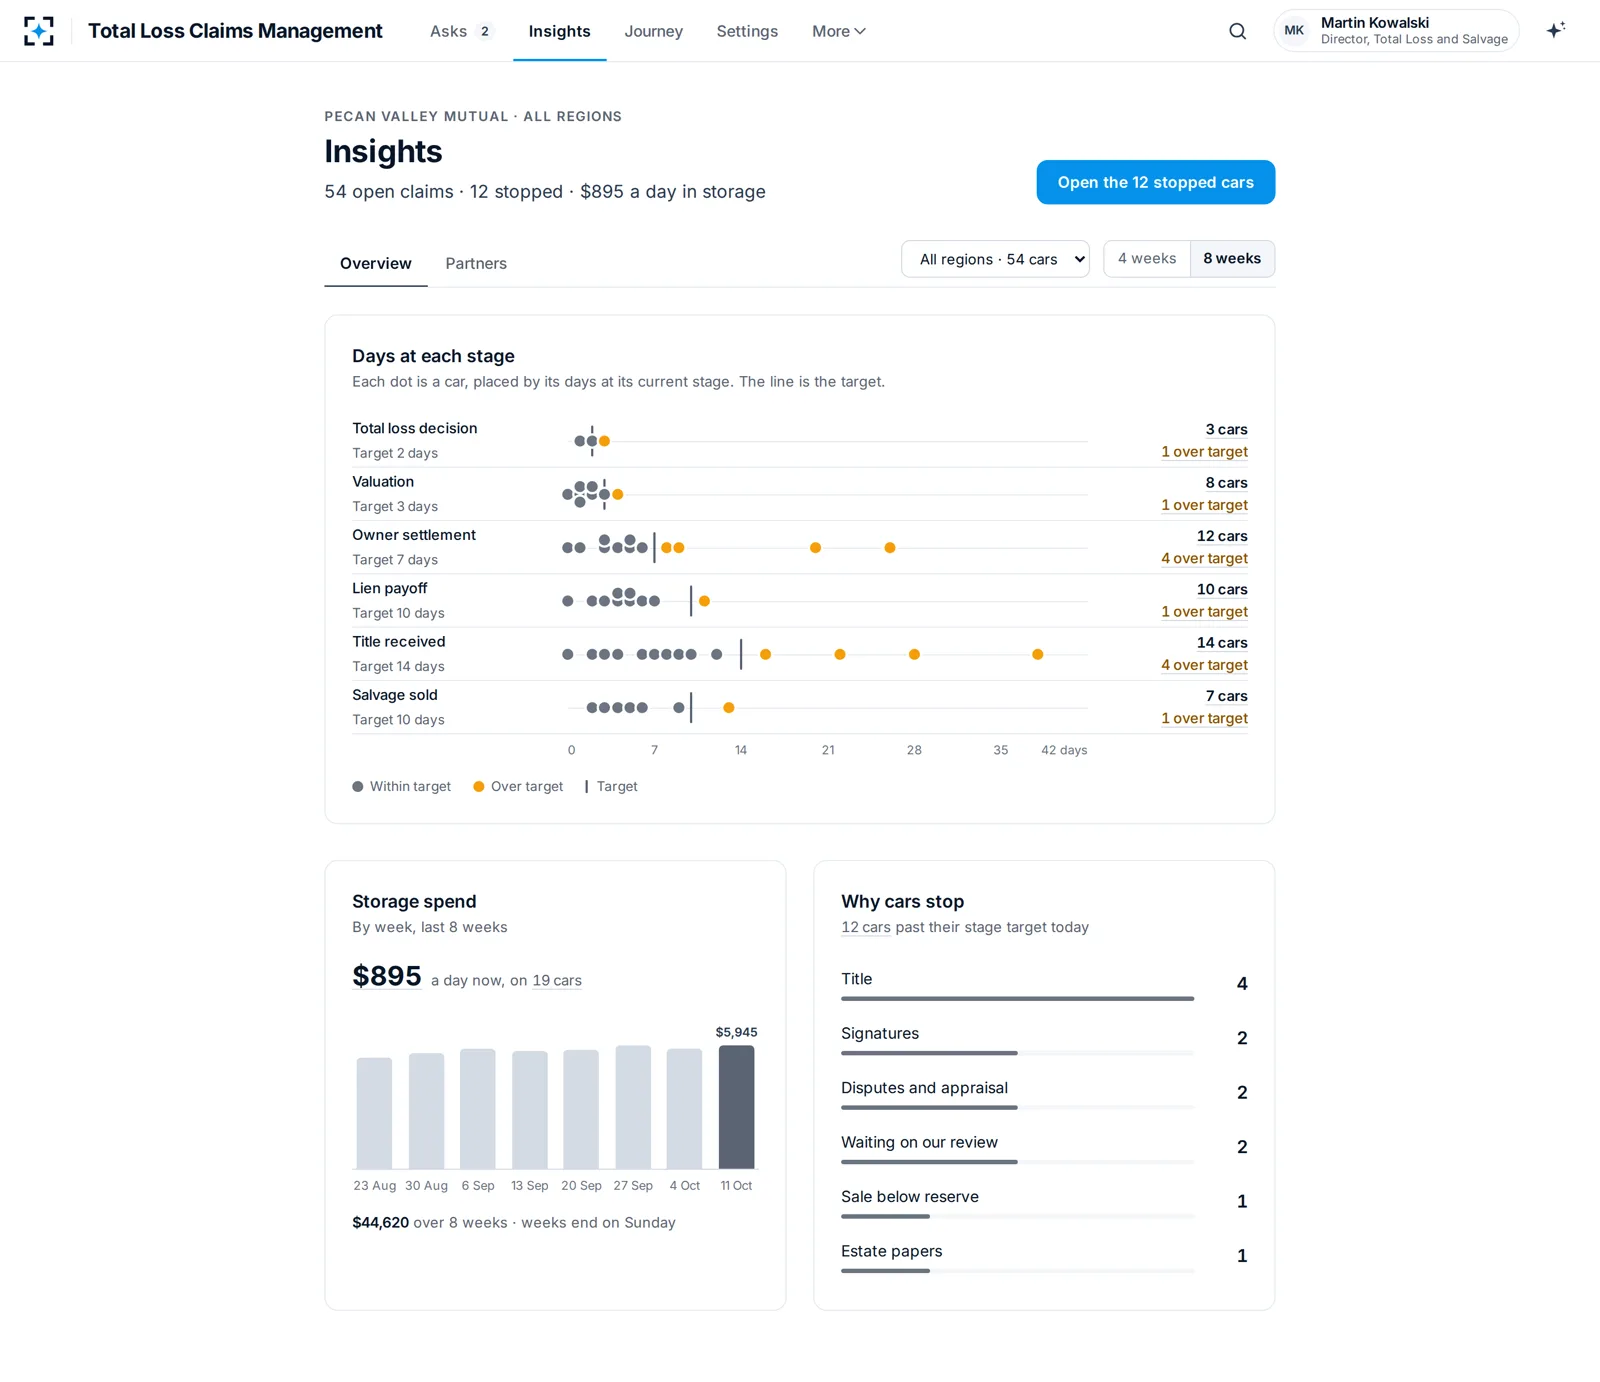
For a claims executive, that changes what is worth measuring. Total-loss frequency is set by the fleet and the repair market. What the carrier controls is everything after: days at each stage against a target, the reason each car has stopped, storage per day and payoff letters near expiry. Botminds' Total Loss Claims Management is built on exactly those measures. It shows every totaled car on one route with a target for each stage, prices storage per car every morning, and has agents read every document, build the value from cited listings, draft letters and chase payoffs and titles. The agents propose; a named person approves every payment, letter, move, filing and sale.
Total Loss Claims Management Insights: where the days go after the decision
Questions people ask
What percentage of car accidents end in a total loss?
There is no official figure. No regulator or research body publishes one, and the shares quoted online come from industry data firms counting claims on their own systems, not accidents. Crashes never reported to an insurer are in none of them. What public data does show is the direction: repair prices up much faster than car values since 2020.
Can I keep my car if it is totaled?
Often, yes, with less money and a branded title. California lets the insurer deduct the salvage value, set by what a salvage pool or dealer would pay, from the settlement when the owner keeps the car (10 CCR §2695.8). New York still requires the title once repairs exceed 75% of value and brands it "REBUILT SALVAGE". Texas's consumer counsel warns that "a car with a salvage title is worth less and might be harder to sell and insure in the future" (OPIC).
Why are cars totaled when the airbags deploy?
Because deployment turns a body repair into a parts bill. The airbags, the sensors and control unit that fired them and the panels they burst through are replaced, and on a car several years old that bill alone can approach the state's line. Deployment does not total a car by itself; the repair-to-value test still decides, so a new car with the same airbags fired is often repaired.
Do insurance companies make money from totaled cars?
They recover part of what they paid, not a profit on the car. The insurer pays the owner the car's value and then sells the wreck, usually at a salvage auction; in a total loss formula state that expected sale price is counted in the decision itself. In the sample CR-V file above the best salvage bid was $5,100, 23.7% of the $21,503 value, and storage at $45 a day was eating into it while the title was chased.
Does a total loss show up in a car's history?
Yes, for newer cars. Insurers must report total losses on the current and four prior model years to the National Motor Vehicle Title Information System every month, and in most states the car is then sold on a salvage title rather than a clean one.