ESG engagement tracking should report how many engagement objectives moved, on what evidence, and how fast, not how many meetings were held. A useful KPI set has four families: outcome KPIs (objectives that moved up a defined step on a public, dated source, and objectives fully implemented), time KPIs (months on the current step, objectives past the escalation clock), escalation KPIs (steps taken, by type, and what followed) and control KPIs (claims approved by a second person, risky wording cleared by Legal before it reached a company, notes logged on time). Meeting counts stay in the report as context. Botminds' Stewardship Engagement Tracking produces these KPIs as a by-product of the work: every objective is a ladder of steps, every step needs a cited source and an approver, and every clock is a setting.
Figures are from the solution's fictional sample manager, Quillfield Capital, as of 21 October 2026; targets are labelled as targets.
One sample year in Stewardship Engagement Tracking: objectives tracked, moved and implemented
What should ESG engagement tracking measure?
It should measure progress against objectives that were set before engaging, using steps whose evidence tests are written down. Everything else follows from that. The UK Stewardship Code 2026 asks signatories under Principle 3 for engagement examples that explain how far each one has moved towards the objective or outcome it set (FRC); a programme that tracks objectives and steps can answer for every engagement, not just for the case studies.
Japan's Stewardship Code puts the warning more bluntly: institutional investors "should not fall into formalism, such as to regard having a dialogue itself as the aim" (FSA, Japan's Stewardship Code, footnote 13). A KPI set built on meetings held is formalism in numbers. One built on objectives moved is harder to inflate, because each movement needs the company's own words.
ESG engagement KPIs: four families, defined so they can be tested
| KPI | Definition | Sample value |
|---|---|---|
| Objectives moved | Objectives whose step rose this year on a cited public source, approved by a second person. | 297 of 1,094 |
| Objectives implemented | Objectives at the final step, shown done by a public source. | 162 |
| Months on current step | Median time each open objective has sat on its step; count past the policy clock. | 4 reached the 18-month clock in one night; one at 25 months |
| Escalation steps taken | Steps taken on the escalation rail, by type, with dates and approvers. | 158 steps at 38 companies |
| Verbal commitments open | Commitments heard but not yet published, with days left on the evidence clock. | 1 held out of the report |
| Second-person rate | Share of step changes approved by someone other than the analyst who proposed them. | Target 100% |
| Clearances before contact | Agendas, letters and escalations at watched holdings checked and, where flagged, cleared by Legal before reaching the company. | 23 agendas checked in one night, 3 to Legal; target: no high-risk item uncleared |
| Service levels | Notes logged, step changes decided and letters sent within the firm's deadlines. | Settings: 1, 10 and 5 business days |
Activity KPIs, and why they mislead on their own
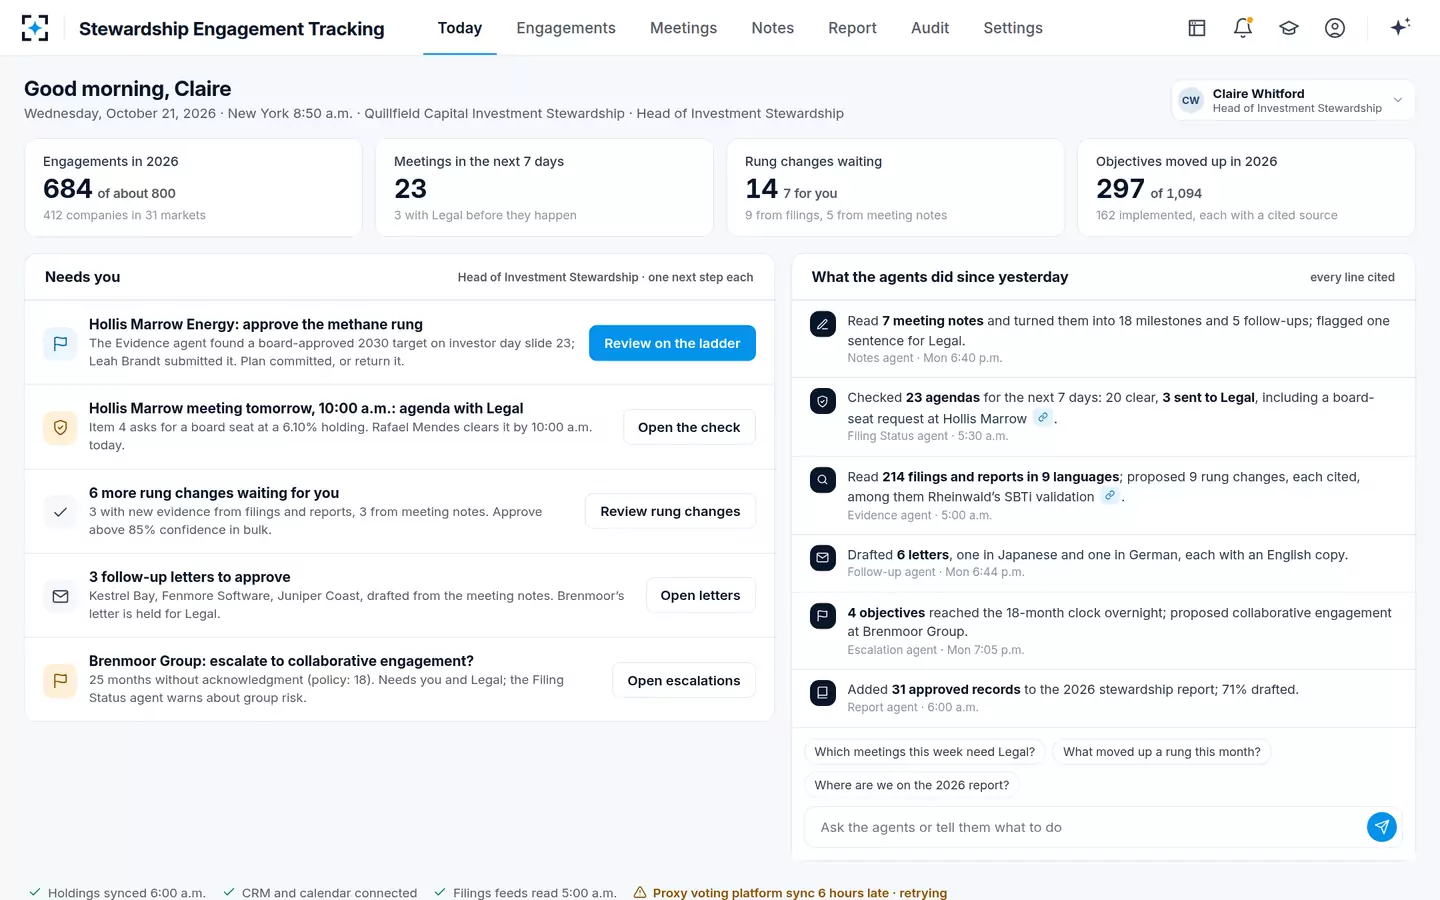
Activity KPIs measure effort, and effort is easy to grow without moving anything. Meetings held, letters sent, companies engaged and votes cast all belong in an ESG engagement report, because they show coverage and scale: the sample manager held 684 engagements with 412 companies in 31 markets by late October, of about 800 planned. But a programme can double its meetings and move no objectives, and nothing in an activity count will show it.
Engagement tracking metrics: what activity counts show, and what outcome counts add
Activity KPI: 684 engagements with 412 companies.
Outcome KPI: 297 of 1,094 objectives moved up a step; 162 implemented.
Activity KPI: Coverage, effort, reach across markets.
Outcome KPI: Whether companies did what the engagements asked.
Activity KPI: The firm's own calendar and notes.
Outcome KPI: The company's published documents, cited and dated.
Activity KPI: More, shorter meetings; counting every email.
Outcome KPI: Loose step definitions; counting verbal promises.
Activity KPI: Report against plan (684 of about 800).
Outcome KPI: Written evidence tests and a second approver for every step.
Research on commitments points the same way. Kim and Yoon, studying active US funds that signed the PRI, examined screening, engagement and voting and "fail to observe evidence of meaningful on average follow-through" (Management Science, 2023). Signing, like meeting, is an input. The KPI an asset owner should ask its managers for is the output.
Outcome KPIs: steps moved on a cited source
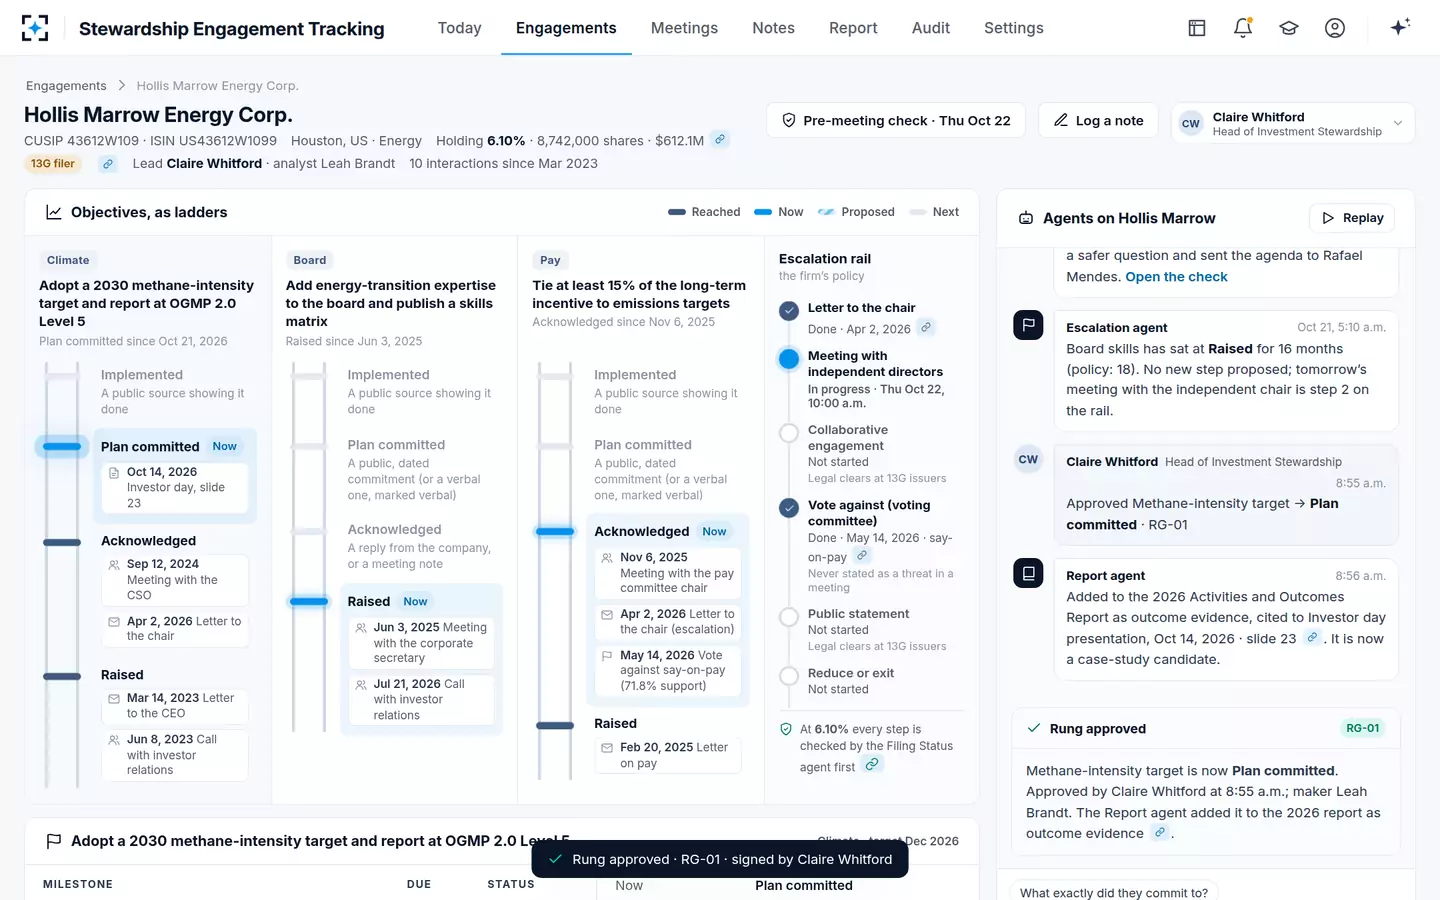
Count objectives, not meetings, and count a movement only when a public source supports it and a second person approved it. The ladder in the sample has four steps, Raised, Acknowledged, Plan committed and Implemented, with an evidence test for each: a reply or a meeting note for Acknowledged, "a public, dated commitment" for Plan committed, a public source showing it done for Implemented. With those definitions, "297 objectives moved up at least one step" is a claim any reviewer can sample and test.
Two refinements make the outcome KPIs more useful to a CIO. Report them by theme and region, since the FRC expects reporting proportionate to where assets are invested, and report the denominator alongside the numerator every time. Reporting by step reached, rather than a single "success" count, also separates the hard moves (Plan committed to Implemented) from the easy ones (Raised to Acknowledged), which is where an owner's questions usually start. What counts as evidence for each step is set out in its own guide.
Where 1,094 sample objectives stand on the 2026 KPI
All objectives tracked
- Moved up at least one step in 2026 · 27%
- No step change in 2026 · 73%
Time on a step: the KPI that drives escalation
Time on the current step is the KPI that turns tracking into management. An objective at Acknowledged for six months is normal; one there for two years is a decision the firm has not made. The sample firm's policy clock is 18 months on any step; when an objective crosses it, the Escalation agent proposes the next step on the rail and a person decides. In one night, four objectives reached the clock, and one company had gone 25 months without acknowledging a request for an independent chair.
Report time on a step as a distribution, not an average: the median for open objectives, and the count past the clock, by theme. A programme whose objectives cluster just under the clock may be deferring escalation; one with many far past it is not using its own policy. Both are worth an owner's question, and the escalation policy guide sets out how the clock and the steps fit together.
Owners interested in risk can add one more measure here. Research on ESG engagement finds downside risk falls at engaged firms after successful engagements, especially on environmental topics (Hoepner et al., Review of Finance, 2024), and that returns follow success but not failure (Dimson, Karakaş and Li, 2015). With dated steps, a firm can track value at risk and incidents for engaged holdings before and after each move to Implemented.
Control KPIs: second person, Legal clearance, service levels
Control KPIs show that the outcome numbers can be trusted and that engagement did not create legal risk. For a US manager filing Schedule 13G above 5%, the SEC staff's February 2025 guidance makes some engagement wording risky enough that agendas go to counsel first (C&DI 103.12); the KPI is whether anything high-risk reached a company without clearance. For outcome claims, it is whether every step change had a second approver. For timeliness, it is whether notes, approvals and letters met the firm's deadlines.
Control KPIs on the sample book, and the targets behind them
0
high-risk items reaching a company without Legal's clearance
target
100%
of step changes backed by a cited source and a second person
target
3 of 23
agendas for the coming week sent to Legal after the overnight check
14
step changes waiting for approval on the morning shown
Control KPIs also protect the analyst. When the sample firm's filing-status rules were revised, the new version was tested on 310 past agendas, missed no high-risk item, and raised 11 false alarms against 14 for the version in use. A false-alarm rate per rule version is a KPI for counsel's time as much as for compliance.
Engagement milestones: how to set them so they can be measured
A milestone is measurable when it has a number, a date and a source that will show it. Take a sample call with a food company's sustainability officer, logged the same afternoon. It produced two milestones: the written no-deforestation policy published by 31 March 2027, and traceability to crusher level for 90% of soy volumes by 31 December 2027, from 64% today. Each has a baseline, a target and a date, and each names where the evidence will appear: the company's website and filings.
Milestones without those parts become prose in the report. "Improve supply-chain transparency" cannot be tested; "90% of soy volumes traceable to crusher level by the end of 2027, from 64%" can, and when the company's next report gives the figure, the Evidence agent proposes the milestone met, with the passage cited, for a person to approve.
The KPIs on one screen in Stewardship Engagement Tracking: engagements, steps, objectives
An ESG engagement report built on the KPIs
Lead with outcomes, give activity as context, show time and escalation, and state the controls. A one-page summary in that order answers an asset owner's first four questions: what changed, how much effort it took, what is stuck and what the firm did about it, and why the numbers can be believed. Case studies then illustrate the KPIs rather than replace them.
In the sample, the report's opening section reads directly from the KPIs: 684 engagements with 412 companies in 31 markets; 1,094 objectives tracked; 297 moved up at least one step and 162 implemented, "each confirmed by a public source"; escalation at 38 companies. Thirteen step changes still waiting for approval are left out until approved. The same figures feed the UK Code report, the EU engagement report under the Shareholder Rights Directive and client reports, so the firm says the same thing everywhere.
The KPIs carried into the report, each with its source
What should an engagement programme not claim?
It should not claim causation it cannot show, success it has not evidenced, or coverage it has not measured. The research is a good guide to the limits: the studies that find benefits from engagement find them after success, using investors' own records of which engagements succeeded, and they report associations. A programme's KPIs should keep to the same discipline.
Claims an ESG engagement report should not make
- "Our engagement caused the company to..."
Write "following our engagement" unless the firm can show the link; most changes have several causes.
- A success rate without a denominator
"162 objectives implemented" needs "of 1,094 tracked".
- A verbal promise as an outcome
Report it when the company publishes it; until then it is a commitment on an evidence clock.
- A coalition's result as the firm's own
State the firm's role, lead or supporter, and what it contributed.
- An outcome from last year as this year's
Separate what moved in the period from earlier progress.
- Impact on emissions or returns from engagement alone
Unless measured against comparable holdings that were not engaged, and labelled as an association.
Choosing a tool to produce these KPIs
Ask whether the KPIs fall out of the daily work or have to be assembled each spring. A tool that only stores meeting notes will produce activity KPIs easily and outcome KPIs never, because nothing in it says which step an objective is on, on what evidence, approved by whom. The test is to pick any number on a vendor's dashboard and open the objectives, sources and approvals behind it.
Stewardship Engagement Tracking fits programmes that already set objectives, or want to, and that report under the UK Code, the EU directive or to asset-owner clients. It reads the systems a stewardship team already uses, from CRM and calendar to holdings, the beneficial-ownership filing system, the proxy voting platform and filings feeds, and it does not replace them. It does not vote, file or decide; people approve every step. A firm choosing software on the 13G question will find that comparison in engagement tracking software that knows the Schedule 13G line. To see the KPIs on a sample of your own notes and last year's report, start from Stewardship Engagement Tracking.
Questions people ask
What are good ESG engagement KPIs?
Objectives moved up a defined step on a public source, objectives implemented, months on the current step, escalation steps taken on time, and control measures such as second-person approval and Legal clearance. Activity counts, such as meetings held, add context but should not lead.
How do you measure engagement outcomes over time?
Give each objective a small number of steps with written evidence tests, date each step from the company's own document, and report both the steps reached this year and the time each open objective has spent on its current step. That gives a series a firm can compare year on year.
How long should an engagement objective take?
No rule sets a duration, and the FRC accepts that outcomes may take more than one reporting period. Firms set their own clock per step; the sample firm uses 18 months before the next step on its escalation rail must be considered.
What is an ESG engagement report?
A report of an investor's engagements on environmental, social and governance issues and what came of them, usually part of a stewardship report or a client report. A strong one leads with outcome KPIs, gives activity as context, and cites the company's own documents for each outcome claimed.
What share of engagement objectives should succeed in a year?
No regulator or independent study publishes a benchmark, and it depends on how hard the objectives are. In the sample, 27% of tracked objectives moved up at least one step during the year; a firm should watch its own trend and the time its objectives wait, rather than a single success rate.
Is engagement tracking software the same as a stewardship report tool?
They overlap. Tracking holds objectives, steps, evidence and approvals as the work happens; the report is drafted from them. A tool that does only one leaves a manual step between the two, which is where unsupported claims usually enter.