A medium-term fiscal framework is a government's published plan for its public finances over the next three to five years: the macroeconomic assumptions, the projected revenue, spending, deficit and debt, the targets the government commits to, and usually the sensitivity of those numbers to growth, interest rates or commodity prices. It is a promise, not a rule, and its value to a credit analyst lies in comparing it with what happened. Line up each year's outturn against the target the previous framework set, and each new framework against the last, and you have the simplest credibility test in sovereign analysis, using nothing but the government's own documents. Those documents are usually published first, and often only, in the national language, and a new version can quietly supersede an old one. Botminds' Sovereign Credit Analysis keeps every version of every medium-term fiscal framework, lists what changed the moment a new one lands, and ties each figure to its page.
Promises, outturns and revisions, in four numbers
12.5%
Greece's 2009 deficit as revised in October 2009, against 3.7% of GDP planned that spring
50%
of the time, countries exceeded their deficit limits, 2004–21
4–5years
span of an EU medium-term fiscal-structural plan
0.75point
of a sample deficit change its own assumptions do not explain
our arithmetic, fictional sample
What is a medium-term fiscal framework?
A medium-term fiscal framework is the multi-year fiscal plan that sits around a government's annual budget. The IMF's Fiscal Transparency Code sets the standard for it: "Budget documentation includes outturns and projections of revenues, expenditures, and financing over the medium term on the same basis as the annual budget" (IMF Fiscal Transparency Code, principle 2.1.3). Different countries call it different things: a medium-term fiscal framework, fiscal strategy, medium-term program, marco fiscal de mediano plazo. The content is what counts.
Three words in the Code's sentence do most of the work for an analyst. "Outturns" means the framework should show what happened, not only what is planned. "Projections ... over the medium term" means the government commits to a path, not just a year. And "on the same basis as the annual budget" means the numbers should be comparable with the budget the parliament votes, so that a later reader can hold the two against each other.
What is in a medium-term fiscal framework?
A good medium-term fiscal framework contains the macro assumptions, the fiscal projections, the targets and the risks, and it explains how it differs from the previous one. The checklist below is the content an analyst should expect, drawn from the IMF's transparency standard; a framework missing several items is itself a signal.
What a medium-term fiscal framework should contain
- Macroeconomic assumptions, disclosed and explained
Growth, inflation, interest and exchange rates, and the commodity prices revenue depends on. The Code asks that budget projections rest on "comprehensive macroeconomic forecasts, which are disclosed and explained".
- Revenue, spending and financing for each year
On the same basis as the annual budget, with outturns for the two preceding years.
- The fiscal objectives, stated measurably
Deficit and debt targets for each year, and the rule or anchor they serve.
- Sensitivities
How much the deficit moves per point of growth or per $100 of a commodity price. The analyst's best tool for re-running the numbers.
- One-off and temporary measures, identified
Asset sales and windfalls named as such, so the underlying position is visible.
- Fiscal risks
Guarantees, state companies, public-private partnerships and other contingent liabilities.
- A reconciliation with the previous framework
What changed since the last version, split between new policies and changes in the economy.
Is a medium-term fiscal framework a fiscal rule?
No. A fiscal rule is a numerical limit fixed in law that cannot be changed every year; a medium-term framework is a plan the government revises with each budget. The IMF's fiscal rules dataset draws the line explicitly: "Medium-term budgetary frameworks or expenditure ceilings that provide multi-year projections but can be changed annually are not considered to be fiscal rules" (Davoodi and others, IMF WP/22/11, Annex I).
The distinction tells an analyst how to read the framework. The rule is the constraint; the framework is the government's claim that its plans meet the constraint. Testing the claim means testing the framework's numbers against the rule on assumptions other than the government's, which how to test a country's fiscal rule sets out step by step. Testing the government's credibility means something simpler: comparing what it promised last time with what it delivered.
What is the EU medium-term fiscal-structural plan?
Since the EU's 2024 reform, each member state submits a national medium-term fiscal-structural plan, defined as "the document containing the fiscal, reform and investment commitments of a Member State, covering a period of four or five years depending on the regular length of the legislative term" (Regulation (EU) 2024/1263, Article 2). The plan sets a net expenditure path, and for countries with debt above 60% of GDP or a deficit above 3%, the Commission first sends a reference trajectory covering "an adjustment period of four years and its possible extension by up to three years".
The EU version builds the promise-vs-outturn test into the framework. Spending is tracked against the agreed path, deviations are booked in a control account, and safeguards set minimum effort: a debt ratio falling by at least 1 point of GDP a year on average while it is above 90%, or 0.5 point between 60% and 90%, and a structural deficit margin of 1.5% of GDP below the 3% reference value. Outside the EU, few frameworks carry that machinery, so the analyst has to build the comparison.
How reliable are government fiscal forecasts?
Less reliable than they look, and biased in a predictable direction. Frankel and Schreger's study of official forecasts found that "Governments' budget forecasts are biased in the optimistic direction, especially among the Eurozone countries, especially when they have large contemporaneous budget deficits, and especially during booms", and that euro members exceeding the 3% cap "almost never forecast that they will violate the cap in the coming years" (Frankel and Schreger, NBER Working Paper 18283). The same research finds that national fiscal rules and an independent fiscal institution producing forecasts reduce the bias.
The IMF builds the same suspicion into its debt framework, which includes realism tools to "guard against excessively optimistic projections that might mask looming stress" (IMF SRDSF guidance note, 2022). And the extreme cases show how far a promise can drift. In October 2009 the Greek authorities revised "the planned deficit ratio for 2009 from 3.7% of GDP (the figure reported in spring) to 12.5% of GDP", and the 2008 deficit from 5.0% to 7.7%, in revisions the Commission called "extremely rare in other EU Member States" (European Commission, COM(2010) 1).
Greece, 2008–09: the promise and the revision, % of GDP
Greece is an outlier, but it is the outlier that defines the test. The October revision came from the government's own notification tables: the promise and the revision were both on paper, months apart. An analyst who lined them up the week the second appeared knew what the market learned over the following months.
The promise-vs-outturn test, step by step
The promise-vs-outturn test compares, for each year, the target a government set in an earlier framework with what it later reported, and asks how much of any gap came from the economy and how much from policy. It needs three things: the earlier framework, the outturn and the government's own sensitivities. All three are in the government's documents.
Testing a medium-term fiscal framework against its own history
| Step | What to take | From where | What it tells you |
|---|---|---|---|
| 1. Line up the vintages | Each year's target in each past framework | Earlier frameworks, kept as published | Whether targets drift each year, and in which direction |
| 2. Add the outturn | The deficit and debt the government later reported | Budget execution and debt office reports | The size of each miss, or each overperformance |
| 3. Split the gap | Growth, prices, interest rates against the earlier assumptions | The government's own sensitivity tables | How much of the miss the economy explains |
| 4. Name the rest | One-offs, new measures, reclassifications | The framework's own reconciliation, if any | The part that is policy, which is the credibility test |
| 5. Compare with an outside view | The IMF's projection for the same years | The latest Article IV staff report | Whether the outside view had the miss coming |
Step one is where most analyses fail, for a mundane reason: earlier frameworks disappear. Ministries replace a document at the same web address, move it, or publish an update without the original. A desk that did not keep the April version cannot compare it with October's.
How to compare fiscal targets and outturns: a worked example
Take a sample as it runs through Sovereign Credit Analysis. On October 14, 2026, the fictional Republic of Calvera published its Marco Fiscal de Mediano Plazo 2027–2030, superseding the April 28 update. Six minutes after publication the Release Watcher fetched it and listed the five figures that moved, each with its page.
What changed between April and October, figure by figure, in Sovereign Credit Analysis
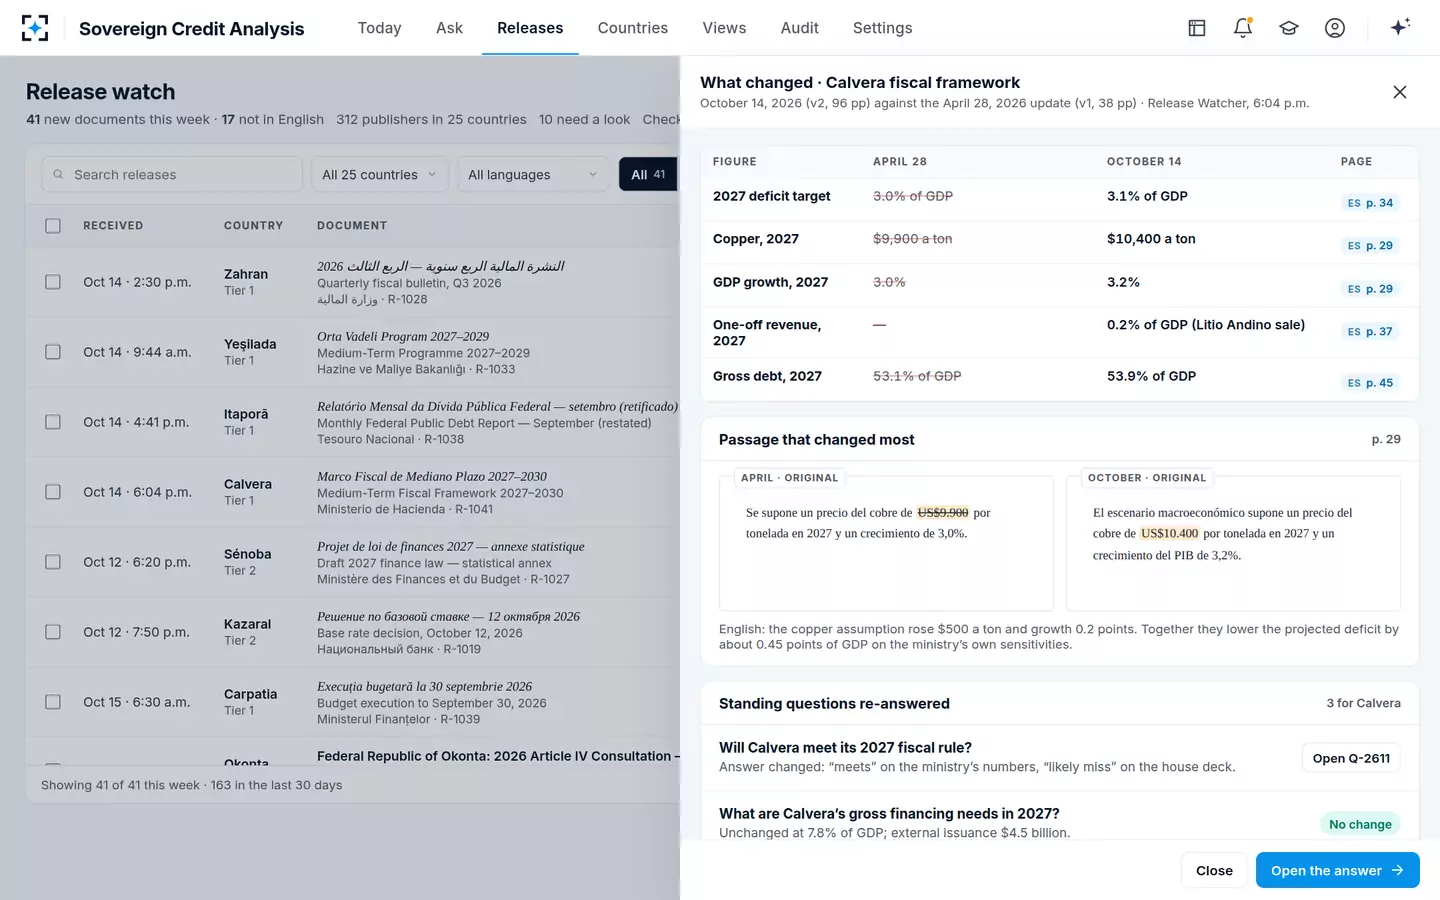
Read the five changes together and they tell a story the headline does not. The ministry raised its copper price by $500 a ton and its growth forecast by 0.2 point; on its own sensitivities, that alone lowers the 2027 deficit by about 0.45 point of GDP. On April's policies the deficit would therefore have fallen to about 2.55%. Instead the target rose to 3.1%, and 0.2 point of that 3.1% is a one-off sale counted as revenue. Strip the sale out and the underlying 2027 deficit is about 3.3%, roughly 0.75 point worse than April's plan would have produced on October's assumptions.
One framework, two vintages: what the assumptions explain and what they do not
| Step | 2027 deficit, % of GDP | Source |
|---|---|---|
| April target | 3.0 | April 28 update |
| Effect of higher copper (+$500 a ton) and growth (+0.2 point) | −0.45 | Ministry's own sensitivities, October framework |
| April plan on October's assumptions | 2.55 | Our arithmetic |
| October target, as published | 3.1 | October framework, p. 34 |
| One-off asset sale counted as revenue | +0.2 if excluded | October framework, p. 37 |
| Underlying October deficit, excluding the sale | 3.3 | Our arithmetic |
| Change the assumptions do not explain | +0.75 | Our arithmetic: 3.3 − 2.55 |
That 0.75 point is the analytical finding. It could be new spending, weaker non-commodity revenue or a reclassification; the framework does not say on the pages the agents read, and the right next step is a question to the ministry or a closer read of the expenditure chapter. It is also exactly the kind of drift Frankel and Schreger's results would lead one to watch for: a government that improved its assumptions and still loosened its target.
What is forecast reconciliation?
Forecast reconciliation is a government's own explanation of why its fiscal forecast changed from the previous one. The IMF's Fiscal Transparency Code makes it a principle: "Budget documentation and any subsequent updates explain any material changes to the government’s previous fiscal forecasts, distinguishing the fiscal impact of new policy measures from the baseline" (IMF Fiscal Transparency Code, principle 2.4.3).
The Code grades the practice. At the basic level, differences between vintages "are shown at the aggregate level, with a qualitative discussion of the impact of new policies". At the advanced level, they "are broken down into the effects of individual policy changes, macroeconomic determinants, and other factors, such as technical and accounting adjustments". A government that publishes an advanced reconciliation has done the analyst's step four; one that publishes none has left it to the analyst, which is itself informative. The Code's companion principle asks for "independent evaluation" of the government's forecasts, the role a fiscal council or an IMF Article IV plays, and when the IMF and the budget disagree shows how to read the outside view against the inside one.
Where Sovereign Credit Analysis makes the test routine
The promise-vs-outturn test is not hard; it is tedious, and it depends on having kept every version. That makes it a natural job for agents. In Sovereign Credit Analysis the Release Watcher versions every release from 312 official publishers and never deletes one, so the April framework is still there in October. It diffs each new version against the last and lists the figures that moved with their pages. The Original-Language Reader takes the sensitivities from the government's own tables, and the Reconciler uses them to explain changes, marking anything above 0.1 point of GDP it cannot explain for the analyst.
The judgment stays where it belongs. Whether 0.75 point of unexplained loosening is a warning or a one-year blip is the analyst's call, and whether it changes the house view is the strategist's. What the agents change is that the comparison exists on the morning after every framework, for every country in the book, rather than once a year for the largest. The week after a budget follows that morning from the analyst's side.
Questions people ask
What is a medium-term expenditure framework?
A medium-term expenditure framework is the spending side of a medium-term plan: multi-year ceilings for total spending and often for ministries or programs, set within the fiscal framework's overall envelope. Like the fiscal framework, it is usually revised each year, which is why the IMF's fiscal rules dataset does not count it as a fiscal rule.
Where can I find a country's medium-term fiscal framework?
On the finance ministry's website, usually published with or shortly before the annual budget, and in some countries in a mid-year update; EU member states' medium-term fiscal-structural plans are submitted to the Commission. The national version is often in the national language only, and older versions are not always kept online, so save each one as it is published.
How often is a medium-term fiscal framework updated?
Typically once or twice a year, with the budget and sometimes a mid-year review. In the EU, a national medium-term fiscal-structural plan covers four or five years, and a newly appointed government may submit a revised plan for a new period. Each update is a new vintage to compare with the last.
What is a credible fiscal target?
One that survives contact with someone else's assumptions and with the government's own history. A target is more credible when the government has met past targets, when it rests on assumptions close to independent forecasts, when one-offs are excluded, and when changes from the previous framework are explained. Frankel and Schreger found that national fiscal rules and independent fiscal institutions reduce the optimism in official forecasts.
Why do governments miss their medium-term targets?
Partly because the economy turns out differently from the assumptions and partly because policy changes, and the split between the two is what a reconciliation should show. Research on official forecasts finds a systematic optimistic bias, strongest in booms and when deficits are already large. The IMF's researchers also found that countries exceeded their deficit limits about half the time over 2004–21.