Debt sustainability analysis (DSA) is the standard method for judging whether a government's debt can be kept on a stable path without default or an implausibly large fiscal squeeze. The IMF's Executive Board defines the test: "public debt can be regarded as sustainable when the primary balance needed to at least stabilize debt under both the baseline and realistic shock scenarios is economically and politically feasible", with acceptably low rollover risk and without sacrificing growth. Every IMF Article IV report and lending program carries one, built with one of two frameworks: the Sovereign Risk and Debt Sustainability Framework for market-access countries, and the joint IMF–World Bank framework for low-income countries. A DSA is only as good as its baseline, and the baseline is built from the government's budget, debt bulletins and fiscal framework. Botminds' Sovereign Credit Analysis reads those documents in their original language and lays the government's figures beside the IMF's, so an analyst can see where a DSA's inputs come from and why they differ.
The IMF's debt verdicts in four numbers
3modules
in the core market-access framework: early warning, debt fanchart, financing needs
2years
horizon of the IMF's near-term probability of sovereign stress
20%
probability of unsustainable debt above which debt is no longer "sustainable with high probability"
1a year
full DSA expected at least once every calendar year for low-income countries
What is debt sustainability analysis?
Debt sustainability analysis is a forward-looking test of two things at once: solvency, whether the debt ratio can be stabilised, and liquidity, whether the government can roll over what falls due. The IMF's guidance is explicit that both count: "Debt sustainability depends on both solvency (debt stabilization) and liquidity (rollover risk). This fact helps circumvent the difficulties in disentangling solvency and liquidity problems in practice" (IMF SRDSF guidance note, 2022).
The "economically and politically feasible" clause in the Board's definition is where most of the argument happens. Almost any debt path can be stabilised on paper by assuming a large enough primary surplus. The question a DSA asks is whether that surplus is one this government, with this parliament and this economy, could plausibly run, and for how long. That is why DSAs lean on history: how large a fiscal adjustment has any country ever sustained, and how large has this one.
A DSA is not the same as a risk rating, and the IMF draws the line itself. Its guidance says communication of the risk assessment "should be clear that sovereign stress is a broad concept and does not constitute a debt sustainability assessment": a jump in spreads or a loss of market access can be stress without the debt being unsustainable. A sustainability verdict is a heavier statement, usually made after stress has arrived, and it shapes whether creditors are asked to take losses.
What is the debt sustainability formula?
The formula behind every DSA is the debt accumulation identity: this year's debt equals last year's debt plus interest, minus the primary balance, plus revaluation of foreign-currency debt and everything else that moves debt without passing through the budget. In the IMF's notation, Dt = (et/et−1)·Dft−1 + Ddt−1 + It − PBt + SFAt. Expressed as a share of GDP, the change in the debt ratio splits into the four terms below.
What moves the debt ratio in a year, term by term
Primary deficit
− pb
Noninterest spending less noninterest revenue, as a share of GDP. The one term the government sets directly.
The budget
Interest–growth effect
(r − g) ÷ (1 + g) × d
Real interest rate on the debt (r) against real growth (g), times last year's debt ratio. Positive when debt costs more than the economy grows.
Markets and the economy
Exchange-rate effect
Δe × foreign-currency share × d
A depreciation raises the local-currency value of foreign-currency debt overnight.
The currency
Stock-flow adjustment
+ sfa
Contingent liabilities that materialise, arrears cleared, and asset transactions such as a privatisation that reduces borrowing.
Below the line
Setting the change in the debt ratio to zero gives the number most analysts actually use, the debt-stabilising primary balance: pb* = (r − g) ÷ (1 + g) × d. Take an illustrative government with debt at 60% of GDP, an effective real interest rate of 5% and real growth of 2%. It needs a primary surplus of about 1.8% of GDP just to hold debt steady (0.03 ÷ 1.02 × 60). If growth slows to 1% and rates rise to 6%, the requirement jumps to about 3.0% of GDP. The same budget can be sustainable or not depending on two assumptions it does not control.
One definitional trap sits inside the first term. The IMF notes that the framework's primary deficit is "noninterest expenditures less noninterest revenues", consistent with the World Economic Outlook, which differs from the Government Finance Statistics Manual's primary balance, which removes interest expenditure but not interest revenue. For a government with large deposits earning interest the two can differ, and primary balance vs fiscal balance works through that and four other confusions.
How does the IMF's framework for market-access countries work?
For countries that borrow mainly in markets, the IMF uses the Sovereign Risk and Debt Sustainability Framework, which the guidance says "will become the Fund's principal tool for assessing public debt sustainability". Its core is three modules: "(i) the near-term early warning system (logit model), (ii) the Debt Fanchart Module, and (iii) the GFN Module". Each turns its inputs into a single risk index and compares it with two thresholds to give a low, moderate or high mechanical signal.
The IMF's market-access framework: three horizons, three tools, one judgment
| Horizon | Tool | What it measures | What it produces |
|---|---|---|---|
| Near term | Early warning system (logit model) | The probability of sovereign stress within the next two years, from realised data | A low, moderate or high signal |
| Medium term | Debt fanchart module | Spread of possible debt paths, the probability that debt does not stabilise, and the terminal debt level | An index combined with the financing-needs index |
| Medium term | Gross financing needs module | The size of financing needs, who holds the debt, and whether domestic banks could step in as residual creditor | Liquidity risk, combined into the medium-term index |
| Long term | Optional modules | Demographics, natural resources, large debt amortisations, climate change | An assessment by judgment, with no mechanical signal |
| Overall | Staff judgment | All of the above, plus prospects for debt stabilisation in the baseline | Overall risk of sovereign stress; a sustainability assessment when needed |
The calibration is worth reading closely, because it tells you what a signal means. The IMF set its thresholds so that missed crises and false alarms are each about 10 percent, and then measured how often stress followed each zone. For the near-term tool, "the average probability of stress for an index value in the high-risk zone is 0.40 while the average probability of stress for an index value in the low-risk zone is 0.02"; for the medium-term index the figures are 0.43 and 0.04.
A high-risk signal means stress is a serious possibility, not the likely outcome
What does "sustainable but not with high probability" mean?
It is the middle of the IMF's three sustainability verdicts, and it means the IMF's tools put the probability that debt is unsustainable between 20 and 50 percent. According to the IMF's explanatory notes on the framework, a probability "strictly below 20 percent" reads as sustainable with high probability, "between 20 and 50 percent" as "sustainable but not with high probability", and "above 50 percent" as unsustainable (IMF MAC SRDSF FAQ).
Two practical points follow for anyone reading a published report. First, the sustainability verdict is not always there: the guidance says these assessments "are usually performed after stress has materialized", typically when a Fund-supported program is being designed. Second, the published wording can be shorter than the Board's. For programs with normal access to Fund resources, the guidance says the distinction between the first two verdicts "should be removed" for publication and replaced "with a simple statement that debt is assessed as sustainable". A reader of the published report may therefore see only "sustainable".
What is a debt fanchart?
A debt fanchart is a picture of the range of possible debt paths around the baseline, drawn from the country's own history of shocks. The IMF summarises it in three numbers. The fanchart width "is calculated by subtracting the terminal debt level at the final fanchart’s 95th percentile from the 5th percentile", so it measures uncertainty. The probability of debt non-stabilisation checks, for each simulated path, whether the projected primary balance beats the debt-stabilising level. And the terminal debt level, adjusted for institutions, captures how heavy the burden is at the end of the horizon.
Each tells a different story. A wide fan says the baseline could be badly wrong; a high probability of non-stabilisation is, in the guidance's words, "a key warning that policies are not correctly configured to deliver fiscal and macroeconomic stability"; a high terminal level limits room to cushion the next shock. The guidance asks users to explain any case where the three disagree, which is good practice for an analyst reading a DSA too.
How the IMF and World Bank judge low-income countries
Low-income countries are assessed with the joint IMF–World Bank Debt Sustainability Framework, which, in the World Bank's description, "classifies countries based on their assessed debt-carrying capacity, estimates threshold levels for selected debt burden indicators, evaluates baseline projections and stress test scenarios relative to these thresholds, and then combines indicative rules and staff judgment to assign risk ratings of debt distress" (World Bank, Debt Sustainability Framework). Debt-carrying capacity comes from a composite indicator: weak below 2.69, medium from 2.69 to 3.05, strong above 3.05.
Low-income countries: the debt thresholds rise with debt-carrying capacity
| Debt-carrying capacity | PV of external debt, % of GDP | PV of external debt, % of exports | External debt service, % of exports | External debt service, % of revenue | PV of total public debt, % of GDP |
|---|---|---|---|---|---|
| Weak | 30 | 140 | 10 | 14 | 35 |
| Medium | 40 | 180 | 15 | 18 | 55 |
| Strong | 55 | 240 | 21 | 23 | 70 |
The signals are mechanical and strict. External risk is "High" if any external indicator breaches its threshold under the baseline, "Moderate" if the baseline is clean but at least one indicator breaches under the most extreme stress test, and "Low" if neither happens, over a ten-year projection. The World Bank's page adds the cadence: "A full debt sustainability analysis (DSA) should generally be produced at least once every calendar year. For the IMF, both surveillance (Article IV) and lending (IMF program) should be accompanied by a DSA."
The framework is changing. The World Bank's Board approved reforms on September 15, 2026 that add "a new domestic debt module", aim at "better distinguishing debt stress risk from debt unsustainability" and recalibrate the thresholds; the statement expects the framework "to become operational in the second half of 2027" (World Bank statement, September 2026). Any analyst comparing a country's risk rating across years will need to note which version produced it.
Why DSA baselines run optimistic, and how the IMF checks them
A DSA built on the government's own forecasts tends to look better than reality, and the IMF builds in tools to catch it. The market-access framework includes nine "realism tools" designed to "guard against excessively optimistic projections that might mask looming stress". One compares the projected fiscal adjustment with history: it raises a flag if the projected three-year change in the cyclically adjusted primary balance exceeds the 75th percentile of adjustments across countries from 1990 to 2019, or the country's own largest.
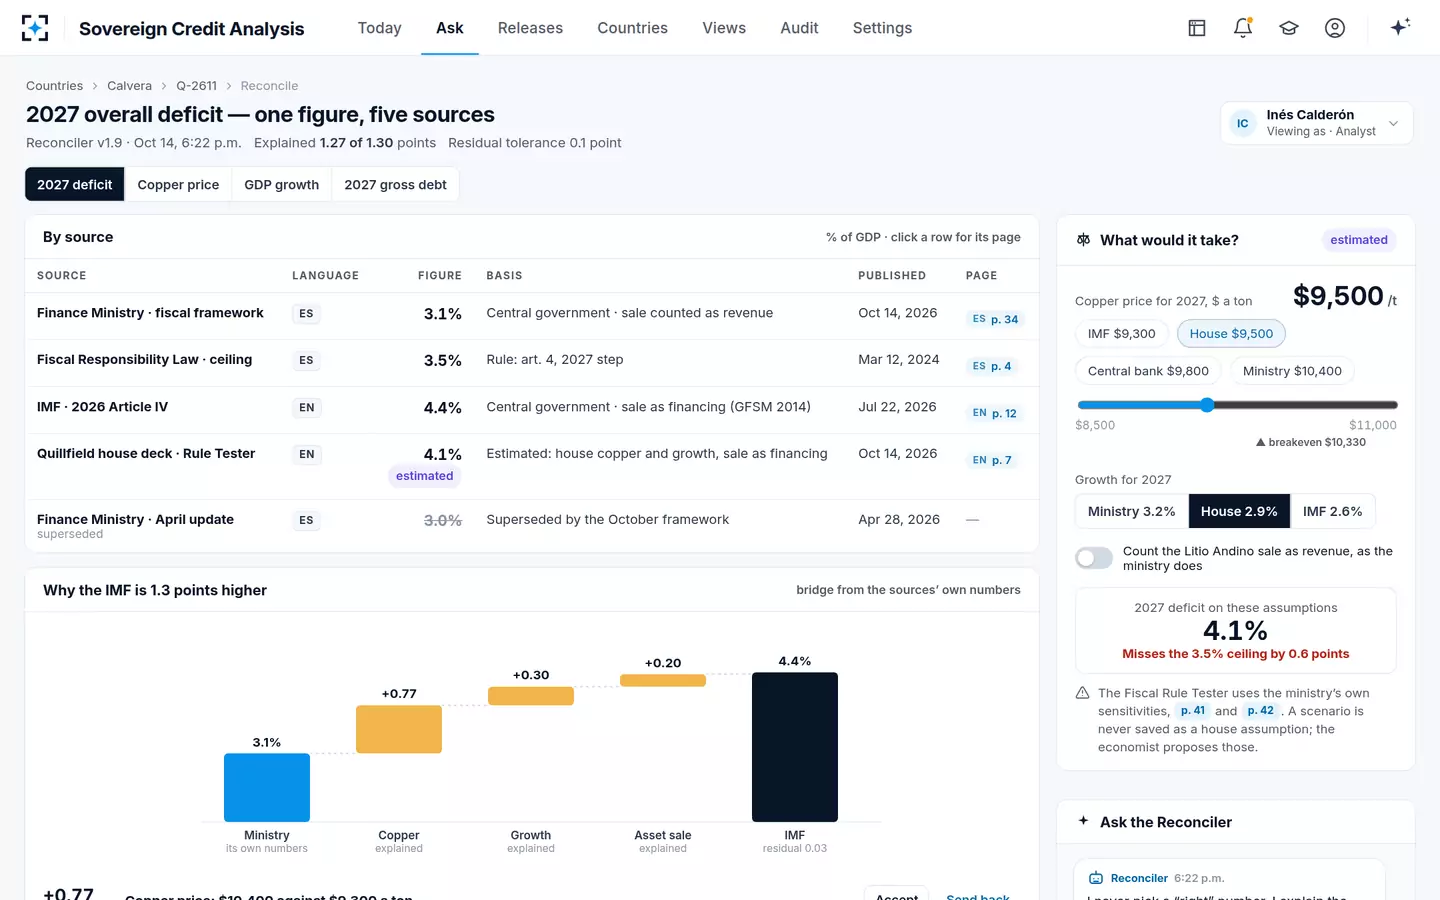
For an analyst, the useful habit is to run the same checks on the government's latest document before the IMF does. In the sample on this page, the fictional Republic of Calvera's new fiscal framework improved its copper and growth assumptions over April's, which alone would lower the 2027 deficit by about 0.45 point of GDP on the ministry's own sensitivities, yet the deficit target rose from 3.0% to 3.1%. The sample analyst sees that before reading a word of commentary, because the change list comes with the release. Last year's promise against the outturn turns that habit into a credibility test.
One figure, five sources in Sovereign Credit Analysis: a DSA input and where each version comes from
Why a DSA verdict matters to bondholders
A DSA verdict matters because it frames how stress is resolved, and a resolution that costs creditors money has a price that lasts. The IMF's guidance says sustainability assessments "help inform the resolution of the stress, including through the design of Fund-supported programs". When the answer involves losses for bondholders, the cost to the country does not end with the deal. Cruces and Trebesch, using a database of investor losses in restructurings "from 1970 until 2010, covering 180 cases in 68 countries", find that "restructurings involving higher haircuts are associated with significantly higher subsequent bond yield spreads" and "longer periods of capital market exclusion", against "the widespread belief that credit markets "forgive and forget."" (Cruces and Trebesch, American Economic Journal: Macroeconomics, 2013).
For a holder of the bonds, two numbers in a DSA deserve the most attention: the gross financing need, because it says how much must be rolled over in the market each year, and the gap between the debt-stabilising primary balance and the one the government actually plans. In the sample, Calvera's gross financing needs for 2027 were unchanged by the new framework at 7.8% of GDP, with $4.5 billion of external issuance, and its debt stayed under its 60% anchor on every count, which is why the sample's verdict was a fiscal-rule miss and not a solvency alarm.
How to do a debt sustainability analysis yourself, step by step
An analyst's own DSA does not need the IMF's templates to be useful. It needs the government's documents, read carefully, and the discipline to state every assumption. The steps below are the ones the IMF's guidance and templates embody, written for a desk.
A desk DSA in eight steps
- Fix the perimeter first
General government, or the broader public sector including state companies and guarantees. The IMF is told to prefer general government "or an even broader definition".
- Build the baseline from the government's own documents
Primary balance, interest, growth, inflation and the exchange rate from the budget and fiscal framework, each with its page.
- Put the IMF's baseline beside it and explain every gap
Definitions, coverage, timing and assumptions. A gap you cannot explain is a finding, not noise.
- Compute the debt-stabilising primary balance
pb* = (r − g) ÷ (1 + g) × d, on the government's assumptions and on your own.
- Project gross financing needs
Deficit plus maturing debt each year, split by currency and by market, against what that market has absorbed before.
- Stress the drivers one at a time, then together
Growth, rates, the exchange rate, a contingent liability. Note which shock breaks the path first.
- Check realism against history
Is the planned fiscal adjustment larger than the country has ever managed, or larger than most countries manage?
- Write the judgment down
What would make you change your mind, in numbers, so the next document can prove you right or wrong.
Steps two and three are where most of the hours go, and where Sovereign Credit Analysis does its work. It does not run the IMF's stochastic templates. It reads the budget, the framework, the debt bulletin and the central bank report in their own languages, takes each figure with its page, unit, year and perimeter, sets them beside the IMF's Article IV figures, and explains the gaps from the sources' own sensitivities. The Fiscal Rule Tester then answers the follow-up questions a DSA raises, such as what copper price keeps the deficit inside the rule.
Asking back in Sovereign Credit Analysis: the breakeven a DSA reader wants
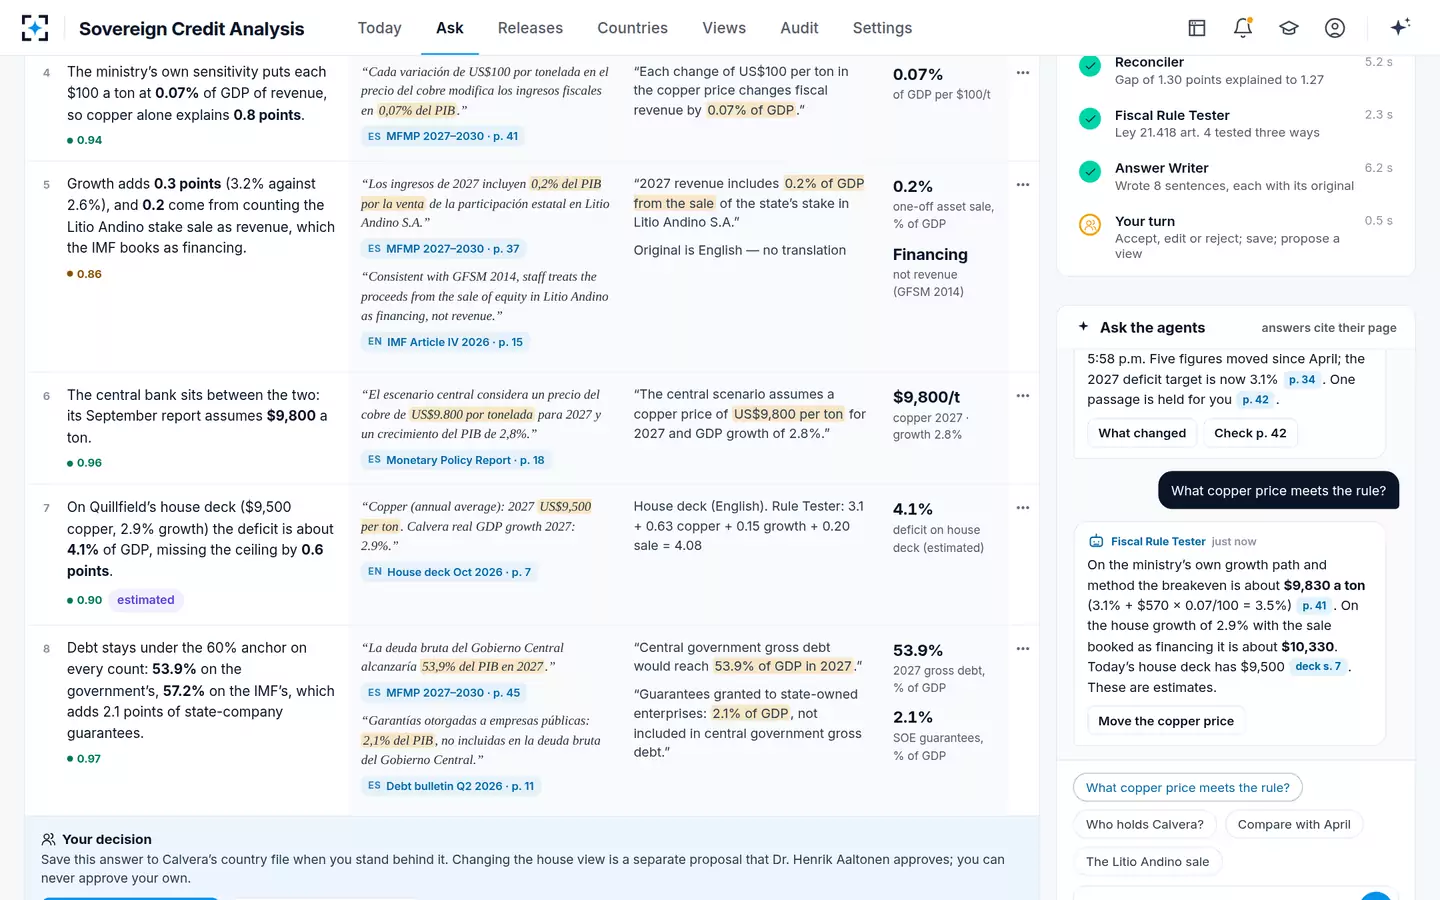
That division of labour suits the method. A DSA's conclusions are only as good as the reading behind its baseline, and the reading is the part a careful agent can do for every country in a book. The judgment, whether a 1.8% primary surplus is politically feasible in this country this year, stays with the analyst. For the figures a DSA rests on, the IMF's 2026 debt table sets out what the latest numbers show.
Questions people ask
Who produces debt sustainability analyses?
IMF staff produce one for every Article IV consultation and every Fund-supported program; for low-income countries the DSA is joint with World Bank staff, and the World Bank needs one each year "to determine the IDA credit-grant allocation". The European Commission runs its own DSA for EU member states under the EU fiscal rules. Investors and rating agencies run their own versions on their own assumptions.
What is gross financing need?
The IMF's Government Finance Statistics Manual 2014 defines gross financing needs as net lending or borrowing "plus debt maturing within that reporting period". It measures how much a government must raise in a year, and a high and rising figure is the clearest early sign of rollover risk, even when the debt ratio looks moderate.
Is debt sustainability the same as a low debt ratio?
No. A country with moderate debt can be at risk if its financing needs are large, its debt is short-term or in foreign currency, or its interest rate exceeds its growth rate by a wide margin. The LIC framework's thresholds also show the reverse: a country with strong debt-carrying capacity can carry a present value of external debt of 55% of GDP against 30% for a weak one.
Are IMF debt sustainability analyses published?
Usually, as an annex to the Article IV staff report or program document, under the IMF's policy that publication is "voluntary but presumed". Some elements are withheld: the IMF said the near-term risk signal and assessment would not be disclosed to the public during the first 12 months of the new market-access framework, and market-sensitive information can be deleted.
How often should a DSA be updated?
At least once a year for low-income countries, according to the World Bank, and with every Article IV and program review for IMF members. For an investor, the better trigger is the document: a new budget, a revised fiscal framework or a debt restatement changes the baseline, and the analysis should change with it.