The debt to GDP ratio by country for 2026, as projected in the IMF's October 2026 World Economic Outlook, ranges from near zero to over 300% of GDP: world general government gross debt is projected at 94.6% of GDP, advanced economies at 107.8% and emerging market and developing economies at 76.2%, up from 69.9% in 2024. Among large emerging markets, Ukraine (111.8%), China (104.4%) and Brazil (97.0%) are highest; Japan (199.4%) remains the most indebted large advanced economy. These figures are general government, gross, and for 2026 they are IMF projections, not outturns, which is the first thing most copies of the table leave out. Botminds' Sovereign Credit Analysis exists for the step after the table: it reads each government's own budget and debt bulletin in the original language and sets its figure beside the IMF's, so an analyst knows why the two differ.
Government debt in 2026, as the IMF projects it
94.6%
world general government gross debt, % of GDP
107.8%
advanced economies
76.2%
emerging market and developing economies, up from 69.9% in 2024
101.5%
world, projected for 2031
What is the debt to GDP ratio by country in 2026?
The IMF's projections for 2026 put general government gross debt above 100% of GDP in a small group of countries and below 60% in most emerging markets. The chart shows 25 emerging-market sovereigns that make up much of a typical EM bond book, in the IMF's October 2026 vintage. The spread is wide: Ukraine, China and Brazil at the top, Türkiye, Peru and Nigeria near the bottom.
Emerging-market government debt in 2026: from 22.5% to 111.8% of GDP
Three cautions apply before any of these numbers goes into a note. They are projections: the IMF marks 2026 as forecast, and the forecast was made before many governments published their 2027 budgets. They are general government, which in some countries is much wider than the central government a budget covers. And they are gross, which ignores the financial assets a government holds; the IMF publishes net debt separately in its Fiscal Monitor.
Which country has the highest debt to GDP ratio?
In the IMF's October 2026 data, Sudan has the highest projected general government debt for 2026, at 334.4% of GDP, followed by Japan at 199.4%, Singapore at 166.4%, Bahrain at 162.8%, Italy at 137.9% and Greece at 136.0%. The United States is projected at 126.8% and France at 118.5%. Among emerging markets the highest are Ukraine, China and Brazil.
The ranking says less about default risk than it seems. Gross debt counts every liability "that require[s] payment or payments of interest and/or principal" regardless of the assets a government holds against it; the IMF's net debt measure subtracts "financial assets corresponding to debt instruments", and on that basis countries with large deposits or funds look very different. Meanwhile some of the countries most visibly in distress are missing from the 2026 column altogether: the October 2026 table has no 2026 projection for Lebanon, Ecuador, Senegal or Afghanistan.
How the table moved: 2024 to 2026
The change matters more than the level for a credit view, and the two-year changes in the IMF's numbers are large in both directions. The full table below gives the 2024 figure, the 2025 estimate and the 2026 projection for the same 25 countries.
General government gross debt, % of GDP: 2024, 2025 estimate and 2026 projection
| Country | 2024 | 2025 | 2026 | Change 2024–26, points |
|---|---|---|---|---|
| Ukraine | 89.7 | 107.1 | 111.8 | +22.1 |
| China | 90.5 | 98.6 | 104.4 | +13.9 |
| Brazil | 87.0 | 93.3 | 97.0 | +10.0 |
| Sri Lanka | 100.2 | 96.8 | 95.2 | -5.0 |
| Egypt | 90.9 | 86.8 | 84.0 | -6.9 |
| India | 84.8 | 84.3 | 83.1 | -1.7 |
| Zambia | 125.5 | 100.6 | 82.1 | -43.4 |
| Hungary | 73.5 | 74.6 | 78.7 | +5.2 |
| South Africa | 76.0 | 78.4 | 78.0 | +2.0 |
| Kenya | 67.3 | 71.3 | 72.9 | +5.6 |
| Pakistan | 70.3 | 72.8 | 69.8 | -0.5 |
| Argentina | 84.6 | 80.1 | 69.3 | -15.3 |
| Poland | 54.8 | 59.7 | 66.6 | +11.8 |
| Morocco | 67.0 | 66.6 | 66.6 | -0.4 |
| Romania | 57.5 | 60.4 | 62.6 | +5.1 |
| Mexico | 59.0 | 61.7 | 62.1 | +3.1 |
| Colombia | 61.0 | 59.9 | 59.5 | -1.5 |
| Côte d'Ivoire | 59.5 | 57.1 | 57.8 | -1.7 |
| Ghana | 70.1 | 48.8 | 51.7 | -18.4 |
| Chile | 41.8 | 41.5 | 42.8 | +1.0 |
| Indonesia | 40.2 | 40.9 | 41.7 | +1.5 |
| Saudi Arabia | 25.9 | 31.8 | 35.4 | +9.5 |
| Nigeria | 39.3 | 36.1 | 34.6 | -4.7 |
| Peru | 32.1 | 30.1 | 28.6 | -3.5 |
| Türkiye | 23.6 | 23.7 | 22.5 | -1.1 |
The largest rises are in Ukraine (+22.1 points), China (+13.9), Poland (+11.8), Brazil (+10.0) and Saudi Arabia (+9.5); the largest falls are in Zambia (−43.4), Ghana (−18.4) and Argentina (−15.3). The table does not say why, and the reasons are very different. A fall of 43 points in two years does not come from fiscal surpluses; it comes from a restructuring, a revaluation of foreign-currency debt or rapid nominal growth, and only the country's own documents and its IMF reports say which. That is the line between a data table and an analysis.
What is general government gross debt?
General government gross debt is everything every level of government owes that must be repaid with interest or principal, before netting off any financial assets. The IMF's definition: "Gross debt consists of all liabilities that require payment or payments of interest and/or principal by the debtor to the creditor at a date or dates in the future", including debt securities, loans, deposits and "insurance, pensions and standardized guarantee schemes"; everything except equity, investment fund shares and derivatives. The same note warns that "Debt can be valued at current market, nominal, or face values" (IMF DataMapper, indicator notes).
Four ways to measure a government's debt, and when each one is the right one
What it counts: All levels of government, all debt liabilities, no assets netted. The WEO headline.
When an analyst should use it: Cross-country comparison, and the IMF's own debt analysis.
What it counts: The national treasury's debt only; what most debt offices report. The IMF's Global Debt Database publishes it separately.
When an analyst should use it: Matching a budget or a fiscal rule written for the central government.
What it counts: Gross debt "minus financial assets corresponding to debt instruments", from the Fiscal Monitor.
When an analyst should use it: Countries with large deposits or sovereign funds, where gross debt overstates the burden.
What it counts: Future payments discounted, so cheap concessional loans count for less than their face value.
When an analyst should use it: Low-income countries borrowing on concessional terms; the basis of the IMF–World Bank thresholds.
Which measure a document uses is rarely in its headline. A finance ministry's medium-term framework may report central government gross debt; the IMF's Article IV, general government; a rule in the law, either. Comparing them without saying so is one of the most common errors in sovereign notes, and why IMF numbers differ from the budget walks through the perimeter question in detail.
What is a safe debt to GDP ratio?
There is no single safe debt to GDP ratio, and the research that proposed one is the best illustration of why. Reinhart and Rogoff's 2010 paper reported that "the relationship between government debt and real GDP growth is weak for debt/GDP ratios below a threshold of 90 percent of GDP" and that above it median growth falls (Reinhart and Rogoff, NBER Working Paper 15639). A peer-reviewed re-examination found "selective exclusion of available data, coding errors and inappropriate weighting of summary statistics", and that countries above 90% "averaged 2.2% real annual GDP growth, not −0.1% as published" (Herndon, Ash and Pollin, Cambridge Journal of Economics, 2014).
What the research does support is that safe levels differ by country. Reinhart, Rogoff and Savastano's work on "debt intolerance" found that countries with a history of default and high inflation run into trouble at debt levels advanced economies carry easily, with safe external debt thresholds for some of them far below the levels in this table (NBER Working Paper 9908). The official frameworks build that in: the IMF–World Bank framework for low-income countries sets benchmarks for the present value of total public debt at 35%, 55% or 70% of GDP depending on a country's debt-carrying capacity, and the EU's fiscal rules start from a 60% of GDP reference value with a 3% deficit (Regulation (EU) 2024/1263).
Official reference points for government debt, and what each one actually measures
| Reference point | Level | Measured as | Applies to |
|---|---|---|---|
| EU Treaty reference value | 60% of GDP | General government gross debt | EU member states, with the 3% deficit reference value |
| LIC DSF benchmark, weak capacity | 35% of GDP | Present value of total public debt | Low-income countries with weak debt-carrying capacity |
| LIC DSF benchmark, medium capacity | 55% of GDP | Present value of total public debt | Medium capacity |
| LIC DSF benchmark, strong capacity | 70% of GDP | Present value of total public debt | Strong capacity |
Is debt to GDP a good measure of sovereign risk?
Debt to GDP is a good measure of how large the burden is and a poor measure, on its own, of whether a government will pay. Default history is concentrated in a way the ratio does not predict. The Bank of Canada and Bank of England's sovereign default database estimates US$437 billion of sovereign debt in default in 2025, "or 0.4% of global public debt", across 80 sovereigns, with "Just 3 sovereigns—Venezuela, Russia and Lebanon" accounting for 55% of it, and "Debt in default among advanced economies remained at zero" (Bank of Canada, BoC–BoE Sovereign Default Database, 2026). Advanced economies, which hold several of the highest ratios in the IMF's table, had none in default.
What predicts trouble better is how the debt has to be financed: how much falls due each year, in which currency, held by whom, and at what interest rate relative to growth. Those are the questions a debt sustainability analysis asks, and how the IMF reaches its verdict takes them one at a time. The ratio is the start of that analysis, not its conclusion.
How does the IMF project debt?
IMF debt projections apply the debt accumulation identity year by year: next year's debt is this year's plus the deficit, adjusted for exchange-rate revaluation and other flows that do not pass through the budget, all divided by projected nominal GDP. The inputs are IMF staff's own projections for growth, inflation, interest rates, the exchange rate and the primary balance, which is why an IMF debt projection can differ from a government's even when both start from the same stock.
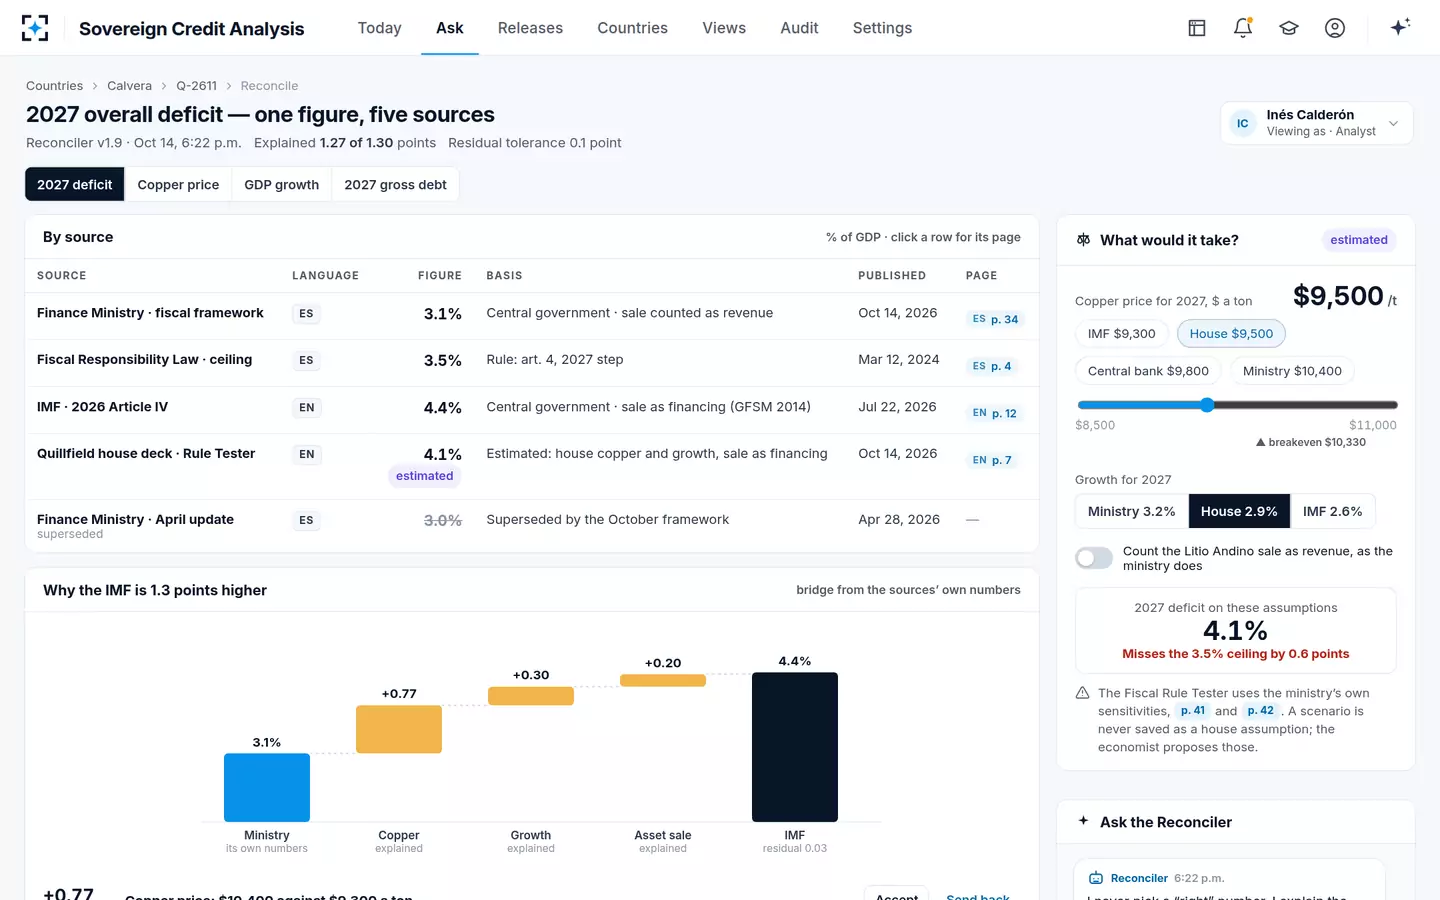
A government's medium-term framework does the same arithmetic on its own assumptions. In the fictional sample in Sovereign Credit Analysis, the Republic of Calvera's new framework raised its own 2027 gross debt projection from 53.1% to 53.9% of GDP between April and October; the IMF's projection, on a wider perimeter that includes state-company guarantees, was 57.2%. Neither number is wrong. Each is a projection on stated assumptions, and the analysis is in the difference.
One figure, several sources in Sovereign Credit Analysis: the sample country side by side
Where to download IMF debt data
The IMF publishes its debt data free on the DataMapper and in the World Economic Outlook database. The headline series is "General government gross debt" (GGXWDG_NGDP) from the WEO, updated in each new vintage, most recently October 2026. The Fiscal Monitor adds net debt, the primary and overall balances and cyclically adjusted balances. The Global Debt Database adds central government debt and private debt, so a reader can see the perimeter difference directly. For defaults, the Bank of Canada publishes the BoC–BoE database annually.
From the IMF table to the budget: where Sovereign Credit Analysis starts
Downloading the table takes a minute. Explaining the number for one country, from its own documents, takes days by hand, which is where Sovereign Credit Analysis does its work: the Reconciler lays the government's figure beside the IMF's with the page for each, and marks any gap it cannot explain within 0.1 point of GDP for a person to look at.
Questions people ask
What is the world debt to GDP ratio?
The IMF's October 2026 World Economic Outlook puts world general government gross debt at 94.0% of GDP in 2025 (an estimate) and projects 94.6% for 2026 and 101.5% for 2031. The Bank of Canada's 2026 note reports the IMF's estimate that the stock reached a record US$111 trillion in 2025.
Why is there no 2026 figure for some countries?
The October 2026 table simply leaves those cells empty: it has no 2026 projection for Lebanon, Ecuador, Senegal or Afghanistan, and the data do not say why. The country's own IMF documents usually explain the circumstances, and a gap like that is itself worth a line in a country file.
Is gross or net debt better?
Gross debt is better for comparing countries and for financing risk, since it is what must be repaid or rolled over. Net debt, gross debt minus matching financial assets, is better for countries with large deposits or funds, where it shows the true burden. The IMF's own definitions note that reported net debt can deviate from the standard "on the basis of available information and national fiscal accounting practices".
Why does a country's debt ratio fall sharply?
Large falls usually come from something other than fiscal surpluses: a debt restructuring, high inflation raising nominal GDP, or an exchange-rate appreciation shrinking foreign-currency debt in local terms. The IMF's table shows the result, not the cause, so read the country's Article IV report or debt office documents before treating a fall as an improvement.
Is the EU's 60% debt limit a safe level?
It is a reference value written into the EU Treaty's excessive deficit protocol, not an estimate of safety. Under Regulation (EU) 2024/1263, member states above 60% of debt or 3% of deficit get a country-specific reference trajectory based on debt sustainability analysis, which is a more useful test than the threshold itself.