Repossessed cars sell at wholesale, not retail, and on one lender's ninety days they fetched 97.2% of the wholesale guide value across every channel it used — 96.4% in the physical auction lane, 98.1% online from the recovery lot and 96.9% on a dealer's firm bid. But that is the price, and the price is not the money. Between a guide number and the cash a lender banks sit three separate gaps: the gap from the described vehicle to this one, the gap from this one to the channel and date it is sold in, and the gap taken by the costs of selling it. Botminds' Repossessed Vehicle Remarketing opens all three before the car is listed, which is also the only way to check afterwards whether the decision was right.
The lender in the worked examples is fictional — Harlow Ridge Auto Finance, 186 repossessed cars on four lots — and the figures on its screens are sample data. The market series and the outcome data come from the federal statistical agencies, linked where they appear.
The question behind the question: which number do you mean?
"How much do repossessed cars sell for" has at least five answers, and most arguments about recovery are really arguments about which one is being quoted. The wholesale guide value is a published estimate for a described vehicle in average condition. The as-is value is that estimate adjusted for this car. The expected price is what this car should fetch in a particular channel on a particular date. The sale price is what it did fetch. The net proceeds are what is left after the costs of selling it, and that is the only figure that reduces the loan, because the statute applies "the reasonable expenses of retaking, holding, preparing for disposition, processing, and disposing" before anything else (UCC § 9-615(a)).
Quoting the wrong one is not a rounding error. On the truck below the guide value and the banked cash differ by $2,445 — nine per cent — and every dollar of that difference is either a fact about the car or a decision somebody made.
Three gaps between a guide value and the money a lender banks, on one truck
Wholesale guide value
A 2021 F-150 XLT SuperCrew 4x4, average condition, 52,000 miles
$27,200
Gap one — this car, not the described one
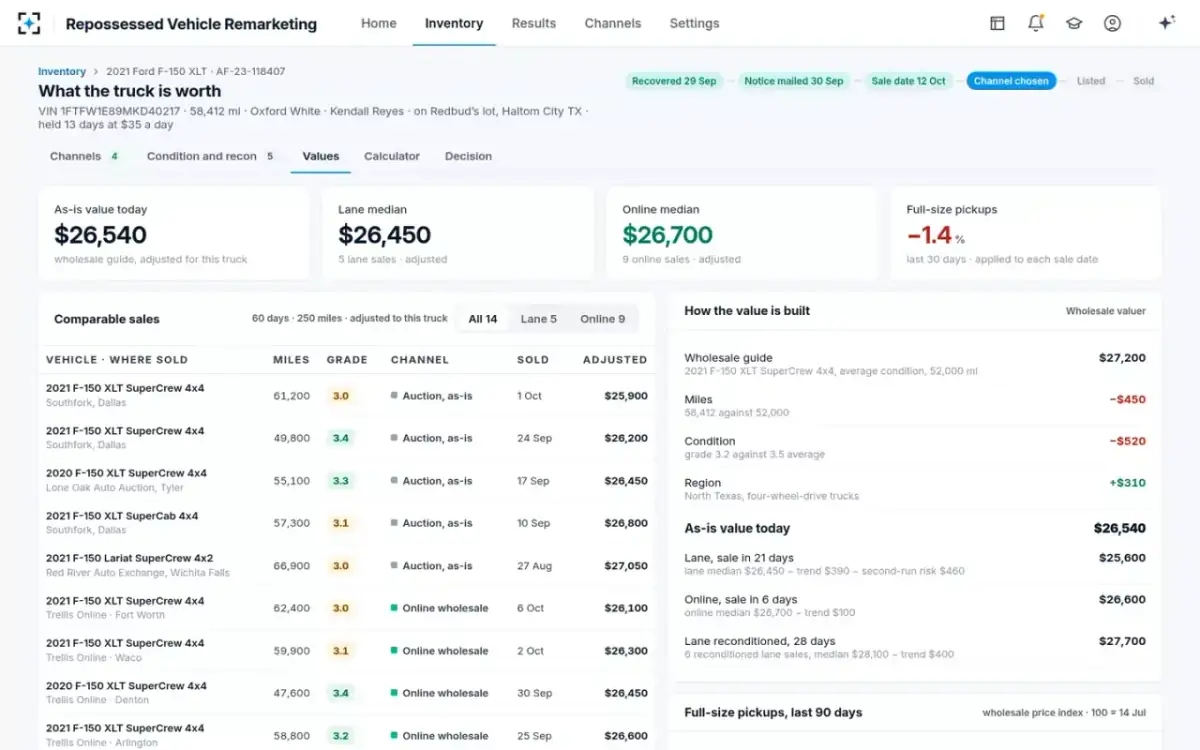
Miles 58,412 against 52,000 −$450 · condition grade 3.2 against 3.5 −$520 · North Texas four-wheel drive +$310
−$660
$26,540
Gap two — this channel, on this date
Lane median $26,450 for five comparable sales, less $390 for the market trend out to a sale 21 days away and $460 for the risk it does not sell on its first run
−$940
$25,600
Gap three — the costs of the sale
Seller fee −$245 · transport to the lane −$185 · storage for 21 more days −$415
−$845
$24,755
What the lender banks
63.6% of the $38,940 owed, twenty-one days after the decision
−$2,445 against the guide
$24,755
Gap one: from the guide to this car
A wholesale guide value describes a vehicle, not a car. It assumes a year, a model, a trim, a drivetrain, average condition and a mileage band. The car on the lot differs from that description in ways that are individually small and collectively large, and the adjustment is arithmetic once each difference is named.
On the sample truck there were three. Mileage: 58,412 against the guide's 52,000, worth −$450. Condition: a grade of 3.2 against an assumed 3.5, worth −$520, built from five items a field inspector photographed — a fourteen-inch windshield crack, front bumper scuffs, two front tyres at 3/32 of an inch, a missing second key and interior soiling. Region: four-wheel-drive full-size pickups do better in North Texas than the national average, worth +$310. Net, −$660, and an as-is value of $26,540.
The discipline that matters here is that each adjustment has a source a reader can check. A condition grade derived from photographs is checkable; a grade a clerk typed is not. That is the practical difference between a value and a number, and it is why the way the valuation is built, step by step matters more than the figure it ends on.
Gap two: from this car to this channel
The same truck is worth different amounts in different places on different dates, and for two reasons that compound. The first is who bids. Comparable sales for this truck over sixty days within 250 miles split into five lane sales with a median of $26,450 and nine online sales with a median of $26,700 — the online pool is national, and full-size pickups travel. The second is when. A sale twenty-one days away is priced into a market that has moved; full-size pickups were down 1.4% over thirty days, so the lane price carried a −$390 trend adjustment and the online price, six days out, carried only −$100.
A third deduction belongs here and is usually left out: the chance the car does not sell on its first run. In this lender's lane, 58% of cars sell the first time they are offered; the rest sit a week, pay another week of storage, and go again with a history. Pricing a lane plan as though every car sells on the first run overstates the lane by the cost of that risk — here, $460.
The same truck, priced for the lane and priced for the online sale
Physical auction lane, 21 days out: Five lane sales in sixty days within 250 miles, median $26,450
Online wholesale from the lot, 6 days out: Nine online sales in sixty days within 250 miles, median $26,700
Physical auction lane, 21 days out: −$390, at −1.4% over thirty days for full-size pickups
Online wholesale from the lot, 6 days out: −$100, for a sale fifteen days sooner
Physical auction lane, 21 days out: −$460; 42% of this lender’s lane cars do not sell on the first run
Online wholesale from the lot, 6 days out: Not priced; 71% sell on the first run and the car stays on the recovery lot if it does not
Physical auction lane, 21 days out: $25,600
Online wholesale from the lot, 6 days out: $26,600
Physical auction lane, 21 days out: Seller fee $245 · transport $185 · storage $415
Online wholesale from the lot, 6 days out: Seller fee $395 · inspection $65 · storage $210
Physical auction lane, 21 days out: $24,755, in 21 days
Online wholesale from the lot, 6 days out: $25,930, in 6 days
Gap three: from the hammer to the bank
The third gap is the one every seller knows about and few comparisons hold constant. The lane charges a seller fee and needs the car brought to it; the online sale charges a higher fee and an inspection but needs no transport; the dealer's firm bid charges nothing because the dealer collects the car. And underneath all of them storage runs, at a rate that changes depending on who is holding the car and for how many more days.
Because these costs are paid out of the proceeds before the loan is touched, they are also part of the borrower's arithmetic — a point set out in how a deficiency balance is built. A cheaper sale that takes three more weeks is not cheaper.
Price to guide, measured across 745 sales
One sale tells you nothing. A quarter of sales, grouped by channel, tells you a great deal — and the one metric that travels between lenders is price against the guide value for the same car, because it normalises for the market.
Price as a share of the wholesale guide value, by channel, over ninety days
Two readings, and both are useful. The reconditioned line is the only one above the guide, which is what you would expect — the car being sold is no longer the car the guide described. And the spread between the best as-is channel and the usual one is 1.7 points of guide value — about $450 on a truck guiding at $27,200, before the fee and storage differences are counted at all. Multiply by 745 sales a quarter and the channel question stops being a detail.
The caution is the mix. This lender moved from no online sales at all to 58% of channel choices in five weeks, and the cars it moved first were the ones the comparison said would gain most — trucks and four-wheel drives with national demand. A channel's price-to-guide figure measured on a selected set of cars is not the figure it would achieve on all of them. Any claim of this shape has to be read with the question "on which cars?" attached.
Why a single sale price proves nothing
The statute makes the same point in its own register: "The fact that a greater amount could have been obtained by a collection, enforcement, disposition, or acceptance at a different time or in a different method from that selected by the secured party is not of itself sufficient to preclude the secured party from establishing that the … disposition … was made in a commercially reasonable manner" (§ 9-627(a)). A single result sits inside a distribution. On the sample truck the online channel's expected price of $26,600 carried a tenth-to-ninetieth percentile range of roughly $25,690 to $26,830; a sale at $26,100 is an ordinary draw, not a failure.
The market itself moves enough to swamp a single comparison. The federal consumer price index for used cars and trucks peaked at 216.876 in February 2022 and stood at 182.176 in September 2026, sixteen per cent below the peak (BLS series CUSR0000SETA02, via FRED). Month to month it moved by an average of 0.65% in absolute terms over the two years to September 2026 — and by 1.84% in January 2026 alone. It is a retail index and the only published one a reader can check without a vendor subscription; the wholesale market it stands in for is noisier still. A lender comparing one lane sale against one online sale three weeks apart is largely measuring that.
What the market move does explain is the outcome. When used-car prices rose, mean deficiency balances in the Consumer Financial Protection Bureau's study of 905,000 disposals fell 27% to $7,692 by September 2021; when they fell, mean deficiencies rose 47% to $11,340 by the end of 2022 (CFPB, Repossession in Auto Finance, January 2025). Sale prices follow the market. Channel decisions are the part a lender owns.
The value built from fourteen comparable sales, and three prices from it
How to replay your own closed sales
The only honest test of a channel recommendation is to run it over sales that have already happened, where the answer is known and cannot be argued with. The method below is a back-test, and it is deliberately unflattering: the model is given only what was known on the day of the decision, and is scored against what the car actually did.
A replay of closed sales, step by step
| Step | What to do | What it guards against |
|---|---|---|
| 1. Choose the set | Every car sold in a trailing quarter, not a sample. Three hundred sales is enough to split by channel; a hundred is not. | Choosing the cars that suit the answer. A sample picked after the fact measures the picker. |
| 2. Freeze the inputs | For each car, assemble only what existed on the decision date: the condition report and photographs, the comparable sales available then, the fee schedules in force then. | Hindsight. A comparable sale that happened after the decision cannot be in the comparison. |
| 3. Price every channel | Produce an expected price and a full cost stack for every channel that was open, not just the one that was used. | Scoring only the road taken. The question is whether a different channel would have done better. |
| 4. Score the channel that was used | Compare the predicted net for the chosen channel against the actual net. Record the error, signed, per car. | Averaging away a bias. A model that is $300 high on every car is not accurate; it is consistently wrong. |
| 5. Score the channel that was not | For cars where the model would have chosen differently, compare its predicted net against the actual net of the channel used. | Claiming a gain nobody can see. The counterfactual is an estimate and has to be labelled as one. |
| 6. Split by segment and by month | Report error by body style, price band, grade band and month, not as one average. | A single mean that hides a channel that works for trucks and fails for small sedans. |
Two results from a replay are worth more than any demonstration. The first is the distribution of the error on the channel that was used — its median, its spread, and whether it is centred on zero. The second is how often the model would have chosen a different channel, and by how much it says that would have paid. If the answer to the second is "rarely, and by little", the comparison is not worth buying however accurate the prices are.
What a good replay looks like, and what it must not do
What a replay has to control for before its numbers mean anything
- Only information available on the decision date
Comparable sales, fee schedules, market trend and the condition report as they stood that day. A back-test that sees the future is a demonstration, not a test.
- The whole quarter, including the cars that went badly
No-sales, second runs, cars pulled for title problems and cars redeemed before sale all belong in the denominator.
- Costs as they were actually billed
Compare the modelled cost stack with the invoices. A fee schedule a quarter out of date moves the ranking before it moves the price.
- The counterfactual labelled as an estimate
What the car would have fetched in the channel it did not go to is a model output. Present it with its range, never as a measured result.
- Segments reported separately
Body style, price band, condition grade and region. A channel that is excellent for trucks and poor for compact sedans averages to unremarkable.
- Mix held constant when comparing periods
Recovery improved because the channels improved, or because the cars improved. Hold the mix and recompute before claiming the first.
The last line is the one that catches most claims, including claims about this solution. A lender whose recovery rate rose from 39.6% in September to 41.8% in October has not shown that its channel decisions are working, because the market also moved and the mix also moved. Showing it requires the sales to be grouped by channel and compared with a plan set before each sale — which is a different report, and a different argument.
The myth that the auction price is the market price
The most durable mistake in this area is treating a lane result as the market's verdict on the car. A dealer-only lane on a Thursday is one set of buyers in one place with one week's demand. The same truck offered to a national online pool the following Tuesday meets a different set. Neither is "the market price"; both are prices from a market, and the difference between them is the thing worth measuring.
The statute agrees, in its own way: a used vehicle is not sold on a "recognized market" with "widely distributed standard price quotations", which is why a lender cannot lean on the price alone and has to be able to explain the method — the real test a repossession sale has to pass. A price-to-guide figure by channel, measured on your own sales, is the nearest thing to an answer that exists, and it is one a lender can produce from records it already has.
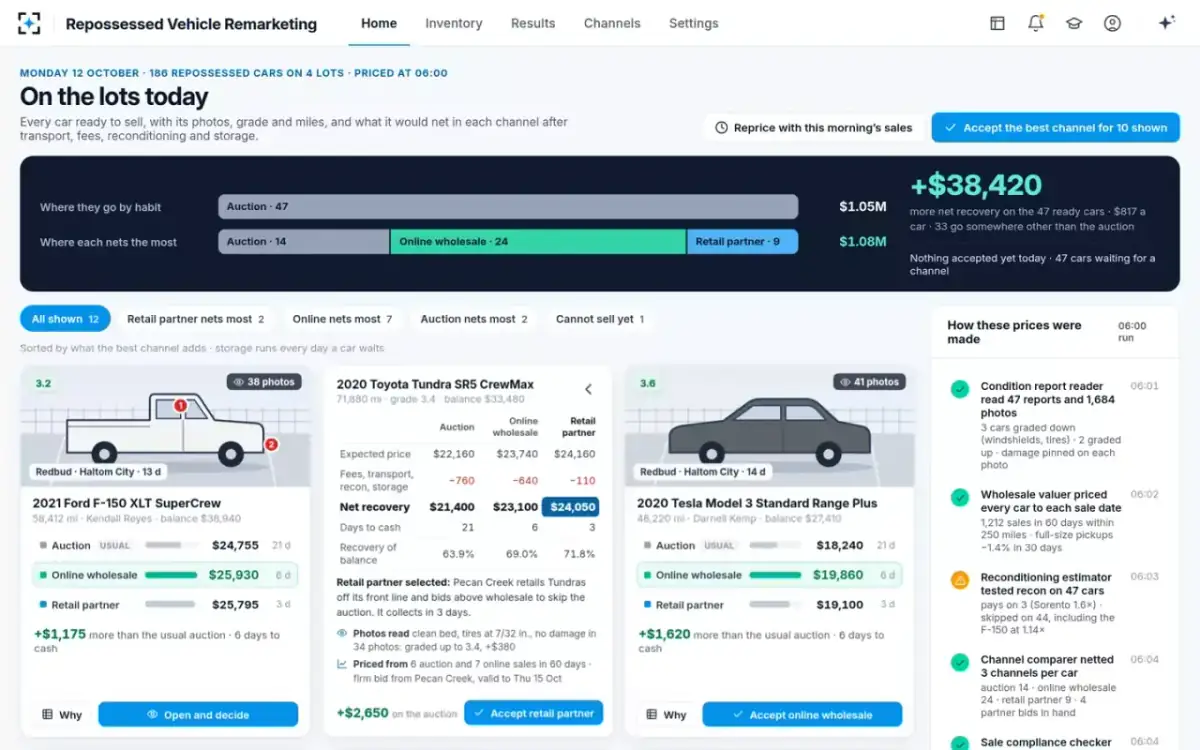
One card, flipped: the whole waterfall behind a single number
To price your own recent repossessions in every channel and replay what actually happened, start from Repossessed Vehicle Remarketing.
Questions people ask
Do repossessed cars sell below market value?
They sell at wholesale, which is below retail by the margin a dealer needs — but close to wholesale guide value, not far below it. On the sample lender's ninety days, sales averaged 97.2% of the wholesale guide across all channels, ranging from 96.4% in the physical lane to 101.2% for cars reconditioned first. The large gap a borrower notices is usually the retail-to-wholesale gap, not a failure of the sale.
What percentage of book value do repossessed cars sell for?
Ask which book and which channel. Measured against a wholesale guide value adjusted for mileage and condition, the sample lender's channels ran from 96.4% to 101.2%, with an average of 97.2% over 745 sales in ninety days. Measured against a retail book value, the same sales would look far worse, because they are not retail sales. Price to guide is only comparable when the guide and the adjustments are stated.
Why do repossessed cars sell for less than similar used cars?
Three reasons, and only one of them is condition. They are sold wholesale, to dealers who have to make a margin on the resale. They are sold as-is with the damage disclosed, without the reconditioning a retail car gets. And they are sold on a schedule set by a notice period and a storage clock, rather than when the market is strongest. Condition matters too, but a well-kept repossessed car still sells wholesale.
What is a first-run sale rate, and why does it matter?
It is the share of cars that sell the first time they are offered. On the sample lender's figures it ran from 58% in the physical lane to 71% online and 88% at salvage. It matters because a car that does not sell sits another week, pays another week of storage, and is offered again to buyers who have already passed on it. A channel comparison that ignores first-run risk flatters the channel with the lowest rate.
Does a car sell for more online or at a physical auction?
On this lender's ninety days, online wholesale beat the physical lane by 1.7 points of guide value and fifteen days. That is not a universal result. Online sales reward vehicles whose condition can be shown in photographs and whose buyers are national — trucks, four-wheel drives, electric vehicles — and penalise cars whose problems do not photograph. The only way to know for your own book is to replay your own closed sales by segment.
How do you check whether a channel choice was right?
Replay it. Take a trailing quarter of closed sales, give the model only what was known on each decision date, price every channel that was open, and compare the predicted net for the channel used against what the car actually netted. Then report how often the model would have chosen differently and what it says that would have been worth — labelled as an estimate, because the car was only sold once.