An auto loan recovery rate is the share of what was owed on a defaulted loan that the lender gets back from selling the vehicle — net proceeds over balance — and as a single portfolio number it is close to useless for managing anything. It moves when used-car prices move, which no lender controls; it moves when the mix of channels moves, which every lender controls; and it moves when the denominator is chosen differently, which is an accounting decision nobody outside finance ever sees. The index worth building is not one line but five, split by sale channel and read against a plan set before each sale. This guide sets out the arithmetic, the three denominators, the mix trap, and what a monthly report has to carry — using the series Repossessed Vehicle Remarketing keeps for a fictional sample lender.
The figures below are sample data on a fictional lender, Harlow Ridge Auto Finance, used to show the shape of the series. They are not a customer result, and nothing in them should be read as evidence that any software improves a recovery rate — a point this guide returns to, because the months shown moved for at least three reasons at once.
41.8%
recovery in October to date, against a plan of 39.5% set before the sales
64cars
sold so far this month, netting $0.78M across five channels
9.8–46.1%
the spread between the worst and best channel in the same month
9days
median to cash — 22 at the lane, 7 online, 3 on a retail partner’s bid
What an auto loan recovery rate is, and what it is not
It is a ratio of money recovered to money owed, on loans where the collateral was taken and sold. It is not a measure of how well the recovery operation is run, and treating it as one is the mistake this whole guide exists to prevent.
The reason is that at least three independent things move it, and only one of them is a decision. The used-vehicle market sets what any car is worth. The composition of the defaults — how new the cars are, how much equity was in them, which credit tiers — sets how much was owed against them. And the channel each car is sent to sets how much of that value survives the costs of selling. A portfolio rate adds all three together and reports a single number, which is why a rate that went up is not news until somebody has said which of the three moved.
It is also not loss given default, though the two are often used interchangeably. Loss given default is the share of exposure not recovered from all sources, including payments made after the sale on any remaining shortfall. A collateral recovery rate stops at the sale. On a book where very few deficiency balances are ever collected the two are close; where collections are effective they are not, and conflating them double-counts the same dollars.
How do you calculate recovery rate on repossessed vehicles?
A recovery rate, written out on one car
Net proceedssale price − seller fee − transport − inspection − reconditioning − storage until the money arrives$25,930
Balance owedprincipal + accrued interest + fees, struck on a stated date — here, the day the car was taken$38,940
=
Recovery rate, this car
66.6%
The $25,930 is also this car’s plan: it is the expected net at the channel chosen, fixed before the sale, so the variance afterwards measures execution. A month is the sum of the numerators over the sum of the denominators — never the average of the rates.
The last line in that box is worth dwelling on, because it catches careful people. On the sample lender's October figures, averaging the five channel rates by car count gives 41.1%; the portfolio rate on the same sales is 41.8%. Neither is wrong. The portfolio figure weights each car by what was owed on it, so expensive cars count for more; the car-weighted average treats a $47,000 Tahoe and a $1,180 salvage sale as one vote each. A report that shows both without saying which is which invites an argument nobody can win.
The denominator argument: balance at repossession, or at charge-off?
Three denominators are in common use, they answer different questions, and a lender that has not written down which one it uses is comparing months that are not comparable.
Three denominators, three different questions
| Denominator | The question it answers | What it hides | Who usually wants it |
|---|---|---|---|
| Balance at repossession | Of what was owed when we took the car, how much did we get back? | Nothing about timing: it is fixed on the day of recovery, so a slow sale shows up as a lower rate rather than a smaller denominator | The recovery desk, because it is the only one the desk can be held to |
| Balance at charge-off | Of what we wrote off, how much came back? | Speed and accruals: a balance that kept growing while the car waited makes a slow operation look as though it recovered less of more | Finance, because it ties to the loss actually taken |
| Collateral value less cost to sell | Did the car fetch what we said it would? | The loan entirely: a car can fetch exactly its estimated value and still leave a large shortfall | Valuation and audit, under the classification policy |
The third row has a regulatory anchor. Under the federal banking agencies' retail classification policy, a closed-end retail loan 120 cumulative days past due is classified Loss and charged off, with a concession that a loan with non-real-estate collateral may instead be "written down to the value of the collateral, less cost to sell", where repossession is assured and in process (FFIEC Uniform Retail Credit Classification and Account Management Policy). That phrase — value less cost to sell — is the same net figure the desk ranks channels on, which is a good reason for the two functions to use one set of numbers rather than two.
There is a fourth question lurking underneath all three: what population is in the denominator at all. The Consumer Financial Protection Bureau's study of nine lenders found that in September 2022 "27 percent of accounts assigned to repossession were completed, a decrease from the completion of 38 percent of repossession assignments when compared to September 2019" (CFPB, Repossession in Auto Finance, January 2025). A rate computed over completed repossessions is computed over a subset that is itself moving — and the accounts that resolve before completion are not a random sample of the ones that do not.
Why one number hides five
Split the same month by channel and the single figure stops being a summary and starts being a question.
One month, five channels: 9.8% to 46.1% on the same book
Three readings come straight off the bars, and none of them is available from the portfolio number.
The reconditioned route has the highest rate on the smallest volume — five cars. That is what a rule working looks like: reconditioning is tested on every ready car and passes on very few, so the cars that go through a shop are selected to be the ones where it pays. A reconditioned-lane rate that stayed at 46% while its volume quadrupled would be the surprising result, and the one to go looking for.
Salvage at 9.8% is not an underperforming channel. It is a different population — cars that do not run or carry a salvage title — and including it in a portfolio average quietly penalises any month with more of them. It belongs in the series, reported separately, never blended.
And the two big channels sit 7.3 points apart on 50 of the month's 64 cars. That gap is the entire subject of the remarketing desk — the four channels a repossessed car can go to, each net of every cost.
October to date, by channel: cars, average net, against plan, days, recovery
| Channel | Cars | Average net | Against plan | Days to cash | Recovery |
|---|---|---|---|---|---|
| Online wholesale | 29 | $14,820 | +1.6% | 7 | 44.9% |
| Auction, as-is | 21 | $8,940 | −0.9% | 22 | 37.6% |
| Retail partner | 7 | $11,120 | 0.0% | 3 | 41.3% |
| Auction, reconditioned | 5 | $17,260 | +0.4% | 27 | 46.1% |
| Salvage auction | 2 | $1,180 | −4.2% | 12 | 9.8% |
| All channels | 64 | $12,250 | +0.9% | 9 | 41.8% |
The mix problem: a rate can rise while every channel gets worse
This is the failure mode that makes an unsplit series actively misleading, and it is easiest to see worked on one month's numbers.
Every channel one point worse, and the portfolio rate goes up
Online wholesale
As it was29 cars · 44.9%
One point worse40 cars · 43.9%
Auction, as-is
As it was21 cars · 37.6%
One point worse10 cars · 36.6%
Retail partner
As it was7 cars · 41.3%
One point worse7 cars · 40.3%
Auction, reconditioned
As it was5 cars · 46.1%
One point worse5 cars · 45.1%
Salvage
As it was2 cars · 9.8%
One point worse2 cars · 8.8%
Car-weighted recovery, 64 cars
As it was41.1%
One point worse41.4%
Nothing in that table is a trick. The mix genuinely improved — more cars went to the better channel — and that improvement was worth more than a point of deterioration everywhere. The problem is that the single number cannot tell the two apart, and a lender reading it will congratulate a desk whose execution got worse, or blame one whose execution improved while its mix was dragged around by what happened to arrive.
The cure is the split, and one more column: the plan. A per-channel rate says how each channel did. A per-channel variance against the net that was expected before the sale says whether the sale beat what the evidence predicted, which is the only part of the series that is about the operation at all.
Setting the plan before the sale, not after
A plan here is not a budget. It is the expected net recovery at the channel chosen, computed from the car's valuation and that channel's fee schedule, on the day the channel was chosen — the same figure the person approving the sale saw. It is written down before the outcome exists, which is what makes the comparison afterwards worth anything.
Three properties make a plan usable. It is per car, so the month is the sum of sixty-four separate predictions rather than one aggregate guess. It uses the channel actually chosen, so it measures execution rather than the choice — the choice is measured separately, by comparing the chosen channel's plan with the others'. And it is frozen: a plan that is updated when the market moves measures nothing, because it will always have been right.
What the lender then gets is a variance per sale, with a reason attached. On the sample lender's recent sales: a 2015 Honda Accord netting $7,350 against a plan of $7,100, +3.5%, "two bidders above the reserve"; a 2019 RAV4 at +1.8%, "bought by a dealer in Phoenix"; a 2017 Equinox at −3.9%, "no sale on the first run; sold on the second"; a 2020 Explorer at +1.3%, "in line with plan". Four facts about an operation, not four numbers.
Reading a month: 64 cars, five channels
One month, read the way it has to be read: by channel, against plan
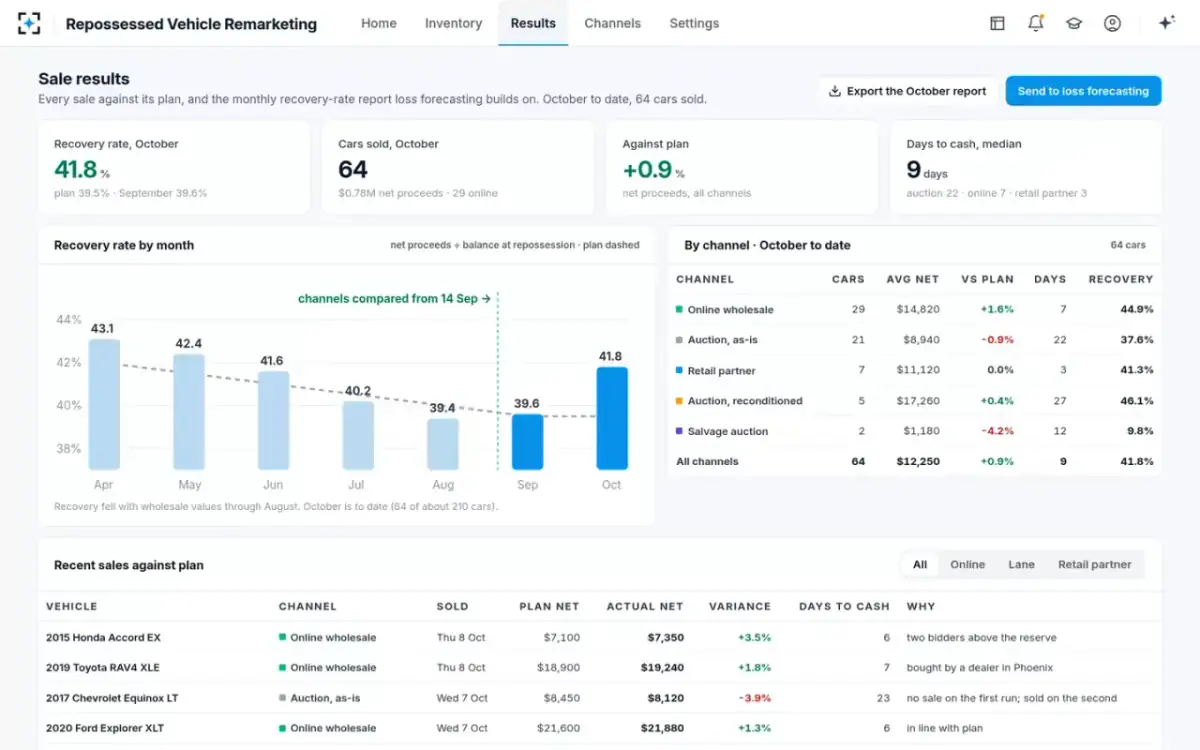
The monthly line on that screen runs 43.1, 42.4, 41.6, 40.2, 39.4, 39.6, 41.8 from April. It is tempting, and wrong, to read the last two months as the effect of comparing channels from 14 September. Three things changed across those months and the series cannot separate them: the market, the mix of cars arriving, and the channel decisions.
The market is the one that can at least be checked against something published. The federal consumer price index for used cars and trucks stood at 179.822 in April 2026 and 182.176 in September, a rise of 1.3%, having moved by less than a point in either direction in every month between (BLS series CUSR0000SETA02, via FRED). A portfolio rate that fell 3.5 points across those same months was therefore not simply following that index. That does not prove the fall was operational: the index is retail and the wholesale market a repossessed car is sold into is noisier, and the mix of cars arriving moved too. It proves only that "the market did it" is a claim requiring evidence, not an explanation available for free.
Why did our recovery rate fall?
Answer it in this order, and most months resolve in an hour.
First, the denominator. Did the balances change — newer cars, longer terms, more negative equity rolled in, or a change in when the balance is struck? A denominator that grew will lower the rate with no change in anything the desk did.
Second, the mix. Recompute the month with last month's channel shares and this month's channel rates. If the recomputed figure matches last month, the fall is mix, and the next question is why the mix moved — more salvage, more cars with no title, fewer dealer bids in hand.
Third, the channels themselves. With mix held constant, which channel's own rate fell, and by how much? A fall concentrated in one channel is an operational question — a fee schedule changed, a lane's buyer depth thinned, a reserve rule is biting.
Fourth, and last, the plan variance. If every channel is still beating the net it was expected to produce, then the fall is in what the cars were worth, not in how they were sold. That is the point at which the honest answer is "the market", and by then it has been earned rather than assumed.
A wrong channel, priced
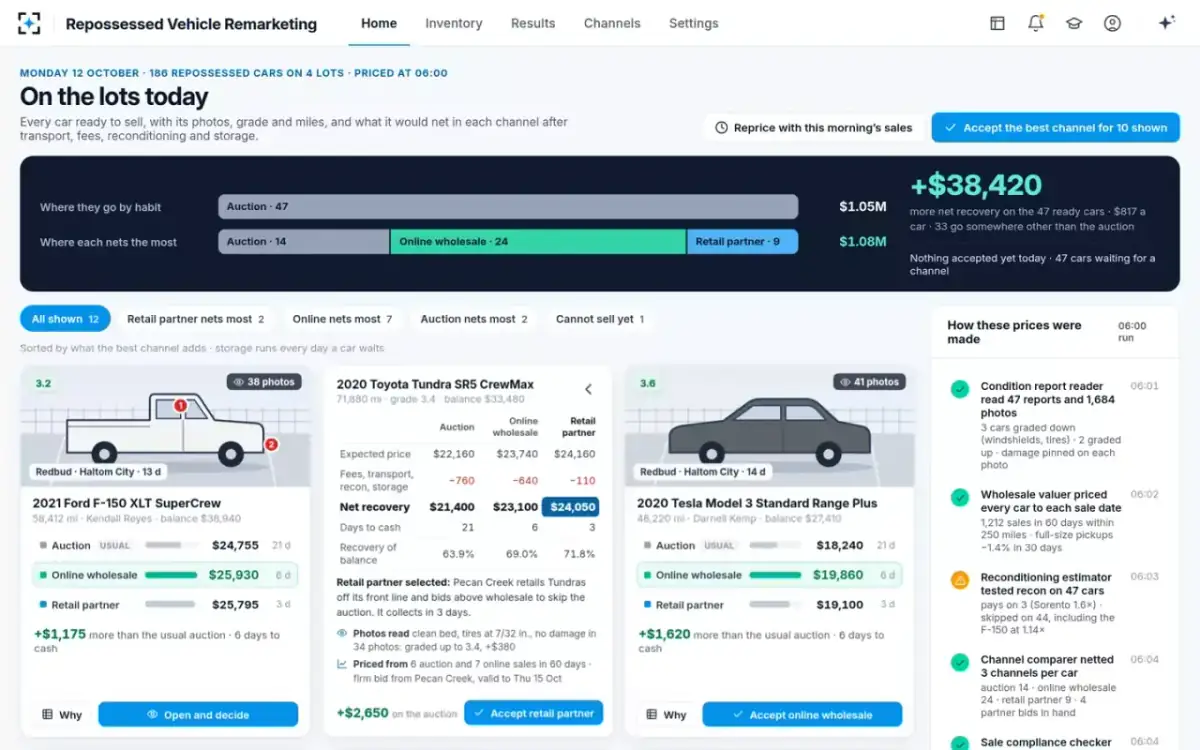
The series also puts a number on the cost of a single bad channel call, which is the figure that justifies measuring any of this. On the sample truck, the lane plan netted $24,755 and the online plan $25,930 — $1,175, or 3.0 points of recovery on a balance of $38,940, with cash in six days instead of twenty-one.
One car at 3 points is a rounding error. The same decision across a month is not: the sample lender's own morning comparison found $38,420 across forty-seven ready cars, $817 a car, with 33 of the 47 netting more somewhere other than the default auction. On a book running roughly 210 cars a month, $817 a car is close to three points of recovery, month after month — which is exactly the size of move an unsplit monthly series would hand to the used-car market without an argument.
The waterfall behind one car's contribution to the month
What should a monthly recovery report show?
Six things, and almost no commentary.
The portfolio rate with its denominator stated on the figure itself, not in a footnote. The same rate split by channel, with car counts, because a 46% rate on five cars and a 38% rate on twenty-one are different kinds of fact. The variance against plan per channel, which is the only column that measures the desk. Days to cash per channel, median rather than mean, because the tail of unsold cars is what a mean hides. The mix, as a share of cars and a share of balance, so a reader can do the mix arithmetic themselves. And the exceptions: every sale that missed its plan by more than a set margin, with its reason.
What does not belong is a claim. A month's series is not evidence that a process change worked, because the market and the mix moved at the same time, and neither is controlled. The honest way to make that claim is a replay — price a trailing quarter of closed sales using only what was known on each decision date, and score the predicted net against what each car actually fetched — the method, step by step, and what it has to control for.
To see a month split by channel and read against plan on a lender's own sales, start from Repossessed Vehicle Remarketing.
Questions people ask
What is the recovery rate on an auto loan?
The net proceeds of selling the vehicle divided by the balance owed, expressed as a percentage. "Net" means after the seller fee, transport, inspection, reconditioning and storage — the same expenses Article 9 applies before anything reduces the balance. "Owed" has to be dated: most recovery desks use the balance on the day the car was taken, finance often uses the balance at charge-off, and the two produce different numbers on identical sales.
What is a good recovery rate on repossessed cars?
There is no portable benchmark, and a vendor quoting one is quoting something that has not been measured on comparable books. The rate depends on how much was owed against the cars, which depends on loan-to-value at origination, term, age at default and how much negative equity was rolled in — none of which is a property of the recovery operation. The comparison that does mean something is your own rate by channel against a plan set before each sale.
How do you measure recovery by channel?
Keep the channel with each sale and never blend. For each channel, report cars, net proceeds, the balance behind them, the resulting rate, the variance against the plan set before the sale, and the median days to cash. Report salvage separately always: those cars do not run, so including them in an average penalises any month that happens to contain more of them.
What is loss given default on auto loans?
The share of exposure ultimately not recovered, from every source — the vehicle sale and anything subsequently collected on the remaining shortfall. A collateral recovery rate is narrower: it stops at the sale. Where very little of the deficiency is ever collected the two converge; where collections are effective they do not, and using one as a proxy for the other double-counts the same dollars.
How do you set a recovery plan by month?
Not as a target handed down. Build it from the bottom: each car's expected net recovery at the channel chosen, taken from the comparison on the day it was chosen, divided by the same balance the actual rate will use. The month's plan is the sum of those. Freeze it — a plan revised when the market moves measures nothing, because it will always turn out to have been right.
Does a rising recovery rate mean the channel decisions are working?
Not on its own. A portfolio rate can rise while every single channel gets worse, if the mix shifts towards the better channels — worked on the sample lender's October figures, one point off every channel plus eleven cars moved from the lane to the online channel raises the car-weighted rate from 41.1% to 41.4%. The only reading that isolates the decisions is the per-channel variance against a plan set before each sale, with the mix shown separately.