A quality of earnings report is a financial due diligence report that tests whether a company's earnings are real, repeatable and supported by cash, so that a buyer or lender can price the business on them. It rebuilds reported EBITDA from the trial balances, rules on each adjustment management proposes, adds the adjustments management left out, measures normal working capital and lists the debt-like items that come off the equity value. The work is hard because each section answers a different price question from a different part of the books, usually inside an exclusivity window. Botminds' Quality of Earnings Analysis exists to put that work into the deal team's hands before the price is anchored: agents rebuild and test every line, and an associate and a QoE lead sign each ruling.
The examples below come from a fictional sample deal as it runs through the solution: Project Lantern, in which Quillfield Capital Partners IV is buying Halvorsen Industrial Services, an Ohio field-services company with subsidiaries in Germany and Mexico. Its management presents adjusted EBITDA of $29.19 million on fourteen add-backs, and the letter of intent sits at 10.0x, or $291.9 million. Definitions and research are from the SBA, the SEC and peer-reviewed journals, each linked at the point it is used.
One sample QoE in four numbers
$18.19M
reported LTM EBITDA, rebuilt from 125 monthly trial balances
sample deal
$29.19M
management-adjusted EBITDA in the CIM, on 14 add-backs
sample deal
$22.8M
adjusted EBITDA once the largest ruling is signed
sample deal
$33.1M
proposed working capital peg, against management's $29.8M
sample deal
What is a quality of earnings report?
A quality of earnings report is the buyer's answer to one question: what will this business earn, in a normal year, under its new owner? In 2026 a federal agency wrote a definition into its rulebook. The Small Business Administration's SOP 50 10 8.1, effective October 1, 2026, defines it as financial due diligence on how reliable, sustainable and accurate a business's past and projected earnings are (SBA, SOP 50 10 8.1, Appendix 15). It requires one for 7(a) change-of-ownership loans, initial acquisitions and business expansions, where the purchase price is $3 million or more.
The SBA's definition is written for its own loan program, but its three words, reliability, sustainability and accuracy, map onto the sections of any buy-side report. Accuracy is the rebuild: do the numbers in the offering memorandum come from the books? Reliability is the evidence behind each adjustment. Sustainability is the recurrence test: will a cost that management calls one-time come back next year?
There is no single correct answer to what "quality" means, and the academic literature says so outright. Reviewing the measures researchers use, from persistence to accruals to restatements, Dechow, Ge and Schrand conclude that "quality" is "contingent on the decision context" (Journal of Accounting and Economics, 2010). A buyer's decision context is narrow: a price, set as a multiple of one year's earnings, and paid once. That is why a QoE report reads so differently from an audit report, a subject the guide on quality of earnings vs audit takes up in full.
What does a quality of earnings report show? Six sections, six price questions
A quality of earnings report shows six things, and each one moves a different part of the price. The order below is the order in which they are usually built, because each depends on the one before it.
Six sections of a quality of earnings report, each feeding the price
Agent
1 · Reported EBITDA, rebuiltMonthly EBITDA rebuilt from the trial balances and general ledger, tied to the audited statements and to the CIM. Answers: is the starting number in the books?
Never: changes a reported number; it shows every variance instead.
A person decides
2 · Management's add-backs, ruledEach claimed add-back accepted, adjusted or rejected, with its evidence and a reason. Answers: which adjustments survive?
A person decides
3 · Adjustments management did not proposeCut-off errors, missing accruals and reserves, related-party terms. Answers: what did the seller leave out?
Agent
4 · Net working capital and the pegMonthly working capital on the purchase agreement's definition, with candidate pegs. Answers: how much working capital must be delivered at closing?
Agent
5 · Debt-like itemsObligations that are not borrowings but will cost the buyer cash. Answers: what comes off enterprise value on the way to equity?
A person decides
6 · The databook and the signed numberThe tables behind every figure, released only once each ruling is signed. Answers: what goes into the deal model and the investment committee papers?
The SBA's rulebook lists much the same ground. The report "must identify and document all add-backs and adjustments to the seller's reported earnings, including non-recurring revenue or expenses, above- or below-market owner compensation, related-party transactions, deferred maintenance, and accounting methodology differences between cash-basis and accrual-basis reporting" (SOP 50 10 8.1). It also asks for something many buyout reports skip: a cash proof that reconciles bank statements to the income statement and tax return, covering the latest twelve months and the two fiscal years before them.
Section 1: reported EBITDA, rebuilt and tied out
The first section rebuilds the starting number from the company's own books and proves that it ties. EBITDA has a precise meaning in the SEC staff's usage: the 2003 release they cite describes it as "earnings before interest, taxes, depreciation and amortization," and the staff add that "'Earnings' means net income as presented in the statement of operations under GAAP" (SEC non-GAAP C&DI 103.01). A private company's EBITDA is not bound by that guidance, but the discipline is the same: start from net income in the books, not from a subtotal in a slide.
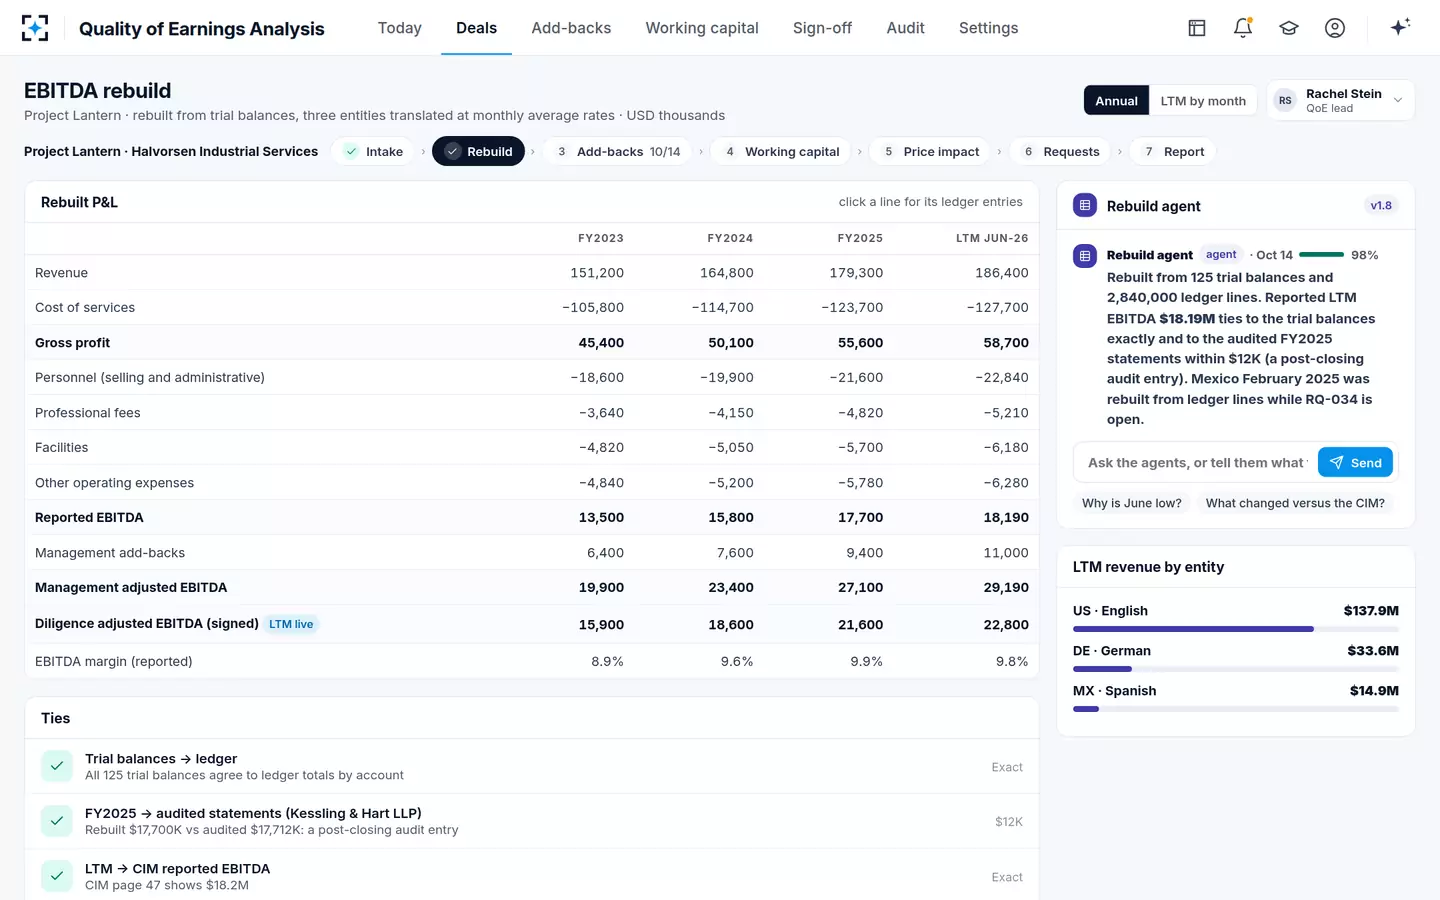
In practice the rebuild is monthly, because the later sections need months: the recurrence test reads an account period by period, and the working capital peg is an average of monthly balances. On the sample deal the Rebuild agent read 2.84 million general-ledger lines across three entities, January 2023 to June 2026, translating the German and Mexican books at monthly average rates.
Three EBITDA lines, four periods: the bridge a QoE report starts from
| USD thousands | FY2023 | FY2024 | FY2025 | LTM Jun-26 |
|---|---|---|---|---|
| Revenue | 151,200 | 164,800 | 179,300 | 186,400 |
| Reported EBITDA | 13,500 | 15,800 | 17,700 | 18,190 |
| Management add-backs | 6,400 | 7,600 | 9,400 | 11,000 |
| Management-adjusted EBITDA | 19,900 | 23,400 | 27,100 | 29,190 |
| Diligence-adjusted EBITDA | 15,900 | 18,600 | 21,600 | 22,800 |
| Add-backs as a share of reported EBITDA | 47% | 48% | 53% | 60% |
Read the last row before anything else. Management's "one-time" add-backs rose every year, from 47% of reported EBITDA to 60%. A business whose one-time costs grow faster than its earnings has recurring costs with a different label, and a QoE report that shows the bridge by year makes that visible on one page.
The tie-outs are what make the rebuild usable. On the sample deal all 125 trial balances agree to the general ledger by account, FY2025 ties to the audited statements within $12,000 (a post-closing audit entry), and the LTM figure ties exactly to the reported EBITDA on page 47 of the CIM. A report that cannot show those three ties has not established its starting point, and every later section inherits the doubt.
The rebuild: reported, claimed and signed EBITDA, with the ties beneath
Section 2: management's add-backs, ruled one by one
The second section is the one buyers read first: every adjustment management made to reach its adjusted EBITDA, with a ruling on each. In the SEC's vocabulary those adjustments make adjusted EBITDA a non-GAAP financial measure, defined as a numerical measure of performance that "Excludes amounts, or is subject to adjustments that have the effect of excluding amounts," included in the comparable GAAP figure (17 CFR 244.101). The SEC's rules bind public registrants, not a private target, yet they are the clearest public statement of what makes an adjustment acceptable, and QoE teams borrow their logic.
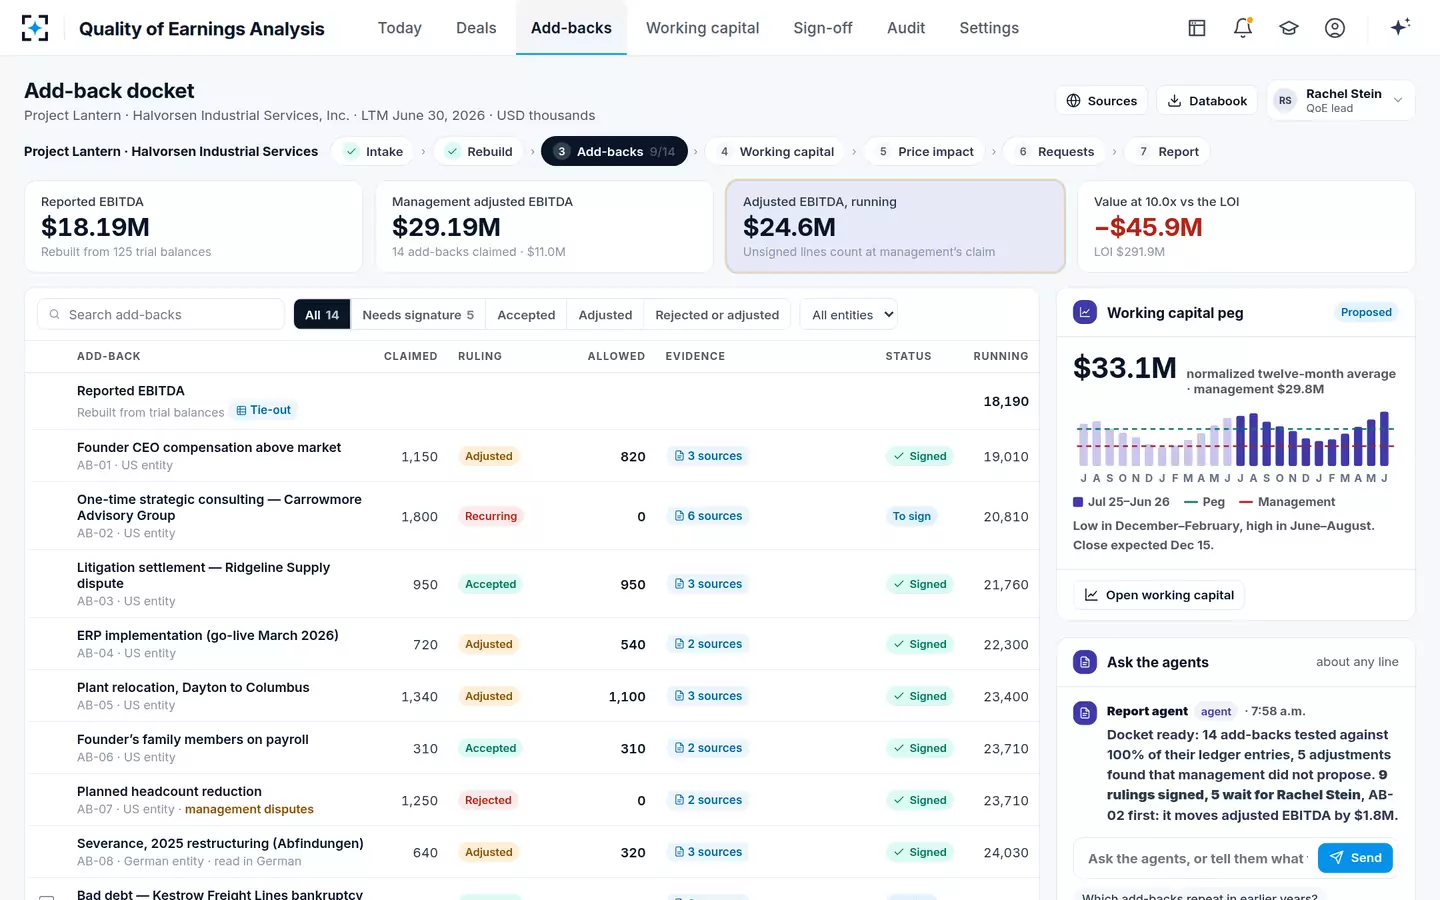
A good add-back section shows, for each line, the amount claimed, the ruling (accepted, adjusted or rejected), the amount allowed, the evidence and a running total. On the sample deal, fourteen add-backs worth $11.0 million go in; the signed rulings allow $4.04 million of them so far, and four small ones, $1.74 million, wait for the QoE lead's signature. The largest single ruling rejects $1.8 million of "one-time strategic consulting" that the Recurrence agent found billed in each of the last eleven quarters.
Why the evidence matters more than the label is a research finding, not a matter of taste. Doyle, Lundholm and Soliman studied the expenses companies excluded from pro forma earnings as non-recurring or unimportant and found that "Higher levels of exclusions lead to predictably lower future cash flows" (Review of Accounting Studies, 2003). Which add-backs tend to survive that test, and which do not, is the subject of EBITDA add-back examples, scored against the evidence.
The add-back docket: one line per claim, the ruling and the running total
Section 3: the adjustments management did not propose
The third section is where a buyer's report differs most from a seller's: adjustments that lower EBITDA, which no seller volunteers. Typical ones are revenue recognised before the goods left (a bill-and-hold cut-off), bonuses accrued below what will be paid, missing inventory or bad-debt reserves, and related-party terms that are not at market, such as rent paid to the founder below the market rate.
On the sample deal the agents found five, net −$1.17 million: a June bill-and-hold cut-off, an under-accrued 2025 bonus, a missing inventory reserve in Mexico, below-market rent on the founder's building and a prior-year audit fee. At 10x, those five are worth $11.7 million of enterprise value, more than any single add-back except the consulting contract.
Research explains why this section has to be built from the books rather than from management's schedule. McVay found evidence "consistent with managers opportunistically shifting expenses from core expenses" to special items, which "does not change bottom-line earnings, but overstates 'core' earnings" (The Accounting Review, 2006). The same move, at a private company, turns a recurring cost into an add-back. Only a reading of the accounts themselves, not of the bridge in the CIM, finds it.
Section 4: net working capital and the peg
The fourth section measures how much working capital the business needs in a normal month, because the purchase agreement will usually require the seller to deliver that amount at closing. It is built on the draft agreement's own definition, monthly, and it ends in a proposed peg: the target against which the closing balance is trued up, dollar for dollar.
On the sample deal the Working Capital agent proposes $33.1 million: the twelve-month average to June 2026 of $33.56 million, less $460,000 of items that are not operating (a transaction bonus accrual, a receivable from the founder and income taxes). Management proposed $29.8 million by treating $3.3 million of contract spare parts as "non-operating". The parts are bought for and billed to customers, so they belong in the peg, and the difference is $3.3 million of price. The full method, including why the choice of months can matter more than any single add-back, is in how a net working capital peg is calculated.
Section 5: debt-like items
The fifth section lists obligations that are not bank debt but will cost the new owner cash, so they come off enterprise value on the way to the equity cheque. Customer deposits for work not yet performed, accrued but unpaid bonuses, deferred capital expenditure and unpaid taxes are the usual families. On the sample deal the agents list five items worth $6.8 million, the largest being $2.1 million of customer deposits on service contracts.
Debt-like items are not in EBITDA at all, which is why they are easy to miss in a report organised around the add-back bridge. They change the equity price as surely as an add-back does, and a QoE report that stops at adjusted EBITDA has left a column of the price unpriced.
What is in a QoE databook?
The databook is the set of tables behind the report: every figure in the narrative, laid out so another analyst can re-perform it. A complete databook holds at least the monthly profit and loss by entity, the reported-to-adjusted EBITDA bridge by year, an add-back schedule with evidence references, the adjustments management did not propose, monthly net working capital with the peg options, the debt-like items schedule, and the cash proof that ties bank deposits to revenue.
The quality test for a databook is simple: can each cell be traced to a source page or a general-ledger query? A databook pasted together from management's schedules fails that test even if every number in it is right, because nobody can show that it is. On the sample deal each databook cell links to its source, and the Report agent drafts the report and databook from signed rulings only.
"The QoE analysis must reconcile the business's accountant-prepared financial statements, tax returns, internal financial statements, and IRS transcript data to produce a normalized, adjusted earnings figure that reflects recurring, arm's-length operations."
SBA, SOP 50 10 8.1, Appendix 15 (effective October 1, 2026)
How long is a quality of earnings report, and who reads it?
No regulator or professional body publishes a standard length, and advisers do not publish typical page counts. What sets the length is the number of entities, the number of add-backs and how far the adjusted figure sits from the reported one. A single-entity business with three clean add-backs needs a short narrative; a three-entity group with fourteen claims, two foreign charts of accounts and a disputed peg needs a section per entity and a page per material ruling.
The readers decide the shape more than the page count. The deal partner and the investment committee read the summary: reported, claimed and diligence-adjusted EBITDA, the rulings that move the price most, the peg and the debt-like items. Lenders read the adjusted figure that goes into their coverage test. Under the SBA's rule the lender has to take the QoE's earnings into its debt service coverage calculation (SOP 50 10 8.1). The associate, the QoE lead and the adviser read the databook, because that is where a ruling is defended.
Ten checks to run on any quality of earnings report you are handed
- The starting EBITDA ties three ways
Trial balances to the general ledger, the audited year to the audited statements, and the LTM to the offering document.
- The bridge is shown by year, not just for the LTM
Add-backs that grow every year are recurring costs with another name.
- Every add-back has a ruling and an allowed amount
Accepted, adjusted or rejected, never "noted".
- Each ruling names its evidence
Invoices, contracts, payroll, minutes, not management's description.
- Recurrence was tested over several years
At least the full period in the databook, by account and by vendor.
- There is a section for adjustments management did not propose
A buyer's report with none is unusual.
- The peg uses the purchase agreement's definition
And shows the months behind it, with seasonality.
- Debt-like items are listed with their source
Deposits, accruals, deferred capex, taxes.
- Cash is reconciled to revenue
A cash proof, at least for the LTM.
- The report states what it is not
A QoE is not an audit and gives no opinion; it should say so.
A report that passes all ten has done its job, whoever wrote it. One that fails the first three is a summary of management's numbers, however long. The way to get a report that passes is to start it before the price is fixed, which is the argument of the quality of earnings process, and why the price is set before it ends.
Questions people ask
What is a quality of earnings report used for?
It is used to set and defend a price: the buyer applies a multiple to diligence-adjusted EBITDA, adjusts for the working capital peg and subtracts debt-like items. Lenders use the same adjusted figure in their coverage tests; the SBA, for its 7(a) acquisition loans of $3 million or more, requires the lender to use the QoE's earnings in its debt service coverage calculation.
What does a quality of earnings report look like?
It usually opens with a one-page summary of reported, management-adjusted and diligence-adjusted EBITDA, followed by sections on the rebuild, each add-back, adjustments the seller did not propose, working capital and debt-like items, and a databook of supporting tables. On the sample deal the summary reads: reported LTM EBITDA $18.19 million, management's $29.19 million, the signed figure $22.8 million.
Is a quality of earnings report the same as a QoE databook?
No. The report is the narrative and the conclusions; the databook is the tables behind them, laid out so each figure can be re-performed. A report without a traceable databook asks the reader to trust the conclusions rather than check them.
Does a quality of earnings report include projections?
The core of a QoE is historical: the last two or three fiscal years and the trailing twelve months. The SBA's definition also mentions "projected earnings", and many reports comment on run-rate adjustments, but a well-built report keeps pro forma items, such as savings from a headcount cut after the LTM, apart from historical add-backs, as the sample deal does with a $1.25 million run-rate saving.
Who writes a quality of earnings report?
Usually a transaction advisory team of accountants engaged by the buyer, the seller or, under the SBA's rules, the lender, which requires that the report "must not be prepared by or for the seller". Some buyers also build a first cut in-house, with their own associates proposing rulings and a QoE lead signing them, before the adviser's report arrives.