The Texas ratio compares a bank's problem assets with the money that would absorb them if those assets went bad: non-performing loans plus foreclosed property on top, tangible common equity plus the allowance for credit losses underneath, expressed as a percentage. It is a crude measure that asks a question the regulation itself asks — how do problem asset totals compare with capital — and it is exactly as honest as the grades, appraisals and modification tests behind its numerator. Botminds' Problem Loan Management keeps one current page for every troubled loan, with each line cited to the document it came from, which is where a ratio like this one either earns its credibility or quietly loses it.
This guide works the ratio twice: once on the whole US banking industry from the FDIC's published quarterly figures, and once on a fictional sample bank, Calder Plains Bank, whose watch list runs through the solution. Then it sets out what the number cannot see. One caution before the arithmetic: no banking agency publishes the Texas ratio or sets a threshold for it, so any level quoted against it is an analysts' convention rather than anything official.
The published inputs, second quarter 2026
172.7%
allowance for credit losses against noncurrent loans, all FDIC-insured institutions
145.6%
the same coverage at community banks, down 73 basis points on the quarter
47banks
on the FDIC’s problem bank list, 1.1% of all banks — inside the 1–2% the FDIC calls normal outside a crisis
1.44%
of loans 30 or more days past due or in nonaccrual status across the industry
What is the Texas ratio, and how do you calculate it?
The calculation has two steps. Add up what is going wrong; add up what would absorb it; divide the first by the second. A result of 50% means problem assets equal half the cushion; 100% means they equal all of it, which is why analysts treat that line as the one worth noticing, though no regulator has made it a rule.
The Texas ratio, term by term
Non-performing loans
Loans 90+ days past due, plus loans in nonaccrual status
The FDIC’s "noncurrent loans and leases" is exactly this sum, which makes the published figure usable without adjustment.
From the bank’s own regulatory filing
Other real estate owned
+ Foreclosed property held on the balance sheet
Property the bank has taken and not yet sold. Some versions of the ratio leave it out; say which you used, because it moves the answer.
From the balance sheet
Tangible common equity
÷ (Equity capital − goodwill and other intangibles − preferred stock)
The capital that could actually take a loss. Strip the intangibles: they are the first thing to disappear when a bank is in trouble.
From the balance sheet
Allowance for credit losses
+ The reserve already set aside against those loans
Already recognised as a cost, so it belongs in the cushion — provided it was set on honest grades.
From the allowance disclosure
Worked on the industry's published aggregates for the second quarter of 2026, the arithmetic goes like this. Noncurrent loans and leases were $129.7 billion and other real estate owned $4.9 billion, so the numerator is $134.6 billion. Bank equity capital was $2,624.8 billion; subtracting $462.3 billion of goodwill and other intangibles leaves $2,162.5 billion, and adding the $223.9 billion allowance for credit losses gives a cushion of $2,386.4 billion. The ratio is 5.6%. (The FDIC's aggregate does not split out preferred stock, so this tangible figure still contains it; a bank-level calculation should take it out.)
Run the looser version — equity capital as reported, intangibles left in — and the same quarter gives 4.7%. The gap between 5.6% and 4.7% on identical underlying facts is the whole reason to ask which recipe a quoted ratio used. At an individual bank carrying goodwill from an acquisition, the gap is far wider than it is across the industry.
Where each number comes from in a bank's own filings
Three of the four inputs sit on the balance sheet and one on the loan schedule, and all four are public. The column that matters most, though, is neither the figure nor its location but its age — because each of the four is current as at a quarter end while the facts behind it may be very much older.
Where each number comes from, and how stale it can be
| Input | Where it is published | How old the facts behind it can be |
|---|---|---|
| Noncurrent loans and leases | The bank’s quarterly regulatory filing; aggregated by the FDIC each quarter. The FDIC defines the noncurrent rate as the share of loans "past due 90 days or more or that are in nonaccrual status". | Up to a quarter old as published — but the grades underneath can be far older, because a loan is only noncurrent once somebody has stopped accruing it. |
| Other real estate owned | The balance sheet, as foreclosed property. | Carried at the lower of cost or fair value less costs to sell; the valuation behind it may be a year old or more. |
| Equity capital and intangibles | The balance sheet. | Current as at the quarter end, and the least ambiguous of the four. |
| Allowance for credit losses | The allowance disclosure; the FDIC publishes the reserve coverage ratio against noncurrent loans each quarter. | Current, but derived from the same internal grades as the numerator — so an optimistic grade shrinks the top and the bottom of the ratio at once. |
Worked again, on one bank's watch list
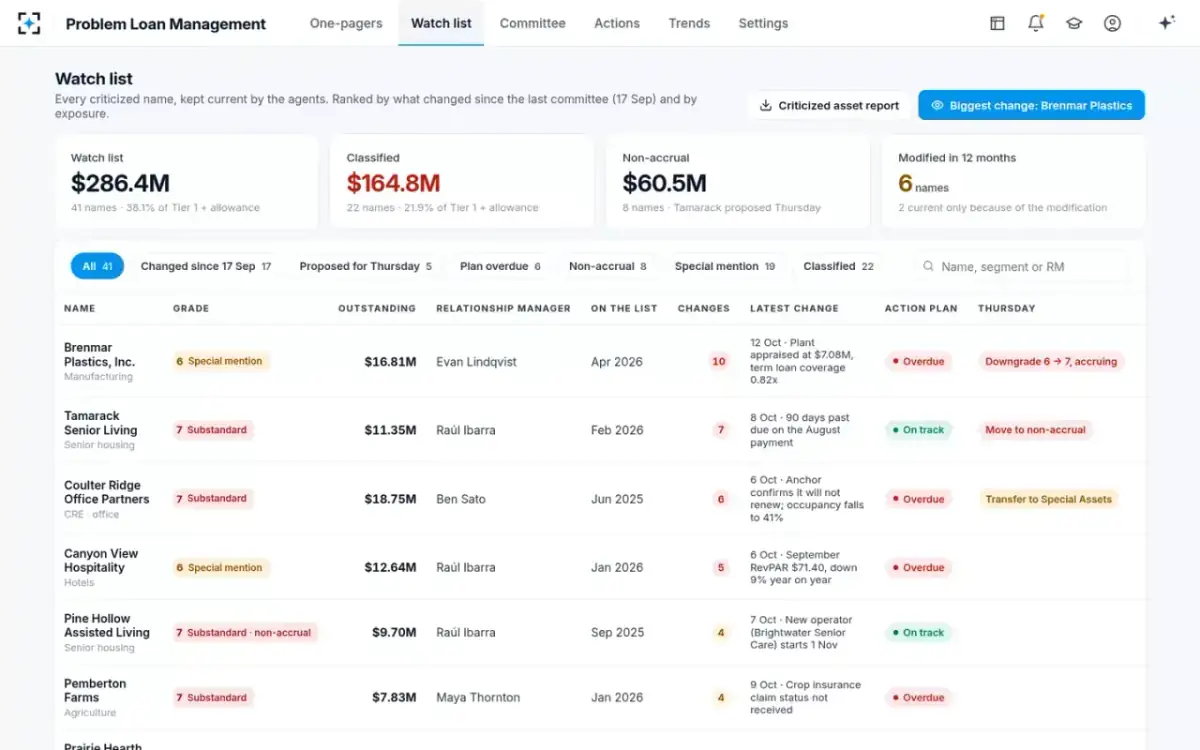
Industry aggregates are reassuring in a way individual banks are not. Take the sample bank's October committee. Its watch list holds 41 names and $286.4 million of exposure. If the proposals before the committee pass, classified assets rise to $181.6 million — 24.2% of Tier 1 capital plus the allowance — and non-accrual rises to $71.9 million. The allowance rises by about $1.7 million, of which $353,000 attaches to one packaging manufacturer.
Work a Texas-style ratio from those figures and the arithmetic is simple: the 24.2% relationship implies a capital-plus-allowance cushion of roughly $750 million, so non-accrual of $71.9 million against it is about 9.6%. That is a comfortable-looking number, and it is comfortable for a reason worth stating: the classified total is two and a half times the non-accrual one. The Texas ratio counts only loans that have already stopped accruing or gone ninety days past due. Everything the committee is worried about but has not yet stopped accruing — the substandard names still paying, the special mention names still current — sits outside the numerator entirely.
That is not a flaw in the formula. It is the formula working as designed, as a lagging measure of damage already recognised. It is a flaw in how the number is used, whenever somebody reads a low Texas ratio as evidence that a bank's credit is fine.
What is a good Texas ratio, and what is a high one?
There is no official answer to either question. None of the banking agencies publishes the ratio or fixes a level for it, and the one line analysts quote is 100%: the point at which recognised problem assets equal the whole cushion of tangible capital and reserves. Below that, "good" only means something against a comparison — the industry's own figure for the same quarter, a peer group, or the same bank a year earlier.
The industry figure is the natural benchmark, because it can be computed from published data on the same recipe. On the second quarter of 2026 it is 5.6%. A bank several times that figure is carrying a good deal more recognised damage per dollar of cushion than the system as a whole, and a bank whose ratio is rising while the industry's is flat is moving the wrong way, whatever its level.
Three Texas ratios worked in this guide, against the 100% line analysts quote
The rule behind the idea: compare problem asset totals to capital
The ratio is a market convention, but the question it asks is not. What the supervisors publish is the idea underneath. The safety-and-soundness standards require an institution to maintain a system to identify problem assets, and that system's duties include setting problem asset totals against capital and, separately, estimating the losses inside those assets and holding reserves enough to absorb them (12 CFR part 364, appendix A, II.G). The Texas ratio collapses both into one fraction, with the reserve sitting in the denominator and the recognised problem assets on top. A bank's own classified-to-capital measure, like the sample bank's 24.2%, expresses the first duty differently and usually more usefully, because it counts the loans the bank is worried about rather than only the ones it has stopped accruing; how that ratio is built is set out in the guide to the classified assets to capital ratio.
The difference between the two is timing, and timing is the thing the Texas ratio cannot see. A criticized total moves when a committee changes a grade; a Texas ratio moves only once the bank has stopped accruing interest or the borrower has missed three months of payments. Whether that lag is a quarter or two years depends entirely on how promptly the grades move, which no formula can tell you.
Is the Texas ratio a good predictor of bank failure?
Something in its neighbourhood is. Research published by the Federal Reserve Bank of New York, covering most US commercial banks from 1863 to 2024, finds that "Failing banks are characterized by rising asset losses, deteriorating solvency, and an increasing reliance on expensive noncore funding. These commonalities imply that bank failures are highly predictable using simple accounting metrics from publicly available financial statements." In the modern, post-deposit-insurance sample, the authors report that simple models of insolvency and funding classify failures with an area under the curve between 90% and 95% — strong predictive performance by the standards of this literature, and nearly as strong when tested out of sample.
Two caveats come with that, and both matter more than the headline. The first is about solvency, not problem loans: in the modern sample, the authors note that insolvency alone captures most of the predictive content. The second is about everybody's reaction time, and it is the uncomfortable one: "Importantly, both depositors and supervisors seem slow to react to information about bank fundamentals, thus making bank failures predictable." The information was there. It was not acted on. That is a statement about process, not about arithmetic.
A third caveat is that a troubled bank is not a doomed one. An FDIC working paper studying banks that received a poor safety-and-soundness rating set out to predict what happened next, noting that "Besides failure, we see three alternative outcomes for these banks: recovery, acquisition, or continuation as a problem." Across their cohorts, the share that failed before the next event peaked at 5%, while on average 49% remained a problem and the rest recovered or were acquired. A high Texas ratio says a bank is carrying a lot of recognised damage. It does not say which of four doors the bank will walk through.
What the ratio misses: stale appraisals, a modification, and a late downgrade
Three things can make a numerator wrong before anyone divides anything, and each has a date attached.
A stale appraisal keeps a loan looking secured. On the sample bank's watch list, a manufacturing plant was last valued at $9,500,000 in March 2022. A new appraisal dated 5 October put it at $7,080,000 — down a quarter — and term loan coverage fell from 1.10x to 0.82x, a $1.56 million shortfall on an $8.64 million loan. For more than four years, every collateral figure that loan contributed to any ratio rested on a 2022 value, and nothing in the arithmetic would have shown it.
A modification keeps a loan out of the numerator entirely. The same borrower has paid interest only since July, with $110,000 a month of principal deferred to December. Cash available for debt service of $2,990,000 covers the modified schedule 1.61x and the original one 0.94x, against a 1.20x covenant. The loan is current; it is not noncurrent; it will never appear in a Texas ratio until the deferral ends badly. A measure built on past-due status cannot see a loan that has been rescheduled out of being past due.
And a late downgrade keeps a loan out of every classified total. Nothing in the ratio's arithmetic depends on the internal grade — but the allowance in its denominator does, and so does whether the bank is accruing interest at all. An optimistic grade makes the numerator smaller and the allowance thinner at the same time, which flatters the ratio twice.
One loan, as reported and after the appraisal and the modification test
As the ratio sees it: Current. Not 90 days past due, not on nonaccrual: outside the numerator.
As the file sees it: Current only because of a June modification — interest only since July, $110,000 a month of principal deferred to December.
As the ratio sees it: Not an input. The ratio does not look at coverage.
As the file sees it: 1.61x on the modified schedule, 0.94x on the original one, against a 1.20x covenant.
As the ratio sees it: Not an input either, except through the grade and the allowance.
As the file sees it: Plant last valued at $9,500,000 in March 2022; appraised at $7,080,000 on 5 October.
As the ratio sees it: Invisible.
As the file sees it: 1.10x → 0.82x on the $8.64 million term loan: a $1.56 million shortfall, the morning the appraisal arrived.
As the ratio sees it: None, until somebody acts.
As the file sees it: A downgrade from 6 to 7 proposed, with the reasons cited and the allowance effect — $353,000 — attached.
As the ratio sees it: None this quarter.
As the file sees it: Next quarter, if the deferral is not cured, everything above arrives in the numerator at once.
Reading the trend instead of the level
One quarter's ratio is a photograph of recognised damage. Four quarters of it is a direction, and direction is the better signal for the same reason it is in every other credit measure: the level reflects decisions already taken, while the slope reflects decisions being taken now.
The supervisory rating system reads it that way too. Its description of an asset quality rating of 3 turns on practice and direction as much as magnitude: asset quality or credit administration that is less than satisfactory, trends that may be stable or deteriorating, and a level and severity of classified assets that calls for elevated supervisory concern (Uniform Financial Institutions Rating System, 61 FR 67021). Weak practice is listed beside the numbers, not after them.
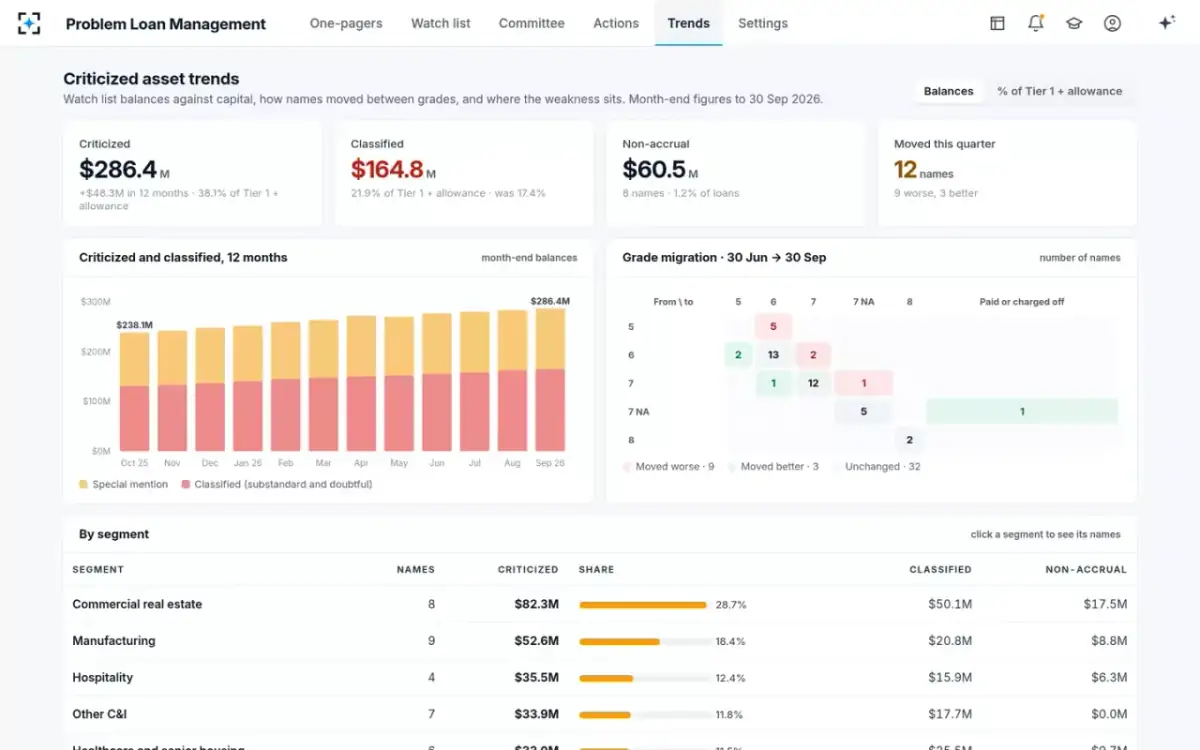
Three series are worth keeping beside the ratio, and all three lead it. Criticized and classified totals, which move before loans stop accruing. Grade migration for the quarter — how many names moved down, up, or transferred — which moves before the totals. And the age of the facts behind each grade, which moves before everything, and which no published ratio shows.
Criticized and classified over twelve months, with the migration underneath
What has to be true underneath the number
A ratio inherits the quality of its inputs without carrying any trace of it, which is why a sensible reader of someone else's Texas ratio asks about the file rather than the formula. Five things have to be true for the number to mean what it appears to mean.
Five questions to ask before you trust anyone's Texas ratio
- Which recipe?
Tangible common equity or total equity; foreclosed property in or out; restructured loans counted or not. The same bank can be quoted at two quite different numbers.
- How old are the collateral values?
A valuation from the last cycle is an opinion about a different economy. Ask for the age distribution of appraisals on criticized names, not an average.
- How many loans are current only because they were modified?
Ask for coverage recomputed on the original schedule. A rescheduled loan leaves the numerator without the borrower improving.
- How fast do grades move after bad news?
Measure the days between a document arriving and the grade that reflects it. That interval, not the ratio, is the leading indicator.
- What does criticized-to-capital say?
The broader measure counts loans the bank is worried about, not only those it has stopped accruing. If the two diverge sharply, the Texas ratio is the lagging one.
The watch list the totals come from
Used carefully, the Texas ratio is a quick, comparable read on how much recognised damage a bank is carrying against the money it has to absorb it. Used carelessly, it is a low number that reassures everybody for exactly as long as the grades behind it stay optimistic. If you want the measures a board should see beside it, read the measures a watch list board asks for, or start from Problem Loan Management.
Questions people ask
What does the Texas ratio measure?
How a bank's recognised problem assets compare with the capital and reserves that would absorb them. The numerator is non-performing loans — generally those 90 or more days past due or in nonaccrual status — plus foreclosed property; the denominator is tangible common equity plus the allowance for credit losses. It measures damage already recognised, not credit risk in general.
Where do you find the numbers for the Texas ratio?
All four come from a bank's quarterly regulatory filings and its balance sheet, and the FDIC publishes the industry aggregates each quarter in its Quarterly Banking Profile. Noncurrent loans and leases is the published line that matches the numerator's loan half; other real estate owned, equity capital, goodwill and intangibles, and the allowance for credit losses are balance-sheet lines.
What is a high Texas ratio?
Analysts commonly treat 100% as the line worth noticing, because at that point recognised problem assets equal the whole cushion of tangible capital and reserves. No banking agency publishes the ratio or endorses a threshold, so compare a bank with the industry figure for the same quarter — 5.6% in the second quarter of 2026 — and with its own history. A rising ratio at 40% is a different proposition from a stable one at 60%.
Is the Texas ratio the same as the non-performing loan ratio?
No. The non-performing loan ratio divides problem loans by total loans, which answers how much of the book has gone wrong. The Texas ratio divides them by capital and reserves, which answers whether the bank can absorb it. A bank with a small loan book relative to its capital can carry a high non-performing ratio and a low Texas ratio at the same time.
Does the Texas ratio include restructured loans?
Generally not, unless the restructured loan is itself 90 days past due or in nonaccrual status. That is one of the measure's blind spots: a loan modified onto an interest-only schedule can be current, outside the numerator, and still failing its original covenant tests. Anyone using the ratio to judge a bank should ask separately about modified loans and about coverage recomputed on the original schedule.
How often should the Texas ratio be recalculated?
Quarterly is the natural cadence, because that is when the inputs are published. Inside a bank, though, the ratio is the last thing to move rather than the first: criticized and classified totals, grade migration and the age of the facts behind each grade all move earlier, and a watch list committee that follows those will know what the quarterly ratio is going to say before it says it.