The classified assets to capital ratio is the share of a bank's capital cushion that its worst loans would consume: adversely classified assets — the loans graded substandard, doubtful or loss — divided by tier 1 capital plus the allowance for credit losses. It is one line on a board's asset quality page and one of the first numbers an examiner computes, and the arithmetic takes a minute. The work is all in the numerator, because every dollar in it is there because somebody assigned a grade, and if those grades come from a sample read once a year then the ratio is an estimate wearing the clothes of a fact. Credit Risk Review is Botminds' software for the loan review function behind that number: it re-grades every commercial loan from its file each quarter, so the population feeding the ratio is the whole book rather than the part of it that came up in the plan.
The bank in the worked example is fictional, and its figures are sample data from the solution. The industry and supervisory material is real and linked where it appears.
One quarter’s numerator, on a fictional sample book
1,418loans
the whole commercial book re-graded from its files, $3.86B of commitments
91
loans whose grade of record the file no longer supports, $518.7M
20loans
pass credits that cross into criticized, $152.7M
93.6%
of the book where the grade of record stands unchanged
What is the classified assets to capital ratio?
It is a measure of concentration risk in the ugliest part of the loan book, expressed against the money that stands behind it. Examiners and directors read it for the same reason: a bank can carry a large volume of weak loans if it has a large cushion, and a modest volume can be alarming if the cushion is thin. The ratio puts the two on the same page.
It exists because the safety and soundness standards tell banks to compute it. Those standards require an institution to maintain a system to identify problem assets and prevent deterioration in them, and set out what the institution should do: conduct periodic asset quality reviews to identify problem assets, compare problem asset totals to capital, and take appropriate corrective action to resolve them.
Compare problem asset totals to capital.
Interagency Guidelines Establishing Standards for Safety and Soundness, 12 CFR part 364, appendix A
Four words, and the whole reporting convention follows from them. What the standards do not do is set a level at which the comparison becomes unacceptable. Neither does the examination rating system quoted further down this page: its asset quality descriptions speak of level, distribution, severity and trend, not of a cut-off. A figure presented to a board as the regulatory limit for this ratio is somebody's rule of thumb.
How do you calculate classified assets to capital?
Add the amounts classified substandard, doubtful and loss across the whole balance sheet, then divide by tier 1 capital plus the allowance for credit losses. Both halves need care, and the convention is worth stating explicitly in the board pack, because a ratio computed against tier 1 alone is not comparable with one computed against tier 1 plus the allowance.
The ratio, term by term, in plain words
Substandard
the amount classified
Loans with a well-defined weakness that jeopardizes repayment. Almost always the largest term by far.
set loan by loan, by whoever grades
Doubtful
the amount classified
Collection in full is highly questionable, with a specific pending event deferring a loss classification.
set loan by loan, by whoever grades
Loss
the amount classified
Uncollectible and not worth carrying. Usually small on the ratio date, because it is charged off rather than carried.
set loan by loan, by whoever grades
Divided by: tier 1 capital + the allowance
the denominator, not a fourth term to add
Capital as reported, plus the allowance for credit losses — the money already set aside against the same loans.
the call report; not a judgement call
One worked illustration exists in public, and it is worth reading precisely because it is not a real bank. The FDIC's examination manual carries a set of example report pages built around an invented institution, and its asset quality commentary reads: "adversely classified items (ACI) are elevated at … 53 percent of tier 1 capital and the ACL, an increase from 18 percent at the 2025 examination." Note what the sentence actually argues. The level is mentioned once; the change — eighteen to fifty-three — is what the comment is about.
The numerator: what counts, and what does not
The numerator is not only loans. Classified items include other assets the examination reaches: accrued interest associated with classified loans, other real estate owned, and classified securities and other assets. On the illustrative example above, accrued interest on the adversely classified loans is listed separately as a substandard item of its own.
The numerator is also not the full balance of every weak loan. A relationship can be split: part substandard, part doubtful, part still pass, where the file supports the division. A board page that reports the committed amount of every criticized relationship, rather than the amount actually classified, will overstate the ratio and will not reconcile to the examination report.
The denominator, and why the allowance sits in it
Tier 1 capital is the bank's core loss-absorbing capital as it reports it, and it is the part of this ratio nobody argues about: it comes off the call report and is not a judgement anyone in loan review makes. The allowance is the part worth explaining to a director, because adding it looks at first like flattering the number.
The reasoning is that the allowance is money already recognised against the same assets. A bank that has estimated the losses in its problem assets and set aside reserves sufficient to absorb them has, by that act, already met part of the exposure the ratio is measuring; counting those reserves only once — as a deduction from earnings, with no credit in the denominator — would charge the bank twice for the same prudence. The safety and soundness standards treat estimating inherent losses and comparing problem assets to capital as two steps of one system, and the wider denominator keeps them consistent.
Two practical consequences follow. A bank that strengthens its allowance will see this ratio fall for a reason unconnected to its loan book, so a quarter-on-quarter move should always be read with the allowance movement beside it. And because the two conventions differ by a material margin at most banks, a peer comparison assembled from published figures is worthless unless each figure's denominator is known.
Does special mention count in the ratio?
No. Special mention is criticized, not classified, and the distinction is the one that decides this ratio's numerator. The OCC's handbook draws the boundary in a single sentence: classified assets are exposures rated substandard, doubtful or loss, and they do not include pass and special mention exposures. Where the two words come from, and what each rung has to show, is set out in the guide to the 1–9 rating scale.
Each rung, and whether it reaches the ratio
| Grade | Criticized? | Classified? | In the classified-to-capital ratio? |
|---|---|---|---|
| 1 to 4 · Pass | No | No | No |
| 5 · Watch (the bank’s own label) | No — still a pass grade | No | No. A watch list is a management tool, not a classification. |
| 6 · Special mention | Yes | No | No. It belongs in the criticized total, which is the wider number reported beside this one. |
| 7 · Substandard | Yes | Yes | Yes, at the amount classified. |
| 8 · Doubtful | Yes | Yes | Yes, at the amount classified. |
| 9 · Loss | Yes | Yes | Yes while it is carried — in practice it is charged off, so it rarely survives to the ratio date. |
Reporting the criticized total beside the classified one is good practice for a reason that has nothing to do with completeness: special mention is where next quarter's substandard comes from. A classified ratio that is flat while the special mention population has doubled is not a stable quarter, and a page that shows only the first number will say it is.
Why the ratio lags the book it describes
Because grades change on review dates rather than on the dates the facts change. A loan whose coverage fell below its covenant in June carries its old grade until somebody reads the file, and under a yearly sample that reading may be next February. The ratio for the September quarter then describes a book that no longer exists, and nobody involved has done anything wrong.
The FDIC's own illustrative commentary names the mechanism. In that example institution, the downgrades made during the examination were "largely attributed to an emerging trend of borrowers with weak cash flow and recent payment delinquencies that had not yet been incorporated into internal risk ratings." Not hidden. Not disputed. Simply not yet carried into the grades — and therefore not yet in the ratio the board had been reading.
The criticized and classified populations, as graded and as the files read
Fifteen more classified loans is a thirty per cent increase in the numerator's population, arriving in one quarter, from a book nobody thought was deteriorating. That is the shape of the problem: not that the ratio is wrong, but that it is as current as the grading behind it, and no more.
Coverage in Credit Risk Review: the whole book, against last year’s sample
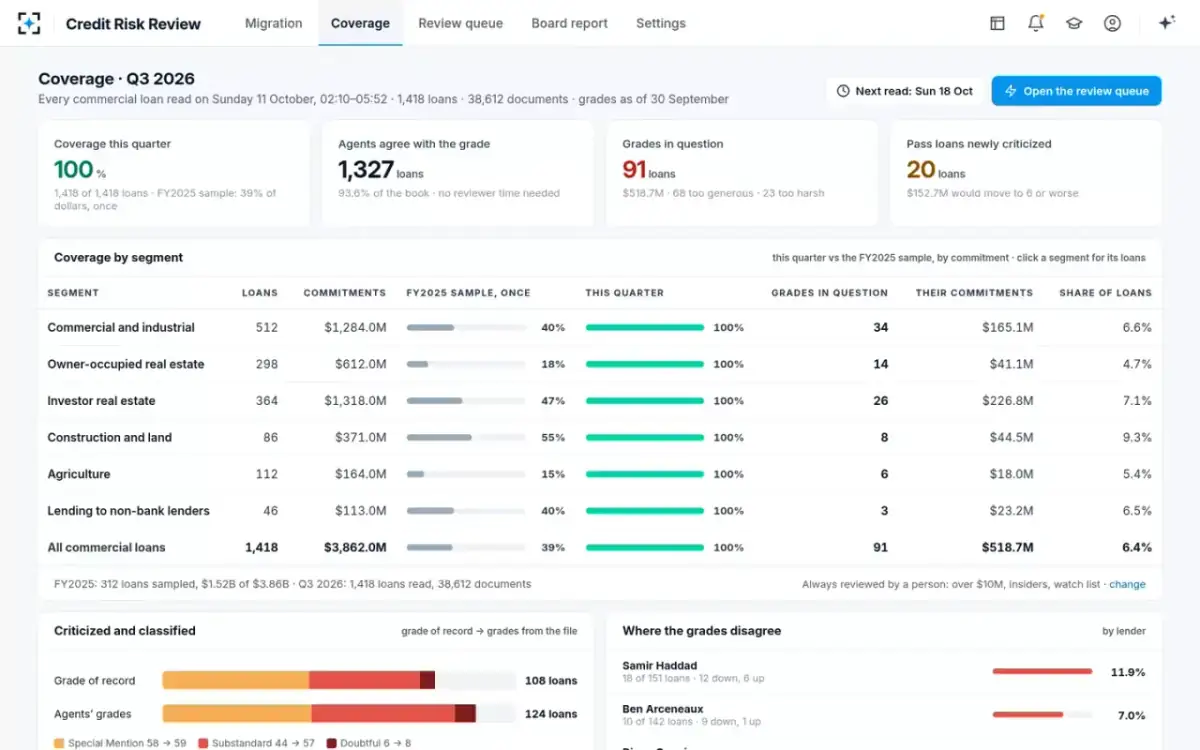
What a quarter of full coverage does to the number
It does not make the ratio better. It makes it current, and in a deteriorating quarter current is worse. That is the trade a bank is actually making when it widens coverage, and it is worth saying out loud to a board before the first quarter's figures land rather than afterwards.
The same quarter, through a yearly sample and through a full read
Last year’s sample plan: About 78 loans a quarter — the large relationships, the watch list, insiders and a slice of the rest. Across the year, 312 loans, 39% of dollars.
Every loan, this quarter: All 1,418 loans, $3.86B of commitments, read from their files each quarter.
Last year’s sample plan: 27 reached by the board committee date.
Every loan, this quarter: All 91, ranked by notches and exposure, with the reasons cited.
Last year’s sample plan: 64 loans, $329.1M, keep the lender’s grade until their annual review.
Every loan, this quarter: None keep a grade by default; a grade that survives does so because a reviewer agreed with it.
Last year’s sample plan: All six loans moving three notches, from pass 4 to substandard 7, sit outside the quarter’s sample — $53.2M that stays graded pass.
Every loan, this quarter: All six surface in the first screen of the quarter, as one cell of the migration matrix.
Last year’s sample plan: A book partly graded on this year’s facts and partly on last year’s.
Every loan, this quarter: A book graded on the facts in the files as at the quarter end.
Last year’s sample plan: Coverage is a choice the agencies leave to the bank; a sample is not a failing.
Every loan, this quarter: A full read changes which loans are read, not who decides. Every grade still settles with a person.
The last row matters. Widening coverage is not a claim that the previous plan was wrong — the FDIC's examination manual says there are no established or expected minimum or maximum coverage levels for loan review samples, and a well-built sample is a legitimate way to run a review function. What widening coverage changes is how long a mis-grade can sit undiscovered, which is the same thing as how far the ratio can drift from the book. What to ask of a tool that claims to do it is the subject of the loan review software buying guide.
What examiners read beside the ratio
Never the level alone. The uniform rating system lists what asset quality is rated on, and the relevant line asks for "the level, distribution, severity, and trend of problem, classified, nonaccrual, restructured, delinquent, and nonperforming assets for both on- and off-balance sheet transactions." Four attributes, of which the level is one. Distribution asks whether the classified total sits in one segment or across the book; severity asks how deep inside the classifications it sits; trend asks which way it is going.
The rating descriptions make the weighting plain. "A rating of 3 is assigned when asset quality or credit administration practices are less than satisfactory," the manual says. "Trends may be stable or indicate deterioration in asset quality or an increase in risk exposure." A stable trend can still earn a 3, and the sentence puts credit administration practices beside asset quality — which is to say the quality of the grading, not only what the grades add up to.
Reading the trend rather than the level
Three readings make a trend useful. The first is the direction of the ratio over four or eight quarters, plotted rather than tabled. The second is what is underneath it: the same ratio can rise because one large relationship moved, or because thirty small ones did, and those are different conversations. The third is the migration — how many loans crossed from pass into criticized this quarter, and how many left.
The industry backdrop is worth putting on the same page, because a board reading its own ratio in isolation cannot tell a bank-specific problem from a cycle. The FDIC's 2025 Risk Review, on full-year 2024 data, reported that the industry's net charge-off ratio "remained above its prepandemic average with a slight increase in 2024 to 0.70 percent, the highest level since second quarter 2013", and that the number of banks on the FDIC's problem bank list rose from 52 at the end of 2023 to 66 at the end of 2024.
The industry backdrop a board reads its own ratio against
0.70%
industry net charge-off ratio in 2024 — the highest since the second quarter of 2013, and above the prepandemic average
66banks
on the FDIC’s problem bank list at the end of 2024, up from 52 a year earlier
2013
the last year the charge-off ratio was this high, which is the comparison worth making before blaming a local market
What should the board see about loan quality each quarter?
Enough to tell a level from a trend and a grading problem from a credit problem. In practice that is six things: the classified total and the ratio with its denominator convention stated; the criticized total beside it; the migration into and out of criticized this quarter; the distribution by segment; the coverage behind the grades — how much of the book was actually read, and when; and the open items, meaning the grades still in dispute and the ones a reviewer chose not to move.
The last item is the one most often missing and the easiest to defend having. A quarter in which the review function disagreed with ninety-one grades, settled twenty-four, has thirteen with lenders and one overdue tells a director something no ratio can: whether the process that produces the numerator is working. The guidance expects review results to reach the board or a board committee quarterly, with comparative trends and management's response to substantive criticisms.
The quarter’s loan review report in Credit Risk Review, as the committee reads it
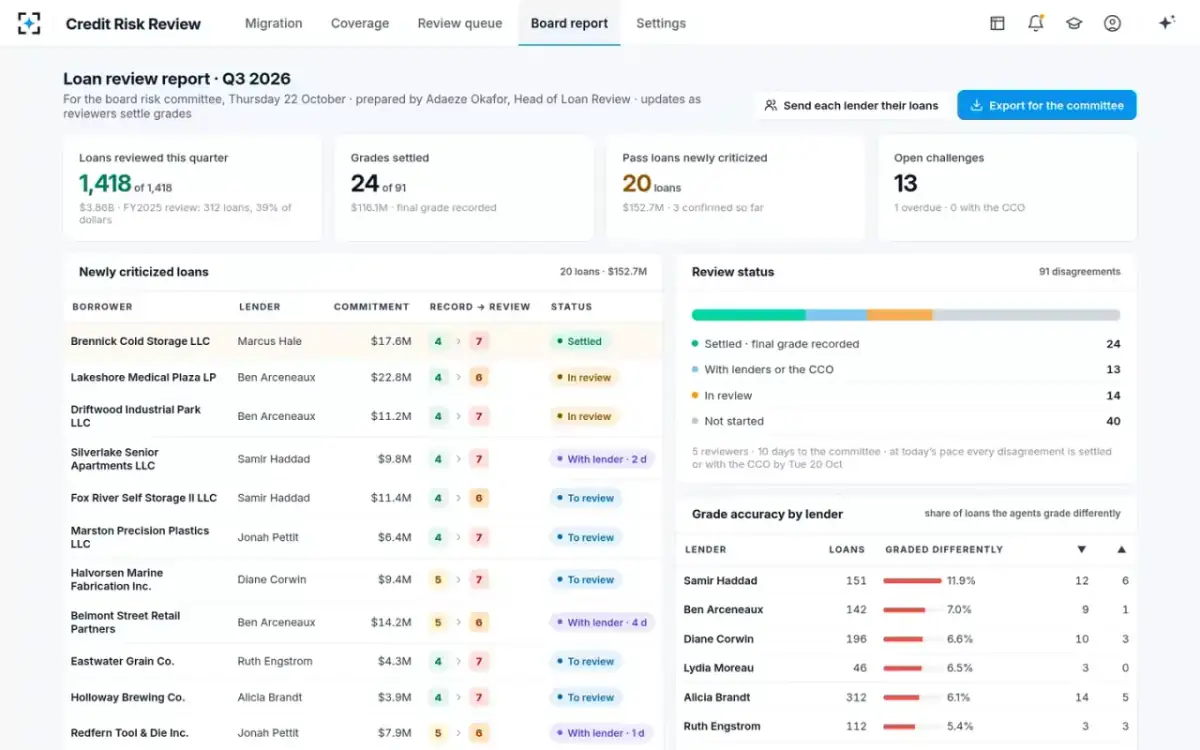
The last panel of that report is worth a paragraph of its own. Ranking lenders by the share of their loans the agents grade differently turns an aggregate into a management question. It is a pointer rather than a verdict — each of those disagreements still has to settle with a reviewer, the lender and, if need be, the chief credit officer before it moves a grade of record or the numerator — and a board should read it that way. Who is entitled to move those grades, and what happens when a lender disagrees, is set out in who assigns a loan risk rating.
Questions people ask
What counts as a classified asset?
An exposure graded substandard, doubtful or loss, at the amount so classified. It covers more than loans: other real estate owned, classified securities and other assets, and accrued interest on classified loans are all classified items. Pass and special mention exposures are excluded, which is why the criticized total is always the larger of the two numbers.
What is a good classified assets to capital ratio?
There is no published figure, and no regulatory threshold. Examiners read the level together with the distribution, severity and trend of problem assets, and alongside credit administration practices. A low ratio built on grades nobody has tested for a year is worth less than a higher one built on a book that has just been read.
What is the difference between criticized and classified assets?
Criticized means special mention or worse. Classified is narrower: substandard, doubtful and loss only. Every classified asset is criticized; special mention assets are criticized but not classified, and they are excluded from the classified-to-capital ratio. Reporting both is standard practice, because the special mention population is where the next quarter's classifications usually come from.
Should the denominator be tier 1 capital or tier 1 plus the allowance?
Examination reporting commonly uses tier 1 capital plus the allowance for credit losses, on the reasoning that the allowance is money already set aside against the same assets. A ratio computed on tier 1 alone will be higher and is not comparable with one computed on the wider base, so the board page should state which convention it uses and keep it from quarter to quarter.
How often should the ratio be recomputed?
At least quarterly, and with the same frequency as the grading behind it. Recomputing the arithmetic monthly on grades that are refreshed once a year produces a more frequent number, not a more current one. The guidance expects credit risk review results to reach the board or a board committee quarterly, and more often when material adverse trends appear.
Why does the ratio sometimes jump at an examination?
Because the examination re-grades loans the bank's own review had not reached. The FDIC's illustrative example report attributes its jump — adversely classified items rising from 18 to 53 percent of tier 1 capital and the allowance — to weak cash flow and recent delinquencies that had not yet been carried into internal risk ratings. The usual cause is lag in the grading, not disagreement about what the loans are worth.