A credit risk dashboard is the small set of measures that tells a board and its credit committee how much of the loan book is going wrong, where, how fast and what is being done about it. The good ones are short, defined once, and traceable: every tile opens onto the names behind it, and every name opens onto the documents behind it. The bad ones are long, beautiful and closed, and a number nobody can trace is a number nobody can act on. Botminds' Problem Loan Management keeps one current page per troubled loan, cited line by line to the file, which is what makes a tile worth clicking.
This guide is written for the credit risk officer who has to put a handful of tiles in front of a board, and for the director who has to ask the right question about each one. The worked figures come from a fictional sample bank, Calder Plains Bank; the published benchmarks and the reporting requirements come from the US banking agencies, linked where they appear.
Three tiles worth having, on one bank's watch list
24.2%
classified assets against Tier 1 capital plus allowance, if every proposal on Thursday’s agenda passes
$71.9M
non-accrual after the same decisions, against $286.4M on the watch list in total
6of 14
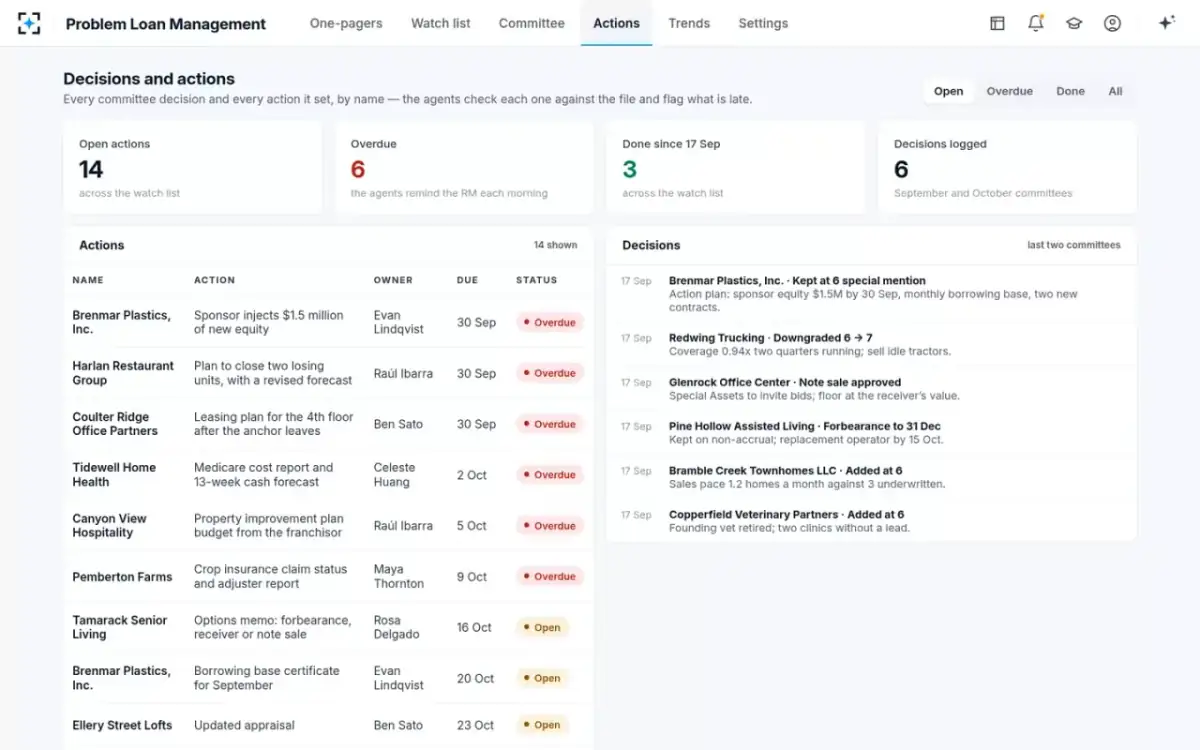
open committee actions overdue — the tile that says whether last month’s decisions turned into anything
What a credit risk dashboard is for, and who it is for
It exists to let people who cannot read 41 loan files form an accurate view of what is in them, and to let them tell when that view has stopped being accurate. That is a narrower purpose than most dashboards are built for, and the narrowness is what makes one useful.
The duty behind it is explicit. The safety-and-soundness standards require an insured depository institution to keep a system, sized to its business, that identifies problem assets and stops them deteriorating, and that system has to report: periodic asset reports with enough information for management and the board to assess the level of asset risk (12 CFR part 364, appendix A, II.G). A dashboard is one way of discharging that duty; a 60-page quarterly binder is another, and the agencies do not care which, so long as somebody can assess the risk from it.
The interagency guidance on credit risk review adds the quality bar. Effective reporting is not a scoreboard: "Comprehensive reporting includes comparative trends that identify significant changes in the overall quality of the loan portfolio, the adequacy of, and adherence to, internal policies and procedures, the quality of underwriting and risk identification, compliance with laws and regulations, and management's response to substantive criticisms or recommendations." Read that list as a specification. Four of its five items are about process rather than balances, and a dashboard built only from balances shows none of them.
Two audiences, two different needs. The credit risk officer needs the dashboard to be operational — which names moved, what is late, what is due at the next committee. The board needs it to be comparative and honest — is this better or worse than last quarter, how does it compare with the industry, and what is management doing. One screen can serve both only if every tile drills.
The eight measures a watch list board actually asks for
Eight is not a magic number; it is roughly the most a board can hold in mind and ask a sharp question about in the twenty minutes credit usually gets. What follows is the set that survives contact with a real agenda, with the question a director should ask about each.
Eight measures: the definition, the source, the refresh, and the question to ask
MeasureCriticized and classified against capital
What it isSpecial mention plus classified balances, and classified alone, as a share of Tier 1 capital plus the allowance.
Where it comes fromThe watch list, summed from each name’s current grade.
RefreshEvery committee, and whenever a grade changes.
The question to askWhat would this be if every proposed downgrade on the agenda passed?
MeasureNon-accrual balance and rate
What it isLoans on which the bank has stopped accruing interest, in dollars and as a share of loans.
Where it comes fromThe loan system, confirmed against the committee’s decisions.
RefreshDaily, reported monthly.
The question to askWhich of these stopped accruing this quarter, and how long had they been criticized first?
MeasureGrade migration for the quarter
What it isHow many names, and how much exposure, moved down, moved up, stayed put or transferred.
Where it comes fromThe grade history behind each name.
RefreshEvery committee.
The question to askIs the downgrade count falling because the book improved, or because nobody proposed any?
MeasurePast-due and nonaccrual by segment
What it isThe share of each loan category 30 or more days past due or in nonaccrual, against the published industry figure.
Where it comes fromThe loan system; the benchmark from the FDIC’s quarterly data.
RefreshMonthly; the benchmark quarterly.
The question to askWhere are we worse than the industry, and is that a book we chose or one we drifted into?
MeasureAllowance and its coverage
What it isThe allowance for credit losses, and what multiple it is of non-accrual loans.
Where it comes fromThe allowance calculation, driven by the same grades.
RefreshMonthly.
The question to askDid coverage fall because the allowance shrank or because non-accrual grew?
MeasureWhere the weakness sits
What it isClassified exposure by industry, property type, region and relationship manager.
Where it comes fromThe watch list, grouped.
RefreshEvery committee.
The question to askIs any single concentration carrying more than its share of the classified total?
MeasureOpen committee actions, and what is late
What it isEvery action the committee set, its owner, its date, and how many are overdue.
Where it comes fromThe minutes and the action log, checked against the credit file.
RefreshDaily.
The question to askWhich action has been open longest, and what has it been waiting for?
MeasureThe age of the facts behind each grade
What it isHow old the newest financial statement, covenant test and collateral valuation on each criticized name is.
Where it comes fromThe document dates in each name’s file.
RefreshContinuously.
The question to askHow many criticized names are graded on information more than a year old?
The eighth measure is the one a dashboard most easily leaves out, and the one that predicts the others. A grade rests on facts, and facts have dates. A watch list where a quarter of the criticized names are graded on statements more than a year old is not a watch list; it is a memory. The uniform rating system judges asset quality partly on "The ability of management to properly administer its assets, including the timely identification and collection of problem assets" — and the age of the evidence is the cheapest available proxy for timely identification.
Where each number comes from, and when it goes stale
A few of the eight come straight from systems — the loan system, the deposit system, the allowance model. The rest come from the credit file and from the committee's own minutes and grade history. The ones that come from systems are easy, current and narrow. The ones that come from the file are hard, slow by default and are where the meaning lives — and they are the reason dashboards built purely on a data warehouse feel thin to the people who know the loans.
Staleness is specific rather than general, and worth labelling tile by tile. A non-accrual balance is current to the day. A classified total is current to the last committee, which may be four weeks ago. A collateral concentration is only as current as the valuations underneath it, which on a quiet credit can be years old. And a benchmark against published industry data is a quarter behind by construction. A dashboard that prints all four in the same typeface, with no date, invites a board to treat them as equally fresh.
The fix is unglamorous and cheap: put the as-at date on every tile, and make the oldest input visible. A classified tile that says which committee's votes it reflects — "as voted on 17 September" — is worth four of the same tile without the clause.
Grade migration: the honest tile on the board's page
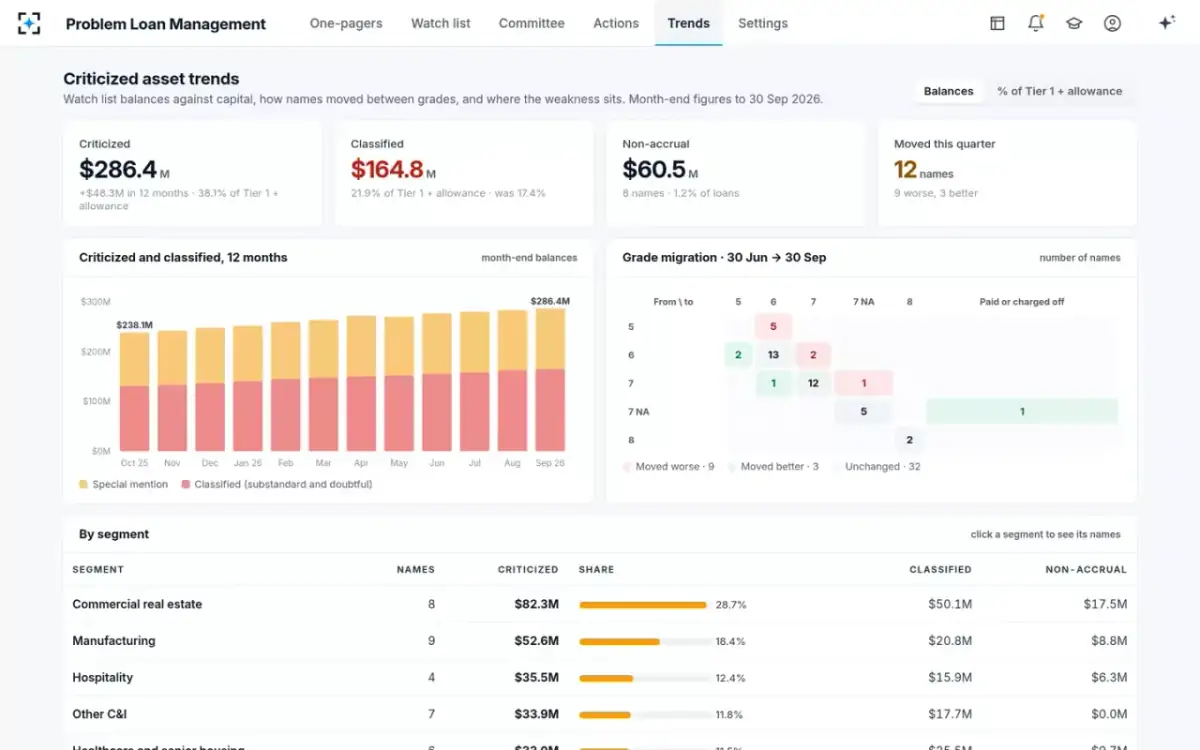
Grade migration is the movement of names and exposure between internal grades over a period: how many were downgraded, upgraded, left alone, or paid off and charged off. It is the honest tile because it is the only one that shows the bank's own behaviour rather than the borrowers'. Balances move for all sorts of reasons; migration moves only when somebody decides something. How to build the transition matrix behind the tile, and what examiners read in it, is set out in the guide to risk rating migration.
One quarter's grade migration on the sample bank's watch list
9names
moved to a worse grade between 30 June and 30 September
3names
moved to a better grade over the same quarter
32names
left where they were — the count to question when the economy is moving
Two failure modes show up here first. A watch list where almost nothing moves is a watch list nobody is working; grades that never change are not stable, they are stale. And a watch list where upgrades consistently outnumber downgrades in a flat economy is a sign that names are being quietly cleaned off rather than cured — which is precisely why examiners read removals from adverse classification as carefully as they read additions.
Migration is also the tile that exposes the difference between a decision and a drift. A name that leaves the list because the committee voted an upgrade has a minute behind it. A name that leaves because it was refinanced, renewed or simply not re-reviewed has nothing behind it at all, and a dashboard that does not distinguish the two is flattering its own bank.
Benchmarking your tiles against published data
Internal numbers mean more beside external ones, and three public series are worth putting on the page. The FDIC publishes the industry's past-due and nonaccrual share each quarter: in the second quarter of 2026, "Past-due and nonaccrual (PDNA) loans—loans that are 30 or more days past due or are in nonaccrual status—decreased 9 basis points from the prior quarter to 1.44 percent." The same release puts the industry net charge-off rate at 0.57 percent and gives the figure by category, so a bank can compare its commercial real estate or its commercial and industrial book rather than its whole balance sheet.
The OCC's half-yearly risk assessment gives the supervisory read on the same data, and in Spring 2026 it was benign: "Portfolio quality is satisfactory across retail and corporate credit with past-due and nonaccrual loan ratios, as well as net charge-off ratios, below long-term averages for most loan categories." The same report notes that a substantial volume of commercial real estate loans written in a lower-rate environment will mature over the next several years and need refinancing at prevailing rates — a benchmark for the future rather than the past.
The third is the Shared National Credit review, which examines large syndicated loans and is the only place the industry's criticized percentage is published on a comparable basis. The 2025 review covered "6,857 borrowers, totaling $6.9 trillion in commitments, an increase of 6 percent from a year ago", with 8.6 percent of commitments rated special mention or classified, down from 9.1 percent. The agencies then added the qualification every dashboard designer should keep pinned above the desk: the share fell mostly because new commitments grew, not because credit quality underneath improved (agencies' 2025 SNC release).
That is the general hazard of ratio tiles, stated by the supervisors about their own number. A denominator that grows makes a ratio fall without anything improving. Show the numerator and the denominator, or show the ratio beside the balance that drives it.
Where the weakness sits: classified exposure in four segments
How often should a credit risk dashboard be refreshed?
Each measure on its own clock, and the board on a fixed one. The agencies anchor the board end: results of credit risk review are typically provided to the board or an appropriate board committee quarterly, and the same guidance expects the board to hear sooner when the portfolio turns materially worse — a point the criticized asset report is built around. Quarterly is a floor with an escalation clause, not a ceiling.
Inside the bank, the natural cadence is the committee's. Classified and criticized totals are only as fresh as the last set of votes, so refreshing them nightly is false precision; refreshing them the moment a decision is recorded is honest. Balances, past dues, overdrafts and line use move daily and should. The action log should be live, because the question it answers — what is late — changes every morning.
One thing is worth refreshing continuously: the age of the evidence. A statement that was six months old yesterday is six months and a day old today, and the tile that tracks it degrades on its own without anybody doing anything wrong. That property makes it an unusually good early signal, and an unusually uncomfortable one.
Twelve months of criticized and classified, with migration and segments beneath
Why a dashboard is not a decision
A tile summarises; it cannot weigh. The gap between the two is where boards get into trouble, and it has a predictable shape: a number looks acceptable, nobody asks what is inside it, and the thing inside it is three relationships with the same sponsor.
The agencies make the distinction structurally. Credit risk review exists to provide "management and the board of directors with an objective, independent, and timely assessment of the overall quality of the loan portfolio" — an assessment, which is a judgement by a qualified person, not a figure produced by a query. The dashboard is how that assessment is communicated. It is not the assessment.
In practice the test is whether the tile leads anywhere. A number that ends in itself trains a board to accept numbers. A number that opens onto the five names driving it, each with the reasons for its grade and the documents behind those reasons, trains a board to ask about names — which is the only question that has ever found anything.
A tile that ends in a number, and a tile that opens onto the file
Ends in a number: A figure, refreshed nightly from a warehouse, as at a date nobody prints.
Opens onto the file: The names that make it up, ranked by exposure and by what changed, as at the committee that last voted on each.
Ends in a number: A movement. The explanation is somebody’s commentary field.
Opens onto the file: The one name that moved, the date it went 90 days past due, and the minute that recorded the decision.
Ends in a number: A ratio. Which borrower, and on which schedule, is not in the tile.
Opens onto the file: The borrower, the covenant as written, the result on the original schedule and on the modified one, and the statement each figure came from.
Ends in a number: A share of the book by property type.
Opens onto the file: The same share, with the age of each valuation beneath it — and the appraisal that moved one plant from $9.5M to $7.08M.
Ends in a number: A count on a status page.
Opens onto the file: Each action, its owner, the decision that set it, how long it has been open and the document that would close it.
Ends in a number: "Is that good or bad?"
Opens onto the file: "Show me the oldest one."
Spreadsheet, BI tool, or the system that keeps the file: three builds
Many credit dashboards start as a spreadsheet, and it is not a foolish choice: it is free, it is exactly what the analyst means, and it can be changed in an afternoon. It fails on three things — nobody can audit how a number was produced, it depends on one person's weekend, and it cannot drill, because the file is somewhere else entirely.
A business intelligence tool over a data warehouse fixes the audit and the dependency, and gives genuinely good comparative charts. It inherits one limitation that no amount of configuration removes: it can only show what is in the warehouse, which is the loan and deposit systems. The classified total, the covenant result on the original schedule, the age of the newest appraisal and the status of last month's actions are not fields anywhere. They are conclusions drawn from documents, and a warehouse has no documents.
The third build puts the dashboard on top of the system that keeps the credit file current. Then the tiles are summaries of pages that are themselves maintained line by line with their sources, and the drill is not an integration — it is just the next page. That is the design behind the criticized asset report and the dashboard above it, and it is why the measures that matter most can be shown at all.
What to require before you buy one
Six requirements before a credit risk dashboard is worth paying for
- Every tile drills to names, and every name to documents
Two clicks from a figure to the page of the statement, certificate or appraisal behind it. If the drill stops at a table, the tile cannot be defended in a meeting.
- One definition for each measure, written down and versioned
What counts as classified, which exposures are included, whether unfunded commitments are in. A measure whose definition changed silently between two quarters has destroyed its own trend.
- An as-at date on everything
Including the oldest input behind each tile. Freshness varies by measure and should be visible rather than implied.
- Modified loans shown on both schedules
A dashboard that reports payment status without reporting coverage on the original schedule will tell a board a restructured book is performing.
- The action log on the same page as the balances
Decisions and their follow-through belong beside the numbers they were meant to change, not in a separate status report nobody opens.
- The definitions survive export
If the board pack is a static deck, each figure still needs its as-at date and its definition on the page. A tile loses its drill the moment it becomes a slide.
The action log, beside the numbers it is supposed to move
Build the short version first. Eight measures, each defined once, each dated, each opening onto the names beneath it, with the action log on the same page. A board that can ask one good question about each of those eight is better served than one handed forty tiles it cannot interrogate. To see the pages those tiles rest on, start from Problem Loan Management, or read how the numbers reach the table in the criticized assets committee.
Questions people ask
What are the key credit risk metrics for banks?
For a problem loan book: criticized and classified balances against Tier 1 capital plus the allowance; non-accrual balances and rate; grade migration for the period; past-due and nonaccrual shares by segment against the published industry figures; the allowance and its coverage of non-accrual; concentration of classified exposure; open committee actions and how many are overdue; and the age of the facts behind each grade.
How is a credit risk dashboard different from the criticized asset report?
The dashboard is the standing view: a handful of measures, each dated and refreshed on its own clock, that a director can open at any time. The criticized asset report is the dated document the board receives and the examiner reads, with the totals against capital, the trend, the actions taken and one page per name that needs a decision. A good dashboard is the front page of that report, kept current between meetings.
Can a dashboard replace the credit committee?
No. A dashboard summarises; a committee weighs evidence and decides. Every grade change, move to non-accrual and transfer to special assets is a decision that belongs on a record with reasons and a vote behind it. A tile that moves because a grade changed is reporting the committee's work; it cannot do that work, and a bank whose grades change without a recorded decision has a governance problem, not a reporting one.
How do you build a credit risk dashboard?
Define the measures before choosing the tool: write down what each one counts, where it comes from and how often it moves. Then check which of them your data actually supports — several of the most useful are conclusions drawn from documents rather than fields in a system. Build the eight that drill through to names and documents, put an as-at date on each, and resist adding a ninth until a director has asked for it twice.
Should a credit risk dashboard show forecasts?
Show the pipeline, not a prediction. What is on the next committee's agenda, what the classified total would be if every proposal passed, and what matures in the next two quarters are all facts about decisions and contracts, and they are more useful than a projected loss rate. Keep modelled estimates clearly separated from measured balances, and label which is which.
How often should the board see the credit risk dashboard?
At least quarterly, which is the cadence the interagency guidance describes for credit risk review reporting to the board or an appropriate board committee — and more often when material adverse trends appear. The credit committee itself will usually want the same measures monthly, and the action log daily, because the questions those answer change on a different clock from the board's.