ESG benchmarking tools place a company's ESG metrics against a peer group, typically an emissions intensity, an energy intensity or a workforce ratio compared with the median and spread of companies in the same sector. For private portfolio companies, the hard part is not finding peer data but making the comparison fair: the same denominator in the same currency, the same emissions scopes calculated the same way, the same year, and a peer group large enough to mean something. Get those wrong and a benchmark ranks sectors and accounting choices, not performance. Botminds' Portfolio Company ESG Data Collection benchmarks each company and fund against a licensed peer table and the GP's own history, holds back any value still under question, and drafts the line the LP report will use only once the fund's dataset is approved.
The companies and figures on this page come from the solution's fictional sample campaign; every name in it is invented. The rules and research are linked where they appear.
Raw intensity ranks sectors; distance from the sector median ranks companies
What is ESG benchmarking?
ESG benchmarking is comparing an organisation's ESG metrics with a reference: a peer group, a sector median, its own history or a target. For a GP it serves three purposes. It tells the deal team which companies are behind their peers and where an operating improvement is plausible; it gives the LP report a context sentence for each fund; and it is the second line of defence against bad data, because a value far outside its peer band is more often a reporting error than a transformed business.
Benchmarking is not a rating. A rating combines many metrics with weights someone chose; a benchmark compares one metric, defined one way, with the same metric for comparable companies. That narrowness is what makes it checkable, and what makes the definitions decisive.
ESG peer benchmarking for private companies: why it fails on denominators first
Most private-company benchmarks compare intensities, a metric divided by a measure of size, because absolute emissions mostly measure size. The denominator is where the comparison breaks first. Emissions per million of revenue rewards high-price businesses and penalises low-margin ones; emissions per employee rewards capital-intensive ones; and revenue itself depends on currency, exchange-rate date and whether the company consolidated an acquisition for the full year or part of it.
EU rules pick one denominator and fix it. The SFDR's principal adverse impact template measures energy use as gigawatt-hours per million euros of investee revenue, reported separately for each high-impact climate sector (Delegated Regulation (EU) 2022/1288, Annex I, indicator 6): one unit, one currency, and only within a sector. Even so, when the European Supervisory Authorities reviewed managers' statements, they found "some discrepancies in the methodologies that made indicators 5 (share of non-renewable energy consumption and production) and 6 (energy consumption intensity per high impact climate sector) not comparable" and left both out of their summary table (ESAs, JC 2025 26). If regulated disclosures with a prescribed formula could not be compared, a portfolio benchmark built from free-form answers needs its own rules.
How to benchmark emissions intensity, step by step
To benchmark emissions intensity, compute each company's Scope 1 and 2 emissions with one method, divide by revenue in one currency for the same fiscal year, then compare with the median and spread of peers in the same sector computed the same way. Each step removes one way the comparison can mislead.
Benchmarking one company's emissions intensity, step by step
| Step | What to do | In the sample case |
|---|---|---|
| 1. Fix the numerator | Scope 1 plus Scope 2, one Scope 2 method throughout, from confirmed values | Fennick Logistics, Scope 1 and 2 after the company confirmed its corrected electricity |
| 2. Fix the denominator | Revenue for the same fiscal year, in the benchmark's currency, at a stated rate | Revenue in US dollars, fiscal 2026, up 5.9% on the year |
| 3. Compute the intensity | Numerator ÷ denominator, in t CO2e per $M or per €M | 25.9 t CO2e per $M (117.9 as first entered) |
| 4. Choose the peer group | Same sector and region, computed the same way; record the count | 86 US logistics peers |
| 5. Place it | Against the median and the middle half, not only the median | Median 31.2; middle half 19.4 to 47.8 |
| 6. Compare with itself | Against the company's own prior years, at the same boundary | 27.9 in FY2024, 26.8 in FY2025 |
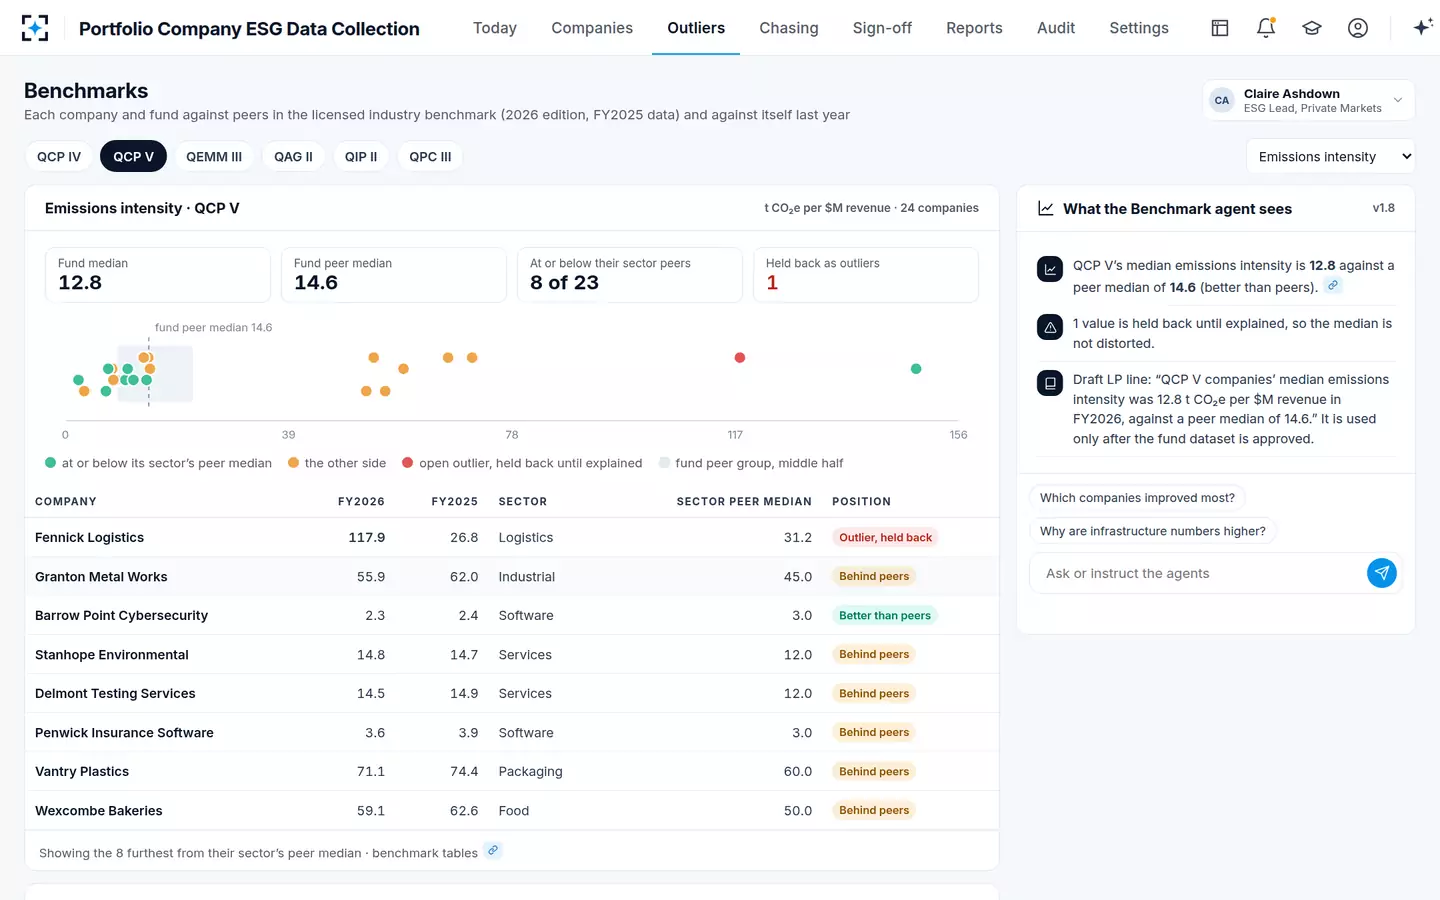
Peer benchmarks in Portfolio Company ESG Data Collection, with the open outlier held back
Same scope, same year, same currency: normalise before you compare
Normalising means changing the companies' figures so that the only difference left is performance. Six choices have to be the same for the company and every peer, and a benchmark that does not state them cannot be checked.
Six things to make equal before an ESG benchmark means anything
| Dimension | The trap | The fix |
|---|---|---|
| Scope 2 method | Market-based figures for some companies and location-based for others | One method for the company and the peer set; label it |
| Boundary | An acquisition consolidated for part of the year in emissions but all of it in revenue, or the reverse | Same boundary and period for numerator and denominator; restate last year if the boundary moved |
| Currency | Revenue in dollars for some companies and euros for others, or converted at different dates | One currency and one stated rate, usually the period average |
| Year | The company's current year against peers' previous year | State the vintage of the peer data; the sample benchmark's 2026 edition carries FY2025 data |
| Sector | A software firm compared with a logistics fund median | Compare within a sector classification, and say which one |
| Estimates | Peers' estimated figures against the company's reported ones | Know which peers reported and which were estimated, and how |
The sector row carries more weight than it seems. Classification systems disagree at the edges, which is why the ISSB's December 2025 amendments to IFRS S2 now "permit the use of alternative classification systems—beyond the Global Industry Classification Standard—to disaggregate information about financed emissions" (IFRS Foundation, 11 December 2025). A GP can use whichever system it prefers, but must use one and name it.
The estimates row matters because peer data is often modelled. Researchers comparing corporate carbon data from third-party providers concluded that providers need to be more open about how they estimate (Busch, Johnson and Pioch, Journal of Industrial Ecology, 2022). A private company compared with a peer median that is partly estimated is being compared with a model. That is acceptable if the report says so, and not if it does not.
When is a peer group too small?
No regulator sets a minimum peer count, so set your own and print it. A median of four companies moves several places when one of them changes, and a median from a sector the benchmark barely covers says more about its sample than about your company. Show the peer count and the spread beside every median, and decline to benchmark where the count falls below the line you set.
What to print beside every benchmark median
86
peers in the sample company's sector group: enough for a median and a middle half
19.4–47.8
the middle half of those peers, which shows how far apart normal companies sit
FY2025
the vintage of the peer data set against the company's FY2026 figure
Six tests before a peer comparison goes into an LP report
- Enough peers
Set a minimum count for a median and print the count. Below it, compare with the company's own history instead.
- A spread, not only a median
Show the middle half. A company 10% above a median inside a wide band is ordinary; 10% above inside a narrow band is not.
- Same method and scope
The company and the peers on the same Scope 2 method and the same scopes; label both.
- Vintage stated
Peer data a year older than the company's is common; say so in the line, not only in a footnote.
- No open outliers in the median
Hold back any value still being explained, from the company's position and from the fund's median.
- Reproducible
Someone else can rebuild the figure from the approved dataset and the named peer table.
Holding back an outlier from the median
A benchmark is also a filter. A value that sits several times above its peer median is either a remarkable business or a reporting error, and the second is far more common. Including it before it is explained moves the fund's median and puts the error into the LP report's context sentence.
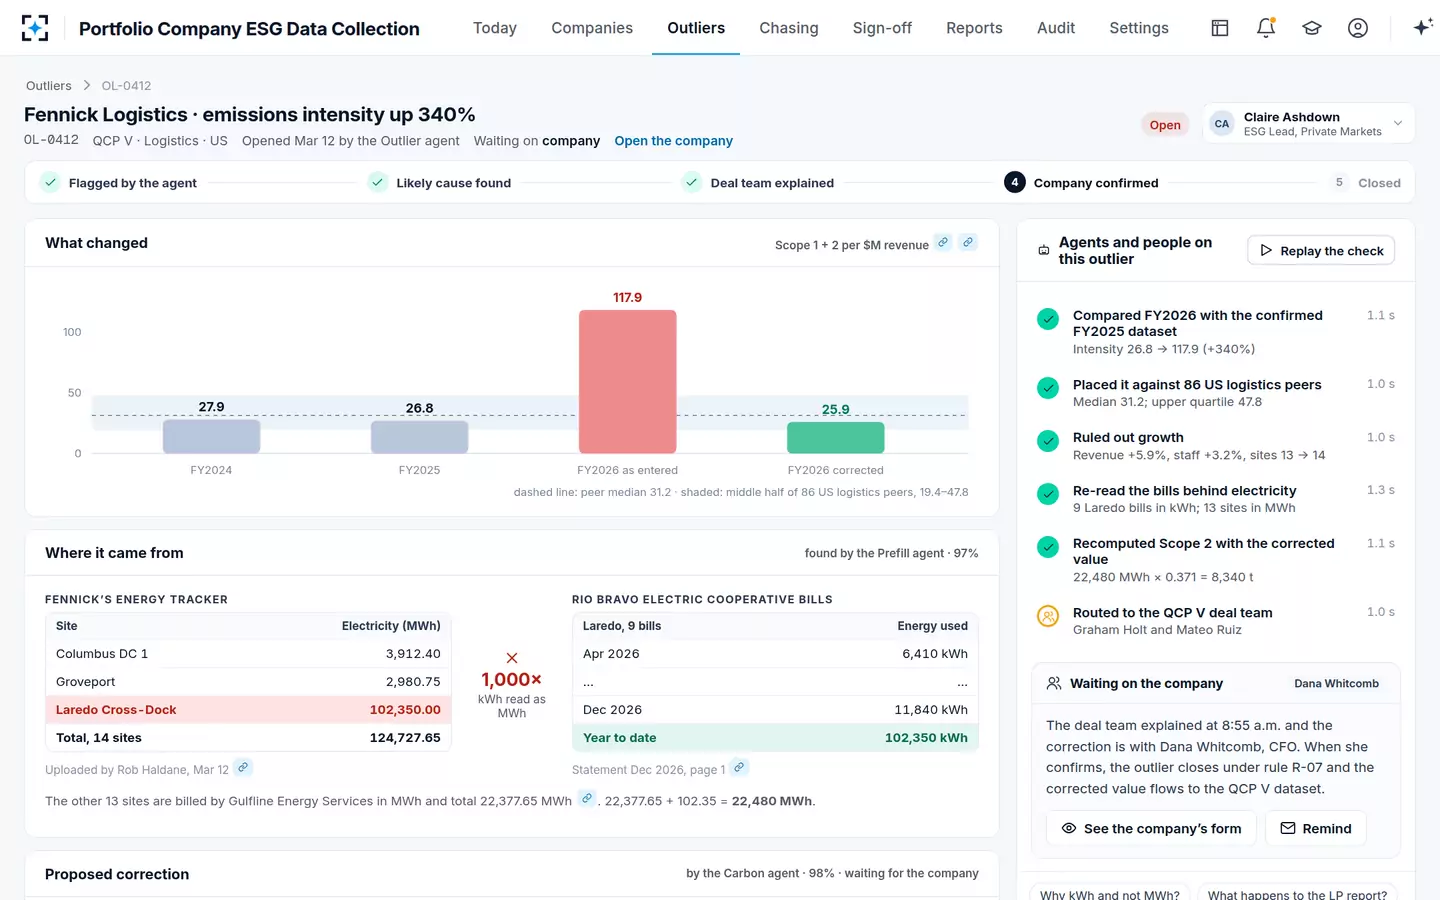
In the sample campaign, Fennick Logistics' first figure put it at 117.9 tonnes per million dollars against a logistics peer median of 31.2, nearly four times the median. The solution's rule flags any value more than three times its peer median, and the Benchmark agent held Fennick out of the fund's comparison until the deal team explained it and the company confirmed the corrected figure, 25.9. The checks the agents ran on the way are shown below.
How the agents placed the outlier against peers in Portfolio Company ESG Data Collection, step by step
ESG benchmarking report: what the LP line should say
The sentence an LP reads should carry its own context: the metric and unit, the fund's figure, the peer figure, the peer group and its vintage, and anything held back. The sample fund's draft line reads that the companies' median emissions intensity was 12.8 t CO2e per $M of revenue in FY2026 against a peer median of 14.6, and it is used only after the fund dataset is approved. A complete line would add the peer table's edition and that one company's value was corrected before reporting.
Two phrasings to avoid. "Better than peers" without the metric and the peer group is a claim no one can check; and a fund median compared with a median of all peers across sectors mostly reports the fund's sector mix. The private equity ESG report covers the rest of the LP section.
ESG benchmarking tools: licensed tables, your own history, or both
A GP has three sources of comparison, and good tools use all three. A licensed peer table gives sector medians for companies the GP does not own. The GP's own history, the same companies year after year, is the comparison least affected by definitions, because the GP controls them. And the fund's other companies give a cross-section with identical definitions, but rarely enough peers in any one sector. What to look for in a tool follows: it should name the peer table and its vintage, show counts and spreads, normalise numerator and denominator before comparing, hold back open outliers, and let anyone rebuild a figure from approved data.
Where the solution fits: its Benchmark agent places each company and fund against the licensed peer table the GP already holds and against the GP's own history, holds back open outliers, and drafts the LP line once the fund dataset is approved; it never publishes. It does not supply peer data of its own, and it cannot make a thin peer group thicker. Where the peer table has too few companies in a sector, the honest output is the company against its own history. Unit and factor errors are better caught before benchmarking; converting kWh to tCO2e shows how. To see the benchmarks on your own portfolio, start from Portfolio Company ESG Data Collection.
Questions people ask
Should emissions intensity be per revenue or per employee?
Per revenue is the more common choice, and the SFDR's energy intensity indicator uses it, per million euros of revenue. Per employee suits labour-intensive services where revenue swings with prices. Pick one per metric, apply it to every company and every peer, and do not switch without restating prior years.
Can private companies be benchmarked against listed companies?
Yes, if the definitions match, and that is the catch: listed companies' figures come from their own reports or from providers' estimates, while a portfolio company's come from its bills. Know which peers reported and which were estimated, and say so when the comparison goes into a report.
How often should ESG benchmarks be updated?
Once a year, when the peer table's new edition arrives, and always with its vintage stated. Peer data is usually a year behind the portfolio's own: in the sample campaign, FY2026 company figures sit against a 2026 edition carrying FY2025 data.
What is a good emissions intensity for a portfolio company?
There is no single good number, because intensity varies by an order of magnitude between sectors. In the sample benchmark, the software peer median is 3.0 t CO2e per $M of revenue and the packaging median 60.0. The useful questions are where a company sits within its sector's spread and whether it is moving the right way against its own history.
What are the main ESG benchmarking methods?
Comparison with a sector peer median and spread, with the company's own history, and with a target or pathway. The first needs comparable definitions across companies; the second needs a stable boundary; the third needs a target defined in the same units. Most LP reports use the first two together.