A rate covenant is a revenue bond issuer's promise to set rates and charges high enough that net revenues each year cover debt service by at least a stated multiple, such as 1.20 or 1.25 times. The covenant is only as good as the arithmetic behind it, and that arithmetic is defined by the bond resolution, not by the financial statements: which revenues count, which operating costs come off, which debt service is in the denominator. A ratio built from the income statement can tie to every audited total and still be the wrong number for the covenant, in either direction. Botminds' Municipal Credit Analysis tests rate covenants by the resolution's own definitions: its Pledge agent maps each audited number onto the resolution's terms with the section cited, its Checker re-derives the ratio independently, and an analyst reviews the result before anything reaches a credit view.
The examples on this page are public, except where marked: the City of Houston's FY2025 annual comprehensive financial report, an SEC enforcement case, and accounting standards from the Governmental Accounting Standards Board (GASB). The sample credit, the City of Harlow Bend, Ohio, is fictional data from the solution.
One utility, two coverage ratios, and a case where the reported one hid 0.11
1.31x
Houston utility: fund statement operating income over debt service, FY2025 (our arithmetic)
2.15x
the same utility's coverage as its master ordinance defines net revenues
0.11
Westlands Water District's real 2010 coverage, reported to investors as 1.25
What is a rate covenant?
A rate covenant is one of the system covenants in a revenue bond resolution: the issuer agrees to charge enough for its service to pay operating costs and debt service with a margin to spare. California's debt advisory commission lists it as a promise to "set rates at levels sufficient to produce net revenues with a minimum specified ratio to debt service (e.g., Net revenues must equal at least 1.25 times debt service). This is known as a 'rate covenant'" (CDIAC, California Debt Financing Guide).
The margin is called coverage. In the commission's example, a water resolution requires the issuer to collect enough for all operating expenses and debt service "plus an amount equal to 25% of debt service on the bonds. The additional 25% is referred to as coverage." The covenant is a floor, not a target, and the guide says so plainly: "The rate covenant reflects, of course, only the contractual minimum amount of debt service coverage." The same guide notes that agencies seeking strong ratings may aim higher, and that a rate stabilization fund lets an issuer carry surplus coverage from good years into bad ones.
What coverage does a rate covenant require?
Whatever the resolution says, and resolutions say different things. The multiple, the definition of net revenues and the debt service it is measured against all vary. Houston's combined utility system shows how specific the wording gets: its master ordinance "requires the Combined Utility to generate Net Revenues in each fiscal year at least equal to the greater of 120% of the combined debt service on all Previous Ordinance and First Lien Revenue Bonds outstanding, or 110% of the combined debt service on all Previous Ordinance, First Lien and Second Lien Revenue Bonds outstanding" (City of Houston, FY2025 ACFR, note 15).
That one sentence holds two tests, two sets of liens and a "greater of" rule. A spreadsheet that applies a single 1.20 times hurdle to all debt service would be testing a covenant the ordinance never wrote. The sample credit's ordinance is simpler, 1.25 times on all debt service in section 7.01, and its additional bonds test sets a different hurdle again, 1.30 times, as the additional bonds test guide works through.
How is debt service coverage calculated for a revenue bond?
Debt service coverage for a revenue bond is net revenues, as the resolution defines them, divided by the debt service the covenant measures for the year. The definitions are where the work is. The California guide explains that they "are based on generally accepted accounting principles (GAAP), but are consistent with the reality that debt service must be paid in cash when due, GAAP definitions are modified to exclude non-cash items." Operating and maintenance expenses "exclude depreciation, replacement or obsolescence charges and amortization". Revenues usually leave out grants and contributions, and the guide warns that "distortion can occur if asset values change and are included in revenues before the value change is realized."
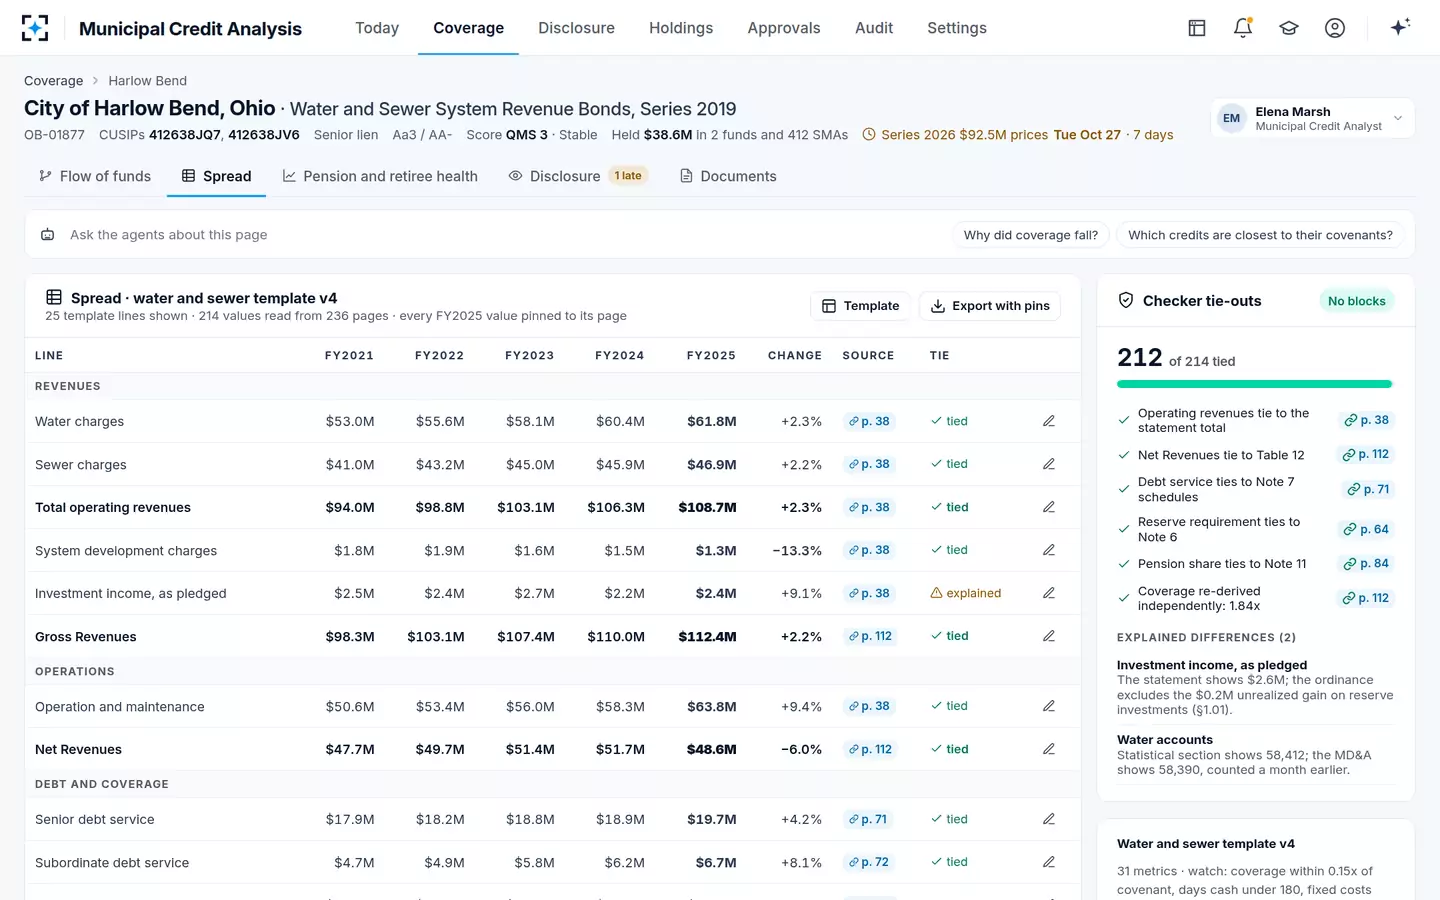
Each of those rules moves the ratio away from what the financial statements show. Depreciation is the largest: it is an operating expense under GAAP and typically excluded from operation and maintenance in a resolution. Investment income is the subtlest: it sits below operating income on the statements, may be counted by the resolution, and may include unrealized gains the resolution excludes. In the fictional sample credit, the Checker found exactly that: the statements show $2.6 million of investment income; the ordinance's section 1.01 excludes a $0.2 million unrealized gain on reserve investments, so pledged revenues carry $2.4 million.
Same utility, two coverage ratios: 1.31x and 2.15x
Houston's FY2025 report lets anyone see how far the two methods can drift on one real system. Its combined utility fund statements report $1,655.6 million of operating revenues and $949.5 million of operating expenses, of which $332.3 million is depreciation and amortization. Its revenue bond coverage schedule, computed under the master ordinance, reports net revenues of $1,162.6 million against $540.3 million of debt service: 2.15 times.
Houston's combined utility, FY2025: the shortcut (operating income over debt service) and the ordinance (net revenues as defined)
The shortcut: Operating revenues only: $1,655.6M.
The ordinance: Gross revenues of $1,758.4M: operating revenues plus $102.8M of non-operating revenues the ordinance counts.
The shortcut: All operating expenses, $949.5M, including $332.3M of depreciation and amortization.
The ordinance: Maintenance and operating expenses of $624.9M and $6.3M of contract payments: $631.3M, no depreciation.
The shortcut: None.
The ordinance: Adds $35.5M of restricted receipts under the master ordinance.
The shortcut: Operating income: $706.0M.
The ordinance: Net revenues: $1,162.6M.
The shortcut: 1.31x
The ordinance: 2.15x
Both columns tie to audited numbers; only one is the covenant. Here the shortcut understates coverage, mostly because it charges $332.3 million of depreciation against revenues that the ordinance never asked to cover it. An analyst using it would see a utility near a typical 1.20 times hurdle when its own documents show it at 2.15 times. The error runs the other way just as easily: count an unrealized investment gain, a one-time transfer or a grant the resolution excludes, and coverage looks stronger than the covenant allows. A coverage ratio is valid when it ties; it is accurate only when it follows the definitions.
Houston's utility coverage under its ordinance, ten years
When the number ties and still misleads: the Westlands case
The SEC has charged an issuer over exactly this gap between a reported ratio and the real one. Westlands Water District, the SEC said, had "agreed in prior bond offerings to maintain a 1.25 debt service coverage ratio". When drought cut its revenue in 2010, it used "extraordinary accounting transactions that reclassified funds from reserve accounts to record additional revenue". In a $77 million offering in 2012 the district "represented to investors that it met or exceeded the 1.25 ratio for each of the prior five years". Without the entries, "Westlands' coverage ratio for 2010 would have been only 0.11 instead of the 1.25 reported to investors" (SEC press release 2016-43, March 9, 2016).
The district settled without admitting or denying the findings and paid $125,000, which the SEC said made it "only the second municipal issuer to pay a financial penalty in an SEC enforcement action"; its general manager and former assistant general manager paid $50,000 and $20,000. The lesson for an analyst is not that issuers lie; it is that a coverage figure in an offering document is an output, and the inputs that produced it, including one-time transfers and reserve releases, are what the covenant test has to be rebuilt from.
GASB 103 changes what "operating income" means
The ACFR line most often used as a shortcut is changing. GASB Statement No. 103, Financial Reporting Model Improvements, issued in April 2024, applies "for fiscal years beginning after June 15, 2025", so a utility with a June 30 year end reports under it for the first time in its fiscal 2026 statements (GASB, Summary of Statement No. 103).
For proprietary funds, the statement defines nonoperating revenues and expenses as "(1) subsidies received and provided, (2) contributions to permanent and term endowments, (3) revenues and expenses related to financing, (4) resources from the disposal of capital assets and inventory, and (5) investment income and expenses", and everything else as operating. It adds a new subtotal, "operating income (loss) and noncapital subsidies". The GASB expects the definitions to "replace accounting policies that vary from government to government".
That will make operating income more comparable between utilities. It will not make it the covenant's number. Depreciation is not on the nonoperating list, so it stays in operating expenses, and investment income moves firmly below the line, even where a resolution counts it. A coverage series that mixes pre- and post-103 statements, or that switches from the old line to the new subtotal, can shift without any change in the system. The safe course is the one the covenant requires anyway: map each year's numbers to the resolution's definitions and keep the mapping with the citation.
Testing the covenant by the resolution's words
Testing a rate covenant properly is a short procedure that is easy to skip. It is the same for every revenue credit, which is what makes it suitable for agents working under an analyst's review.
Seven checks before a rate covenant result goes into a credit view
- Start from the resolution's definitions section
Gross revenues, operation and maintenance expenses, net revenues and debt service, with the section number for each.
- Remove what the resolution removes
Depreciation and amortization, and any non-cash item the definitions exclude.
- Count only the revenues it counts
Investment income as pledged, without unrealized gains if the definitions say so; grants and contributions usually out.
- Find every one-time item
Transfers in, reserve releases and rate stabilization withdrawals: allowed by the resolution, or a Westlands problem?
- Use the right debt service
The year the covenant measures, at the lien or liens it names, and every parity loan, not only the public bonds.
- Tie to the ACFR's pledged-revenue coverage schedule
If the issuer computes coverage on the resolution's terms, your number should match; explain every difference.
- Show the headroom
How far net revenues can fall before the covenant fails, in dollars and in percent.
On the sample credit the procedure gives 1.84 times: $48.6 million of net revenues over $26.4 million of all debt service, against the 1.25 times covenant in section 7.01. The headroom is the number an analyst should quote alongside it. Net revenues could fall 32%, or $15.6 million, before coverage reaches 1.25 times; the covenant breaks below $33.0 million. The solution shows both, and draws the analyst's stresses on the same scale.
The spread behind the covenant test, with every value pinned and two differences explained
What happens if a utility breaks its rate covenant?
Usually not a payment default, at least not at first. Missing the multiple is a covenant default, which, as the California guide puts it, "may be required to be material", with the issuer "generally allowed a period of time (e.g., 30 days) to cure or remedy a default before it becomes an Event of Default". What follows is whatever the resolution provides, from a duty to revise rates to remedies for bondholders, so the remedies section is read with the covenant.
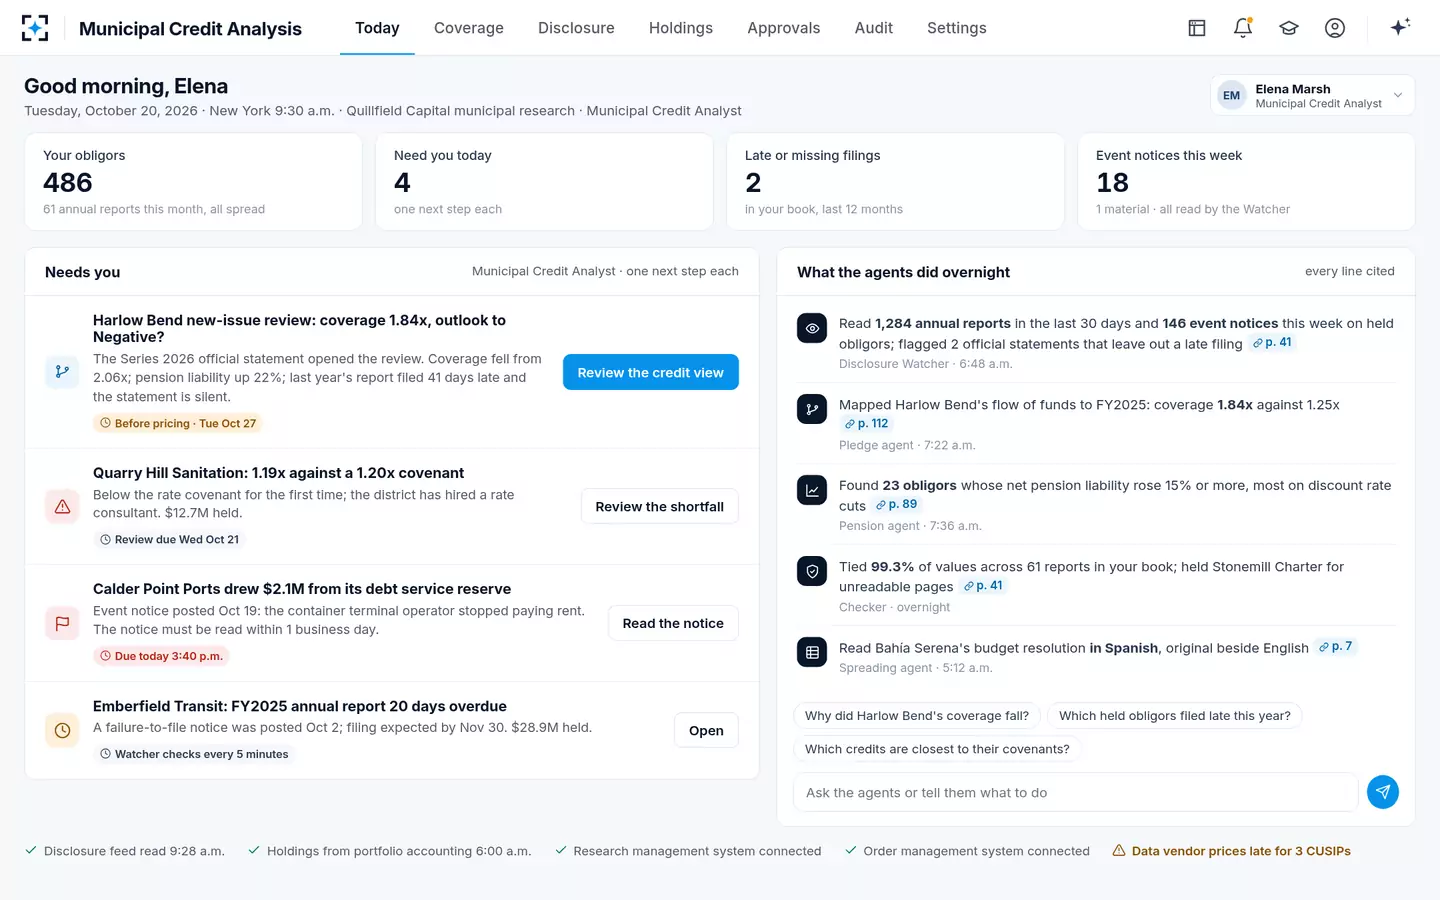
For investors the immediate consequence is information. Under Rule 15c2-12, issuers undertake to post notice of "non-payment related defaults, if material" within ten business days (17 CFR 240.15c2-12(b)(5)(i)(C)(2)). The fictional Quarry Hill Sanitation District in the sample book shows the earlier warning: 1.19 times against a 1.20 times covenant, below for the first time, with a rate consultant hired. A team that tests coverage only when the ACFR arrives sees that the day it is spread, not the year after. How late those reports can be is the subject of the EMMA alerts guide.
A covenant shortfall surfaces with the morning's other work, one next step each
Questions people ask
What is net revenues in a bond resolution?
Gross revenues as the resolution defines them, less operation and maintenance expenses as it defines them. It is usually close to, but not the same as, operating income plus depreciation: definitions decide whether investment income, grants, transfers and one-time items count. Houston's utility reported $1,162.6 million of net revenues under its master ordinance in FY2025, against $706.0 million of operating income derived from its fund statements.
What is a rate stabilization fund?
A fund that lets a utility set aside revenue in strong years and draw it in weak ones, counting the transfers toward coverage if the resolution allows. The California guide describes it as allowing "the public agency to use deposits from excess debt service coverage to supplement coverage in later years". An analyst should know how much of a year's coverage came from such a draw.
Is a 1.25x rate covenant the same as 1.25x coverage in the ACFR?
Only if the ACFR computes coverage on the resolution's definitions, which a well-prepared pledged-revenue coverage schedule does and the fund statements do not. Houston's schedule shows 2.15 times on its ordinance terms; a ratio built from its operating income would show 1.31 times.
Does GASB 103 change debt service coverage?
It changes the statements coverage is often built from, not the covenant. From fiscal years beginning after June 15, 2025, investment income and financing-related items are nonoperating in proprietary funds and a new operating income and noncapital subsidies subtotal appears. The covenant still uses the resolution's own definitions.
Where is debt service coverage in an ACFR?
In the statistical section, usually in a pledged-revenue coverage schedule among the debt capacity tables. Houston's FY2025 report has it on page 273, ten years of net pledged revenue, principal, interest and coverage for each revenue-backed system, and a separate utility coverage schedule on page 288 that shows the ordinance's own calculation.
Who checks the rate covenant calculation?
The issuer reports it, its auditor audits the statements it is built from, and investors test it themselves. In the solution the Pledge agent computes it from the resolution, the Checker re-derives it independently and ties it to the ACFR's coverage schedule, and the analyst and a senior analyst review it before any view changes.