A municipal bond analysis tool earns its place by lowering the cost of a full credit review, not by adding another screen of data. The reason is the shape of the market: 62% of 2025's tax-exempt issues were $25 million or smaller, and a $10 million water district bond can take as many hours to review properly as a $500 million airport bond. When every review costs the same, research teams spend their hours on the largest holdings, and the smallest issuers, often with the thinnest disclosure, get a glance. Botminds' Municipal Credit Analysis is built for that problem: agents read every filing for every held obligor on the MSRB's EMMA website, spread each annual report into the team's template with every value pinned to its page, test coverage by the bond resolution, and draft the view, so the analyst's time goes to judgement on every credit. It is not a pricing service, a rating or a replacement for the team's methodology, and this guide is explicit about the difference.
Product figures here come from the solution's fictional sample firm, Quillfield Capital, and are labelled as sample data, targets or estimates; market figures come from the MSRB, the Federal Reserve and the SEC.
The municipal market a tool has to cover
$582B
of municipal bonds issued in 2025, a record, up 13% on 2024
8,854
tax-exempt issues in 2025, of which 5,447 were $25 million or less
65,082
annual financial filings posted to the MSRB a year, on the SEC's three-year average
$1.24T
of municipal securities held by mutual funds, money market funds, ETFs and closed-end funds
What should a municipal bond analysis tool do?
A municipal bond analysis tool should do the reading a credit review needs, prove where every number came from, and leave the judgement to the analyst. In practice that is six jobs: notice every annual report, official statement and event notice for every held obligor; spread the annual report into the team's own sector template; read the bond resolution and test coverage by its definitions; watch each obligor's filing deadline as well as its notices; keep the source page for every figure; and support the maker-checker sign-off a credit view needs.
The last two are what separate a research tool from a data feed. A spread that cannot be traced back to its page has to be checked by hand before a senior analyst will sign it, which puts the hours straight back. And a tool that changes a view, a limit or an order on its own is not one a research team can defend to its fund board or an examiner.
How many municipal bonds are issued each year, and how small are they?
The MSRB counts $582 billion of municipal bonds issued in 2025, a record, of which $525 billion was tax-exempt, in 8,854 tax-exempt issues (MSRB, Municipal Market Facts). The average tax-exempt issue was therefore about $59 million, our arithmetic, but the average is pulled up by a few large deals: 41 issues were over $1 billion. The typical issue is small. Some 2,099 issues, 24%, were $5 million or less, and another 3,348, 38%, were over $5 million and up to $25 million.
The outstanding stock is equally spread out. The Federal Reserve puts municipal securities outstanding at $4,414.5 billion at the end of 2025 and $4,541.1 billion by mid-2026 (Federal Reserve, Z.1). Behind that are tens of thousands of obligors, each with its own annual report, its own bond documents and its own deadline.
Why small issuers get the least analysis
Because the cost of a review is fixed per obligor while the benefit scales with the size of the holding. The product data estimates a full review of one revenue bond obligor at 7.0 hours by hand. That is the same 7.0 hours whether the fund holds $2 million of the credit or $40 million. Per million dollars held, the small position costs twenty times as much to review.
Review hours per $1 million held: the small position costs most, until the review gets cheap
A desk short of time therefore ranks its work by exposure, and the ranking makes sense on any one day. Over a year it leaves most obligors unreviewed. That matters because the market does price small-issuer information. Reviewing the academic work for its 2018 amendments to Rule 15c2-12, the SEC found that "most of the available studies on disclosure and municipal borrowing costs provide evidence that more disclosure regulation or stringent accounting and auditing requirements are associated with lower municipal borrowing costs" (SEC, 83 FR 44700, 2018). Information about these credits has value; reading it has simply been too expensive for most of them.
A tool that cuts the review from 7.0 hours to 1.2, the product data's estimate with the agents, changes the ranking rather than the effort. At 0.60 hours per million held, a $2 million position reviewed with the agents costs less per million than a $10 million one did by hand. The design target follows from that: every held obligor spread every year, not the largest names only.
How much does municipal credit research cost?
No regulator or independent study publishes what municipal credit research costs, and software vendors don't publish prices, so the useful answer is a method you can run on your own numbers. Multiply obligors by hours per full review, and the hours by your fully loaded analyst cost. The hours are the part teams rarely measure, and the part a tool changes.
The hours a full annual review of every obligor would take: run it with your own numbers
| Step | Hours per obligor, by hand | With the agents | Sample book: 4,012 obligors, by hand | With the agents |
|---|---|---|---|---|
| Notice the filing, check it against the disclosure agreement | 0.5 | 0.05 | 2,006 | 201 |
| Spread the ACFR into the sector template | 3.0 | 0.25 | 12,036 | 1,003 |
| Read the resolution, rebuild coverage | 1.5 | 0.25 | 6,018 | 1,003 |
| Pension and retiree health notes | 1.0 | 0.15 | 4,012 | 602 |
| Write the view, senior review | 1.0 | 0.5 | 4,012 | 2,006 |
| Total | 7.0 | 1.2 | 28,084 | 4,814 |
Two things in the table are worth noticing before any price is discussed. The by-hand total, 28,084 hours, is more than fourteen analyst-years at 1,920 hours each, our assumption, against eight analysts in the sample team: the gap is the glance. And with the agents, the largest single block of hours is the view and its review. That is the part a research team exists to do, which is the honest test of any tool: after it, what share of the analysts' time is judgement?
What data sources do muni analysts use?
The core sources are public and free; the work is turning them into something comparable. EMMA, run by the MSRB, is the official repository: the SEC's 2008 amendments "designated the EMMA system as the single centralized repository for the electronic collection and availability of continuing disclosure information about municipal securities", and EMMA "provides free public access to disclosure documents" (SEC, 2018). Annual reports, official statements and event notices all arrive there, as documents.
Around EMMA sit the bond documents themselves, which the official statement summarises and sometimes appends; issuers' own websites; ratings and evaluated prices from data vendors; and, for context, Census Bureau and Federal Reserve statistics. What none of them provides is a standard, machine-readable version of each ACFR. Federal law now requires the SEC to set data standards for information submitted to the MSRB, but none applies yet, as the Financial Data Transparency Act guide dates in detail. For now, a tool has to read PDFs.
Five kinds of municipal bond analysis tool, compared
The tools a muni desk can use fall into five groups. They are not exclusive; most teams combine several. The comparison is about what each leaves to the analyst.
What each kind of tool gives a research team, and what it leaves to the analyst
| Kind of tool | What it gives you | What it leaves to the analyst |
|---|---|---|
| EMMA itself | Every filing, free; alerts on CUSIPs and groups of CUSIPs; trade data. | Reading, spreading and testing every document; tracking deadlines the alerts do not cover. |
| Spreadsheets and house templates | Full control of the method; the team's own definitions. | All the typing, all the tie-outs, and a trail back to the source that exists only if someone keeps it. |
| Vendor data terminals and databases | Prices, ratings, descriptive data and some standardised financial fields. | Checking fields against the source, and anything a standard field cannot express, such as a resolution's own definition of net revenues. |
| General document extraction software | Tables pulled out of PDFs into rows. | Mapping rows to the template, the resolution's logic, and checking what was misread. |
| Agents working under analyst sign-off | Spreads with every value on its page, coverage tested by the resolution, deadlines and notices watched, a drafted view. | Questioning the evidence, deciding materiality, signing the view, and setting the rules the agents follow. |
Can software spread an ACFR?
Yes, if spreading is measured by tie-outs rather than by how many fields come out. ACFRs are long and unstandardised: Houston's FY2025 report runs to 362 pages (City of Houston), and every issuer lays its statements out differently, some pages arrive as scans, and some obligors, such as the Puerto Rico credits in the sample book, file documents in Spanish. A spread is right when its totals tie to the audited statements and its coverage ties to the issuer's own coverage schedule, and when the differences that remain are explained.
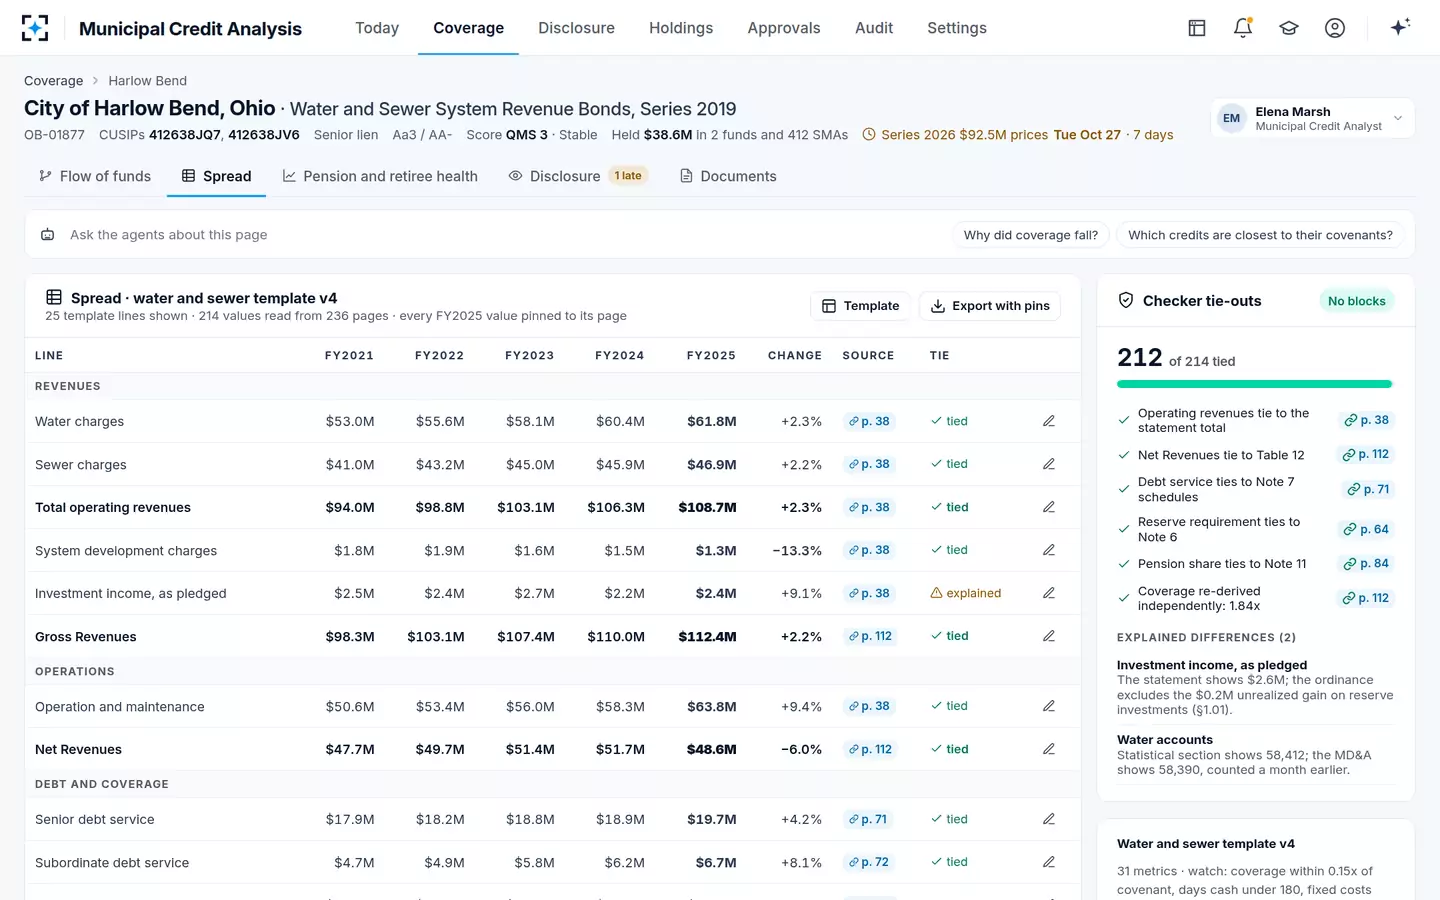
The sample credit shows the standard to ask for. The Spreading agent read 214 values from a 236-page report into the water and sewer template, FY2021 to FY2025, each with its page. The Checker tied operating revenues to the statement total, net revenues to the coverage table, debt service to the debt note and the reserve requirement to its note, and re-derived coverage independently at 1.84 times. Of the 214 values, 212 tied and two were explained; none was blocked. A value it cannot tie stops the spread, and only a person can release it, with a reason code. How to read the report the agents are reading is set out in how to read an ACFR.
A spread a senior analyst can sign: every value on its page, 212 of 214 tied
Questions to ask before buying a municipal bond analysis tool
Demonstrations are run on the vendor's chosen credits. The questions below are designed to be answered on yours, and most of them can be checked in a short pilot on a sample of your own obligors.
Nine questions for any municipal bond analysis tool
- Does it work in our templates and our definitions?
A spread in someone else's template is a second spread to reconcile.
- Can every value be traced to its page in one click?
If not, the senior analyst re-checks by hand and the hours come back.
- How does it prove a spread is right?
Ask for tie-outs to audited totals and to the issuer's own coverage schedule, with differences explained.
- Does it test coverage by each resolution's words?
A single standard ratio is a different covenant; see the Houston example in the rate covenant guide.
- Does it watch filing deadlines, not only new documents?
A filing that never arrives raises no alert on its own.
- What does it do with a page it cannot read?
Guessing is the wrong answer; holding the value and asking for a clean copy is the right one.
- What can it change by itself?
Nothing that is a decision: views, limits and orders should move only after a person approves.
- What does the audit trail record?
Who did what, when, why and on what evidence, including which version of each agent ran.
- How is a new version tested before it runs on our book?
Against a set of reports already spread and signed by our own analysts.
Where Municipal Credit Analysis fits, and where it does not
Municipal Credit Analysis fits a research team that holds municipal bonds across funds and separately managed accounts, keeps its own scores and templates, and wants every held obligor reviewed every year. It connects to the systems such a team already runs: the municipal disclosure feed, portfolio accounting, the order management system, the research management system, document management and a data vendor for ratings and evaluated prices. The design targets are every held obligor spread every year, about 500 per analyst on the sample team's numbers, and five days or less from a new annual report to a view signed by two people.
It does not fit a team looking for a price, a published rating or an outside opinion to adopt. It produces none of them; ratings and evaluated prices come from the data vendor. It does not contact issuers or underwriters, decide materiality or approve anything: those stay with named people, and the agents' limits are part of the configuration. And it needs the team's own inputs, its sector templates, score rubric, research policy and a sample of past spreads, before it is useful. A team without settled templates will find the work starts there.
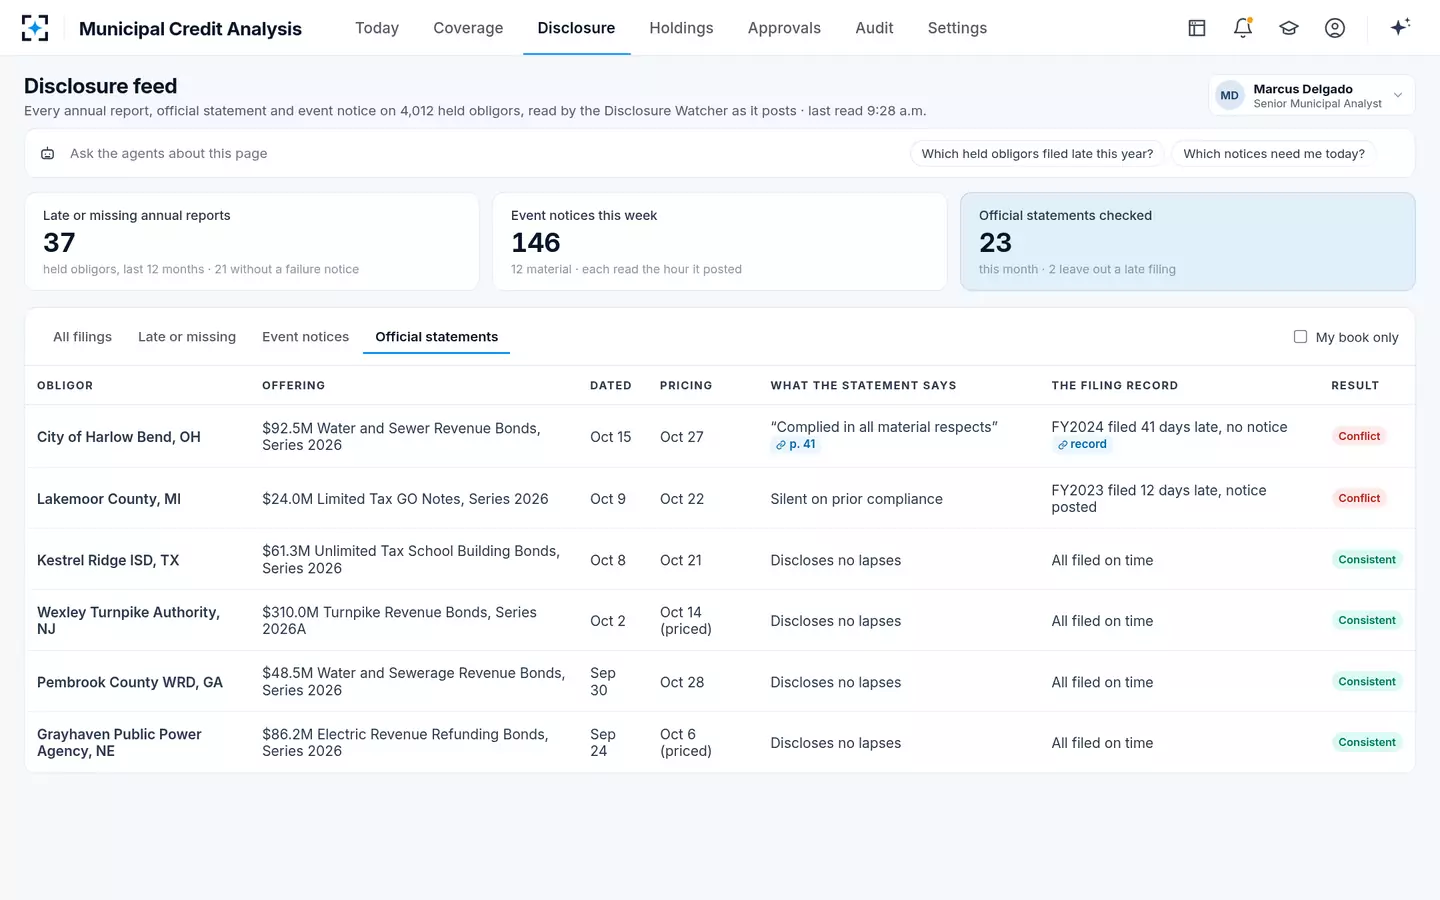
Official statements checked against the filing history before pricing
Questions people ask
What is the best municipal bond analysis tool?
The one that lets your team review every held obligor properly with the analysts you have. Judge candidates on your own credits: traceability of every value, tie-outs to audited totals, covenant tests by each resolution, deadline watching and an audit trail. A tool that only adds data adds reading.
How do you analyze small municipal issuers?
The same way as large ones: spread the annual report, read the bond documents, test coverage and watch disclosure. The difference is economic, since the review costs the same hours on a smaller holding. In 2025, 62% of tax-exempt issues were $25 million or less, so a method that cannot afford small issuers cannot cover most of the market.
Is EMMA enough for municipal credit analysis?
EMMA is the indispensable source and it is free, but it is a repository of documents, not an analysis. It does not spread reports, test covenants or tell you when a filing is late against an obligor's own deadline; a team still needs a method, and the hours, to do that.
What does municipal credit software cost?
Vendors don't publish prices, so build the comparison from hours. Estimate your hours per full review today, multiply by obligors and loaded cost, and compare that with the tool's price plus the analyst hours it still needs. On the product data's estimates, the hours fall from 7.0 to 1.2 per obligor.
What does a team need to start?
Its holdings by fund and account, its sector templates and score rubric, its research policy and thresholds, and a sample of past spreads to test against. Setup connects the systems, loads the coverage universe from holdings and backfills ten years of filings, as set out in building your own ACFR data archive.
Will a tool replace municipal credit analysts?
Not in this design. The agents read, spread, check and draft; they never submit, approve or publish a view. What changes is the share of an analyst's year spent judging rather than typing, and the number of obligors that get a real review.