Solvency II solutions for fund holdings exist to answer one question: can the insurer see what is inside each fund well enough to charge capital on the real assets, instead of on the fund as an opaque equity? If it can, a fund of investment-grade bonds attracts spread and interest rate charges; if it cannot, and the target-allocation fallback is not available, the fund is a type 2 equity, shocked by 49% plus the symmetric adjustment. On 30 September 2026 that was 56.71% of the fund's value. Worked on one illustrative €100 million fund below, full look-through cuts the standalone stress from €56.7 million to €22.9 million. Botminds' Look-Through Risk Analysis reads managers' own reports to their holdings, ties them to the NAV and drafts the insurer's look-through files, so more of a portfolio qualifies for the lower charge.
The numbers in the worked example are our own illustrative arithmetic under the Solvency II standard formula, not a capital calculation for any insurer. Screens come from the solution on a fictional sample portfolio.
One €100 million fund, three treatments: the standalone stress on the same holdings
How much capital does look-through save? The gap, worked on one fund
On the illustrative fund, the saving is €33.8 million of standalone stress, or 60% of the type 2 charge, and almost all of it comes from the bonds. The equities attract nearly the same charge either way: listed in the EEA, they are type 1, shocked at 39% plus the symmetric adjustment instead of 49% plus it. The bonds are where the opaque treatment hurts, because a 5-year bond at credit quality step 2 is stressed by 7% in the spread sub-module but by 56.71% when it is hidden inside a fund nobody can see into.
The worked example, line by line
| Holding | Not looked through | Fallback: target allocation | Full look-through |
|---|---|---|---|
| €60M corporate bonds, duration 5 | Part of the fund: 56.71% | Grouped prudently as CQS 3: 2.5% × 5 = 12.5%, €7.50M | Actual CQS 2: 1.4% × 5 = 7.0%, €4.20M |
| €40M EEA-listed equities | Part of the fund: 56.71% | Type 1: 39% + 7.71% = 46.71%, €18.68M | Type 1: 39% + 7.71% = 46.71%, €18.68M |
| Whole fund | €56.71M | €26.18M | €22.88M |
| Reported in S.06.02 item C0292 as | 4 – equity risk type 2 | 2 – simplified, with data groupings | 1 – full look-through |
The example flatters nothing. A fund holding unlisted equity or high-yield bonds saves less, because its real assets are charged heavily anyway; a fund of short government bonds saves more. And the real SCR is lower than the sum of standalone stresses because the sub-modules are aggregated with correlations. What the example shows is the order of magnitude, and the reason: an opaque fund is charged as if it were the riskiest thing an insurer can hold.
What is the type 2 equity charge?
The type 2 equity charge is the Solvency II standard-formula shock for equities that are not listed in the EEA or the OECD, for commodities and other alternatives, and for funds the insurer cannot look through. Article 168(3) of Delegated Regulation (EU) 2015/35 puts into type 2 any fund exposure that cannot be looked through when the insurer does not use the Article 84(3) fallback, and Article 169(2)(c) sets the shock at "the sum of 49 % and the symmetric adjustment" (Delegated Regulation 2015/35).
Two lower shocks exist inside type 2 and do not help here: 22% for strategic participations and for equities that qualify as long-term equity investments. A fund that cannot be looked through rarely meets those tests, which is why the look-through approach and the regimes around it treat the type 2 charge as the default penalty for opacity.
The four numbers that set the price of an opaque fund
49%
type 2 equity shock, before the symmetric adjustment (Art. 169)
7.71%
EIOPA symmetric adjustment, 30 September 2026
±13%
band for the symmetric adjustment from 30 January 2027, up from ±10%
20%
cap on assets valued with data groupings under the Art. 84(3) fallback
What is the symmetric adjustment, and where was it on 30 September 2026?
The symmetric adjustment is a counter-cyclical add-on to the equity shocks, published by EIOPA, that rises after strong equity markets and falls after weak ones. EIOPA's calculation compares its equity index with the index's average over the last 36 months and takes half of the difference between that gap and 8 points; on 30 September 2026 the index stood 23.4% above its average, giving 7.71% (EIOPA, symmetric adjustment, September 2026). EIOPA lists its next publications for 5 November and 3 December 2026.
For an opaque fund the symmetric adjustment is a pure market bet. When equity markets have risen, the charge on a hidden bond fund rises too; on 30 September 2026 it was 56.71% rather than 49%. A looked-through bond fund carries no equity charge on its bonds, so the adjustment touches only the equities inside it.
The fallback in between: target allocation and the 20% cap
Between full look-through and the type 2 charge sits the Article 84(3) fallback: where the look-through cannot be applied, the capital requirement may be worked out from the fund's target allocation or, failing that, its last reported allocation. Data groupings must be prudent and may cover no more than 20% of the insurer's total assets (Article 84(3); quoted in what is the look-through approach).
The fallback is worth most of the saving in the example, but it is fragile in practice. It needs a fund managed strictly to a published allocation, which excludes most tactical and multi-asset mandates; it needs evidence, since EIOPA expects insurers to check the allocation against "information on the actual holdings of the fund"; and it is capped. For an insurer whose funds are a third of its balance sheet, the 20% cap alone means the fallback cannot carry the whole fund book.
That last point is not hypothetical. Euro area insurers held €3.13 trillion of investment fund shares in the second quarter of 2026, 32.6% of their €9.62 trillion of total assets (provisional figures; ECB insurance corporation statistics). At that scale, full look-through is the only route that covers the book, and it is the route the regulation prefers.
What changes in Solvency II from 2027 for fund holdings?
Delegated Regulation (EU) 2026/269 applies from 30 January 2027 and changes three things for funds, while leaving the 49% untouched. The symmetric adjustment band widens: "The symmetric adjustment shall not be lower than – 13 % or higher than 13 %", so the charge on an opaque fund can move between 36% and 62%. The Commission's reason is that the old limits "may lead insurance and reinsurance undertakings to raise additional capital or sell assets in response to short-lived adverse market movements" (Delegated Regulation 2026/269).
The look-through for related investment vehicles now covers those that manage assets for "the participating undertaking or of any other undertaking of the group", closing a gap for group investment vehicles. And a new Article 171d lets certain lower-risk funds, such as European long-term investment funds and unleveraged closed-ended alternative investment funds, qualify as long-term equity investments, applied to the equities inside the fund where the look-through "can be applied to all exposures" and to the fund units where it "cannot be applied to all exposures". Look-through, in other words, decides which version of the new treatment a fund gets.
Reporting may change too. EIOPA's final report of 30 March 2026 proposes that S.06.03, the look-through template, be reported in the second and fourth quarters only, applying from 2027 if the European Commission endorses it (EIOPA final report on supervisory reporting). Fewer submissions would not change the capital rule: the SCR is still calculated on the underlying assets.
Why the saving depends on data you do not control
The capital saving is only as available as the managers' reports. A fund qualifies for full look-through when the insurer has its holdings, classified, for the reporting date, and that depends on what each manager sends, when, in what format and in what language. EIOPA's own analysis of insurers' look-through data notes that issuer country is missing for some asset classes held inside funds, and that roughly one-third of what insurers hold through funds is issued outside the EEA (EIOPA, Financial Stability Report, December 2025).
For a multi-manager book, the funds that miss the look-through are usually the same ones each quarter: private funds that report 45 to 75 days after quarter end, managers who send PDFs rather than structured files, reports in languages the team does not read. Those are the funds a Solvency II solution has to handle to be worth buying; a tool that only loads clean holdings files saves capital on the funds that were already looked through. The trade-off between approaches is laid out in portfolio look-through tools compared.
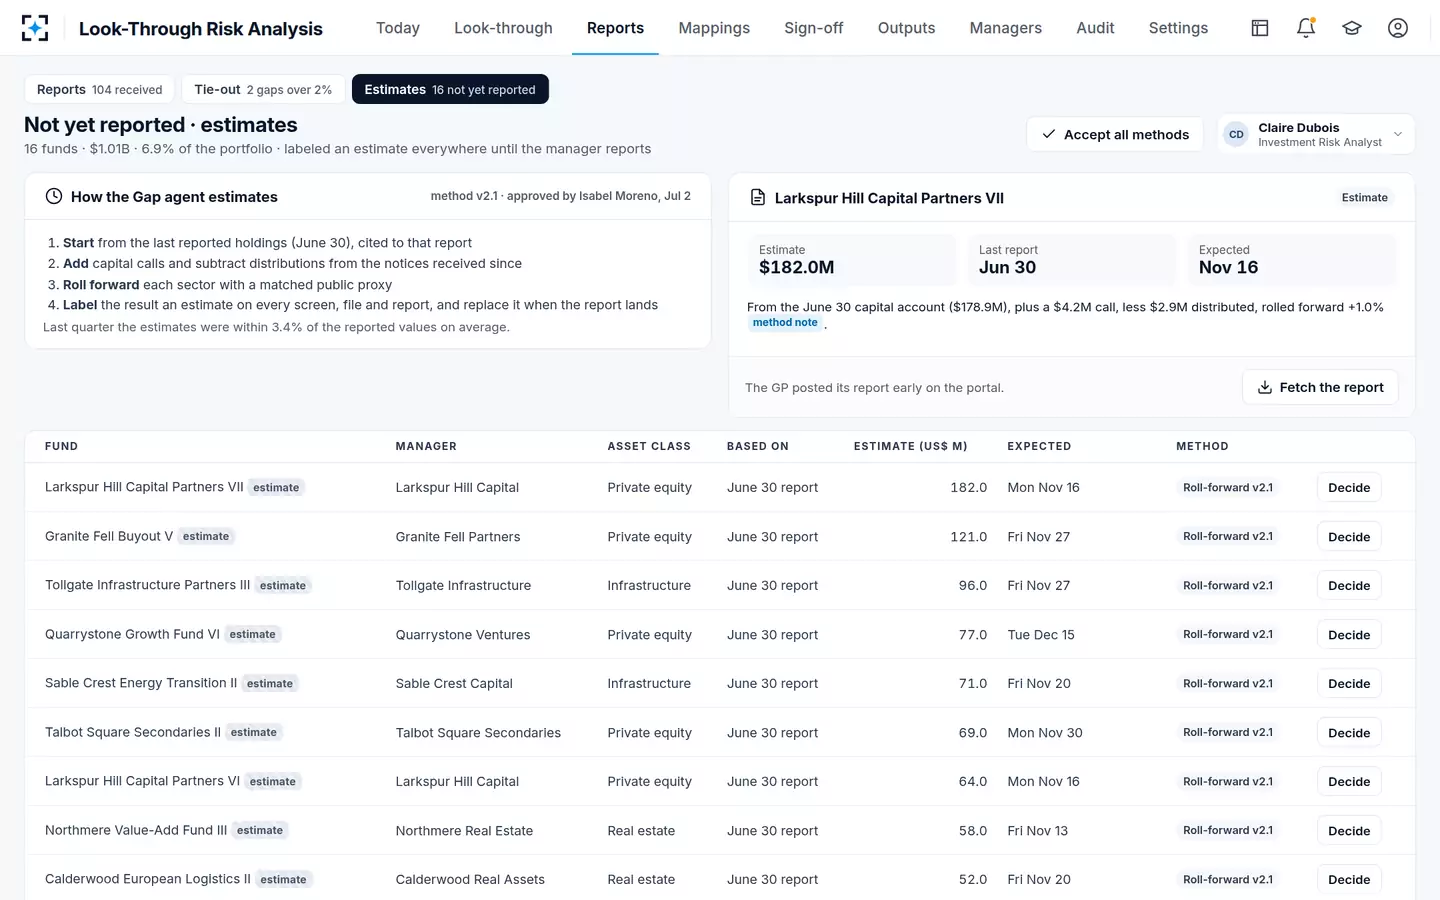
The funds that miss the reporting date, held at labelled estimates instead of dropped
What to look for in Solvency II solutions for fund holdings
Judge a Solvency II solution for funds on the funds you find hardest, not on a demonstration with clean files. The checklist below is what we would ask of any tool, including ours.
Questions to ask any Solvency II solution for fund holdings
- Does it read the reports you actually receive?
Scanned PDFs, capital account statements, reports in other languages, as well as structured holdings files.
- How deep does it look through funds of funds?
EIOPA asks for "a sufficient number of iterations" to capture all material risk.
- Does every line tie back to the manager’s NAV?
And is every gap over your tolerance explained from the report, not plugged?
- How does it treat funds that have not reported?
A labelled estimate with a method and a variance, or a silent copy of last quarter?
- Does it keep issuer country and country of risk apart?
S.06.03 needs the issuer’s address; your limits need country of risk.
- Does it produce what your reporting needs?
CIC on every line, S.06.03 categories, country and currency coverage, client files validated before release.
- Can every figure be traced to its page?
For the auditor, the supervisor and your own committee.
- Does it feed, not replace, your capital model?
Positions out to your SCR engine and reporting tool, with the C0292 approach per fund.
Where Look-Through Risk Analysis fits in a Solvency II stack, and where it stops
Look-Through Risk Analysis sits between the managers' reports and the insurer's capital and reporting systems. It is not an SCR engine and does not file QRTs; it produces the look-through those systems need, with the evidence behind every line.
Who does what for a fund look-through under Solvency II
Your capital and reporting tools: Work from classified holdings files, one per fund.
Look-Through Risk Analysis: Reads reports, capital account statements, holdings and Tripartite Template files in any language, every line cited to its page.
Your capital and reporting tools: Applies CIC and sub-module rules to classified lines.
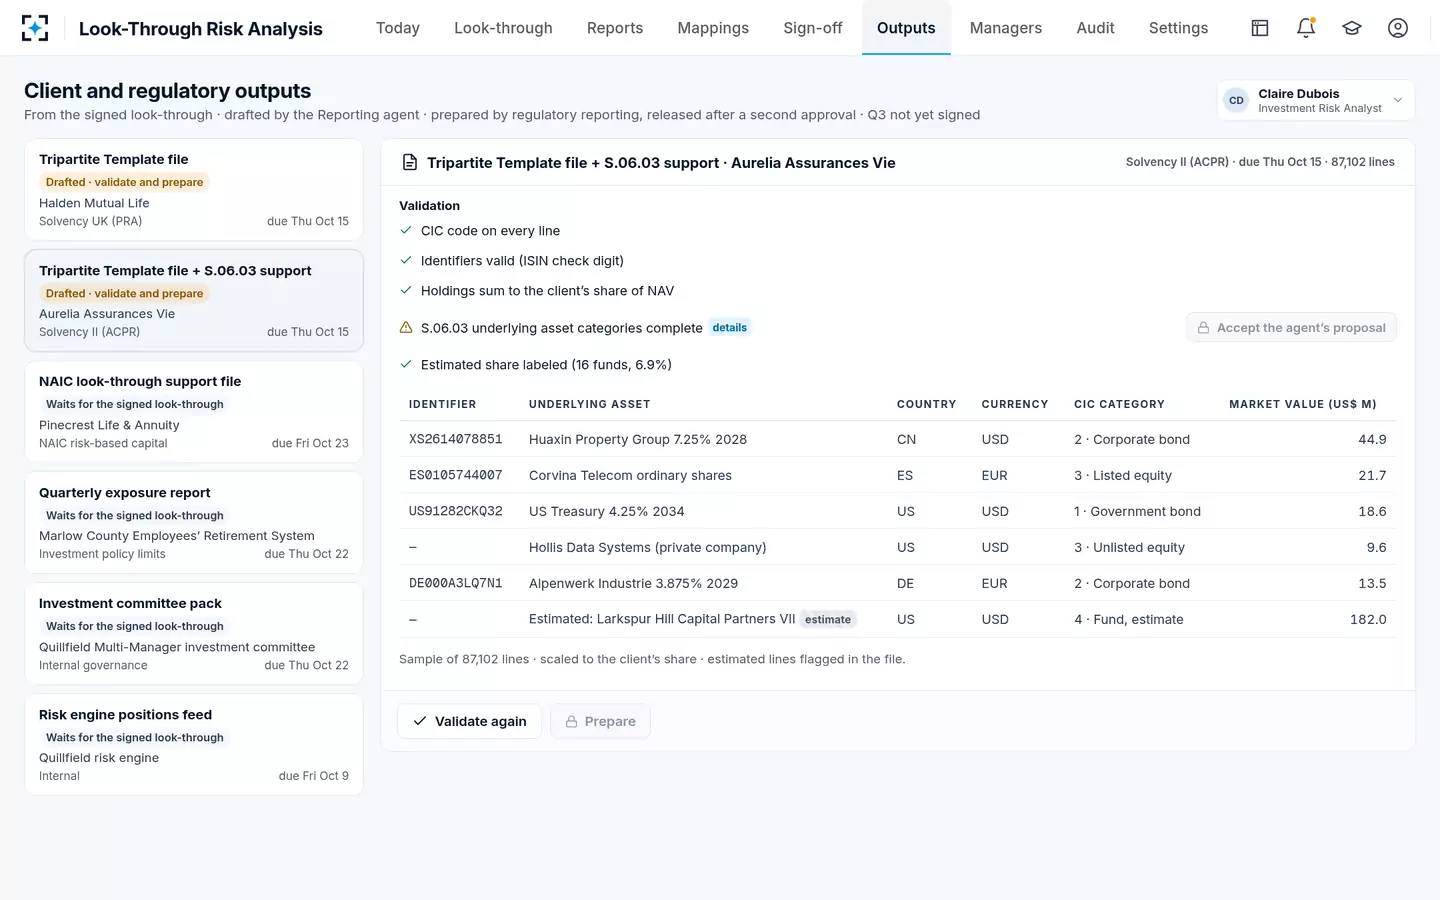
Look-Through Risk Analysis: Maps each line to identifier, issuer, sector, country of risk and currency; drafts CIC codes and S.06.03 support.
Your capital and reporting tools: Reports what it is given.
Look-Through Risk Analysis: Ties each fund to the manager’s NAV; estimates and labels funds not yet reported.
Your capital and reporting tools: Calculates the SCR, with correlations, from the positions.
Look-Through Risk Analysis: Supplies the signed positions; does not calculate the SCR.
Your capital and reporting tools: Builds and submits the QRTs.
Look-Through Risk Analysis: Drafts client files; regulatory reporting prepares them and a second person releases them.
From one signed look-through to each insurer's Solvency II file in Look-Through Risk Analysis
The decision for a buyer is therefore not between this and a capital model; it is whether the funds that today fall to type 2 or to the fallback can be moved to full look-through at a cost below the capital they tie up. The worked example above gives a way to size that on your own book: list the funds charged as type 2 or with groupings in your last S.06.02, estimate the standalone gap for each from its known allocation, and set that against the cost of reading their reports every quarter.
Questions people ask
How much capital does look-through save under Solvency II?
It depends on what the fund holds. On an illustrative €100 million fund of €60 million investment-grade bonds and €40 million EEA-listed equities, the standalone stress falls from €56.7 million as a type 2 equity to €22.9 million fully looked through, using the 7.71% symmetric adjustment of 30 September 2026. Bond-heavy funds save the most.
What is the type 2 equity charge in Solvency II?
It is the standard-formula shock of 49% plus the symmetric adjustment, applied to equities not listed in the EEA or OECD, to commodities and other alternatives, and to funds the insurer cannot look through and does not treat under the Article 84(3) fallback.
What changes in Solvency II from 2027?
From 30 January 2027 the symmetric adjustment band widens from ±10% to ±13%, group investment vehicles come within the look-through, and a new Article 171d extends long-term equity treatment to certain lower-risk funds depending on whether they can be looked through. The 49% type 2 shock does not change.
What Solvency II tools do insurers need for fund look-through?
Three kinds: a way to obtain and read each fund's holdings, a way to classify them (CIC, categories, countries, currencies, ratings), and the capital and reporting tools that calculate the SCR and file the QRTs. The first two decide how much of the fund book qualifies for full look-through; the third turns the result into the SCR and the reports.
Can a fund be looked through using its target allocation instead of its holdings?
Yes, under Article 84(3), if the fund is managed strictly to that allocation, its exposures are not expected to change materially in the short term, and any data groupings are prudent and cover no more than 20% of the insurer's total assets. EIOPA expects the insurer to verify the allocation against the fund's actual holdings.