Look-through analysis is the quarterly work of reading every fund an investor holds down to its securities, so exposures to issuers, sectors, countries, currencies and leverage can be measured against the investor's own limits. In a large asset owner it is a team; in a small pension fund, insurer or multi-manager desk it is usually one investment risk analyst, who collects the manager reports, keys the holdings, maps them, ties each fund to its NAV, estimates the funds that have not reported and drafts the committee papers. The hard part is not any single step but the volume: tens of thousands of lines, in many layouts and languages, every quarter. Botminds' Look-Through Risk Analysis takes the mechanical steps, so the analyst's time goes to the few thousand lines and the handful of gaps that need a person.
The figures on this page come from a fictional sample firm as it runs through the solution: a $14.62 billion multi-asset portfolio invested through 38 external managers and 120 funds, with one analyst preparing the quarter, the Head of Investment Risk reviewing it and the Chief Investment Officer signing it.
One analyst, six jobs: the quarter today and with Look-Through Risk Analysis
Today
Chases 120 funds across portals, the risk mailbox, administrators and SFTP; logs which have arrived.
With agents
Sees which reports are in and which are overdue; reminders are drafted for manager research to approve.
Still theirs: calling the manager who is always late
Today
Types holdings from PDFs into a spreadsheet, in the manager’s layout and language.
With agents
Reviews what the Reader agent extracted, each line cited to its page, original beside English.
Still theirs: the value the agent marks unreadable
Today
Matches each line to the security master; sets sector, country and currency by hand.
With agents
Works only the lines below the confidence or above the size the agent may approve alone.
Still theirs: country of risk and sector disputes
Today
Sums each fund’s holdings and compares them with the manager’s NAV; investigates the misses.
With agents
Receives each gap over tolerance with the Checker’s explanation from the report.
Still theirs: whether a gap is explained
Today
Rolls forward last quarter’s holdings for funds that have not reported, often silently.
With agents
Reviews labelled estimates built from the last report, calls, distributions and market proxies.
Still theirs: whether an estimate is good enough to sign
Today
Builds the committee papers and client files from the spreadsheet at the end.
With agents
Checks drafts built from the signed look-through; a second person releases client files.
Still theirs: what the committee reads
What is look-through analysis, and why does it land on one analyst?
Look-through analysis turns a list of funds into a list of exposures, and in smaller institutions it lands on one person because it sits between functions. It needs investment knowledge to map holdings, operations skills to chase reports and reconcile, and risk judgment to decide what an exposure means. Manager research owns the relationships, regulatory reporting owns the client files, and the CIO owns the decision; the look-through in the middle often has one owner.
The investors who need it are exactly the ones who invest through managers. The EU's own figures show how concentrated alternative funds are among professional investors: "The Union market for AIFs reached EUR 6,8 trillion in net asset value at the end of 2022", and professional investors account for "approximately 86 %" of that value (Directive (EU) 2024/927, recital 3). Every pension fund or insurer in that 86% that holds more than a few funds faces the same quarterly job.
How long does a quarterly look-through take?
On the sample firm's last manual quarter, the look-through was signed on business day 23 after quarter end. The solution's estimate of where those days went, and its target for the same portfolio once the agents take the reading, keying and first-pass mapping, is below; the target is business day 7.
Where a quarter-end look-through's business days go, by hand and with Look-Through Risk Analysis
- Collect and chase4 days
- Key, map, tie out, estimate16 days: keying alone is 7
- Papers, review, sign3 days
- Collect2
- Key, map, tie out, estimate2.5
- Papers, sign2.5
Two things stand out. Keying is the largest single block by hand and the one that nearly disappears, because reading reports is what the agents do best. And the last block barely moves: review and signature are people's work, and they should take as long as they take. The useful saving is not the total but where it lands, in the days the analyst used to spend typing, now available for the decisions.
One quarter in the sample: the volume behind one analyst's look-through
89,612
holdings lines read from 104 manager reports
12
languages the reports arrived in
2,148
lines the Mapper sent to a person, 2.4% of the total
16
funds not yet reported on business day 6, held at labelled estimates
Why the quarter cannot be copied from the last one
The most tempting shortcut for a one-person team is to roll last quarter's look-through forward for funds whose managers are slow, and the regulators who read look-through data are clear about why that misleads. EIOPA, explaining in March 2026 why it would not cut the Solvency II look-through template beyond two quarters a year, noted that "even when insurers are not actively trading investment funds, the underlying asset composition and market values continue to change" (EIOPA final report on supervisory reporting, March 2026).
The defensible version of the shortcut is an estimate that says it is one. In the sample portfolio, 16 funds holding 6.9% of NAV had not reported by business day 6; each is rolled forward from its last report, with capital calls and distributions since, under a written method approved by the Head of Investment Risk, and labelled as an estimate on every screen and file until the report replaces it. Last quarter those estimates were within 3.4% of the reported values on average, which is the kind of figure a committee can weigh; a silent copy offers nothing to weigh.
What is a tie-out gap, and which ones deserve the analyst's time?
A tie-out gap is the difference between the sum of a fund's holdings, as read from the manager's report, and the NAV the manager reports for the investor's share. Small gaps are normal, because reports list investments and leave out receivables, payables and accruals; large ones mean something was read wrongly, left out, or valued differently.
Every fund tied to the manager's own NAV, and only two gaps over 2% left for a person
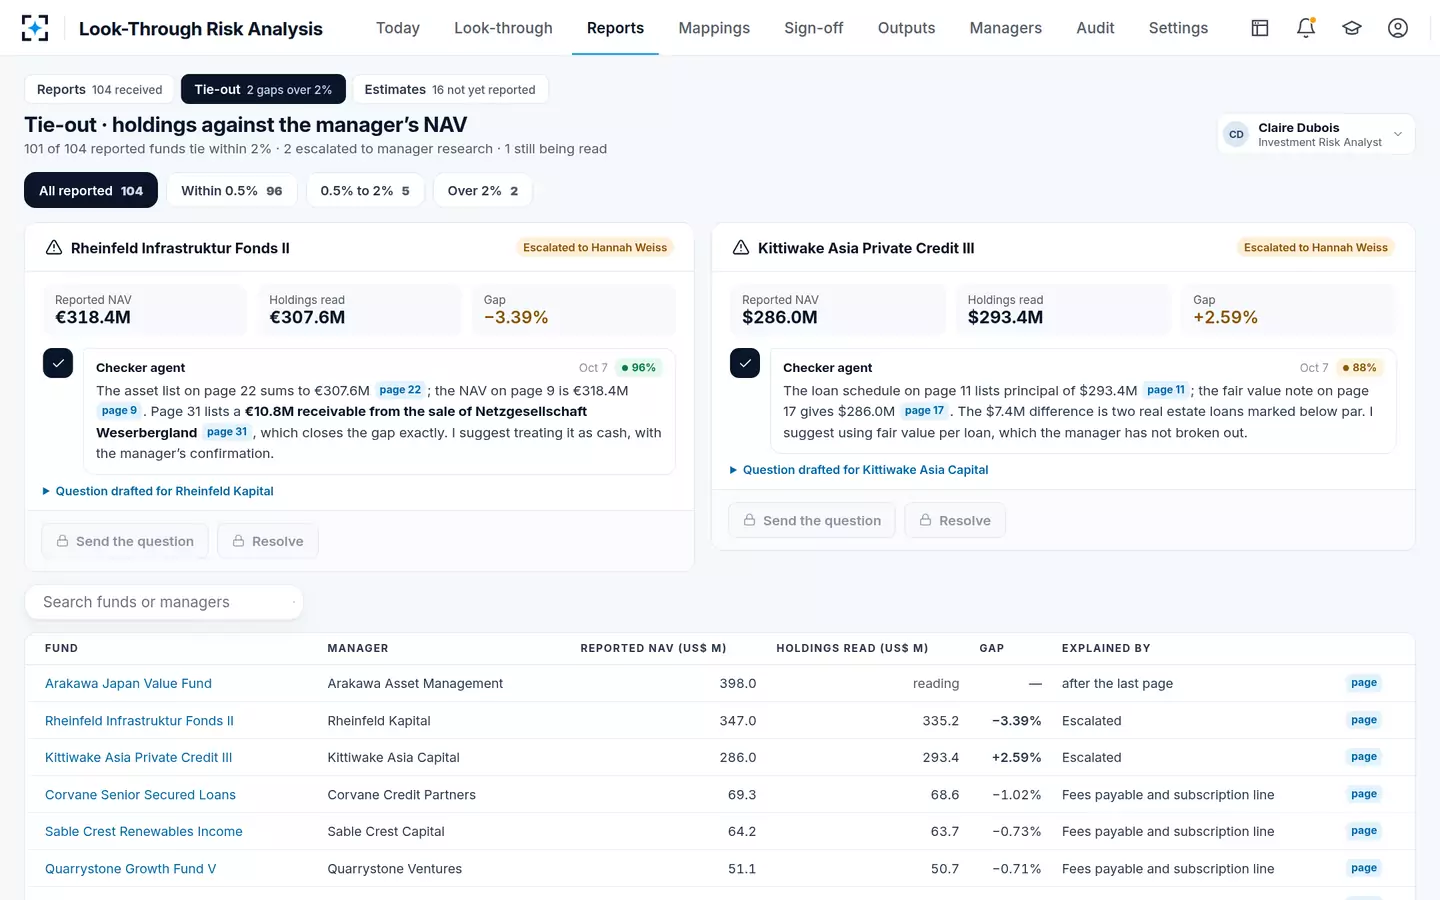
In the sample quarter, 96 funds tie within 0.5%, five between 0.5% and 2%, and two exceed the 2% tolerance. An infrastructure fund reads €307.6 million of holdings against a NAV of €318.4 million, −3.39%, and a €10.8 million sale receivable on page 31 closes the gap exactly. An Asian private credit fund is +2.59%, because two real estate loans are listed at par where the NAV uses fair value. Those two are the only tie-outs that needed the analyst. The rest of the method, including what tolerance to set, is in testing look-through reporting by replaying a quarter.
How many funds can one analyst look through?
No regulator or independent study publishes a ratio of funds per analyst, and the honest answer is that funds are the wrong unit. A liquid bond fund that sends a structured holdings file costs minutes; a private credit fund that reports a scanned PDF in another language costs hours, and a fund of funds costs one pass per layer. Count lines and report types instead, and measure your own rate for each.
A practical way to size the seat: take last quarter's reports, sort them into structured files, clean PDFs, scanned or foreign-language PDFs and capital account statements, count the lines in each, and time a sample of each type through keying, mapping and tie-out. In the sample firm the average report carried about 860 lines (89,612 across 104 reports), and the lines that needed judgment were 2.4% of the total. Those two numbers, measured on your own reports, decide the seat more than the fund count does.
The three decisions that stay with the analyst
Whatever is automated, three judgments should stay with the analyst, because each changes what the committee sees and each needs someone accountable. The solution is built so that the agents prepare each one with evidence and a person decides.
The first is a mapping dispute: a line whose country of risk differs from the domicile printed beside it, a private company with no public identifier, a sector the manager and the data vendor disagree on. In the sample, the Mapper approves alone only at 95% confidence or more and $25 million or less a line; the rest wait for the analyst with the report page and the evidence, as the agent that maps every line describes. The second is a tie-out gap over tolerance: the agent explains, the analyst and manager research confirm. The third is an estimate: whether a roll-forward is good enough to sign, or whether the committee should see the fund as unknown.
A fourth decision does not belong to the analyst at all. When a looked-through exposure breaches a limit, the Head of Investment Risk decides what to do, with a reason code and a note; the analyst's job ends at a correct, evidenced exposure.
What changes in the analyst's day when agents do the keying?
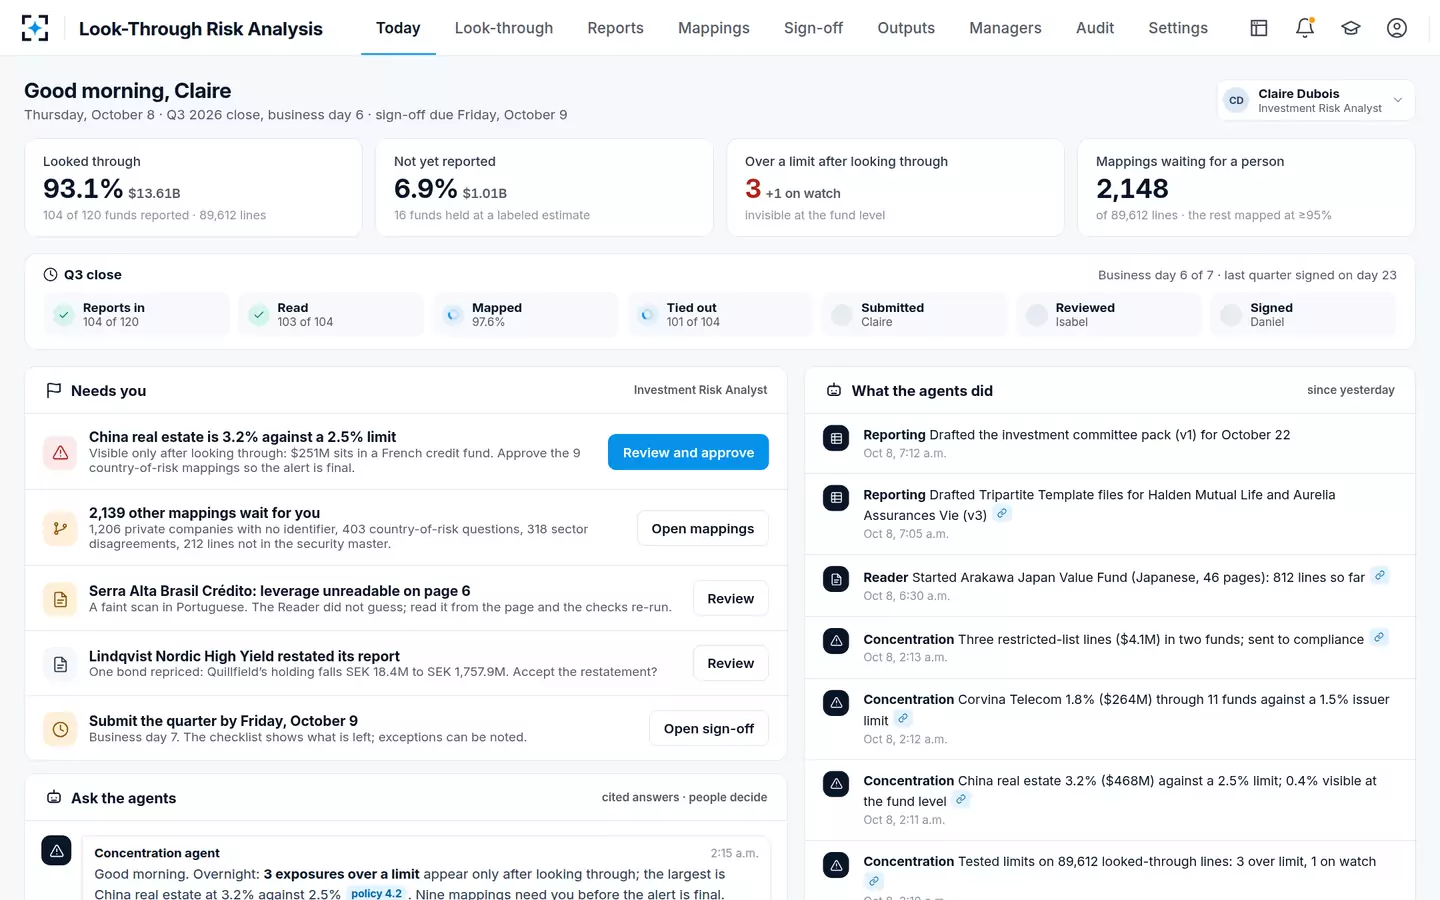
The day starts from the decisions instead of the backlog. On the sample firm's business day 6, the analyst's first screen already showed 93.1% of the portfolio looked through, $13.61 billion from 104 of 120 funds, three exposures over a limit that are invisible at fund level, and 2,148 mappings waiting for a person, with the China real estate breach at the top of the list.
The overnight log reads like a junior colleague's handover: client files drafted for two insurers, a 46-page Japanese equity report being read (812 lines so far), three restricted-list lines worth $4.1 million found in two funds and sent to compliance, and a single telecom issuer found at 1.8% through eleven funds against a 1.5% limit. None of it is final; each item waits for the person whose decision it is. What the analyst no longer does is type.
The analyst's morning: what the agents did overnight, and what needs a person
A look-through analysis checklist for a one-person team
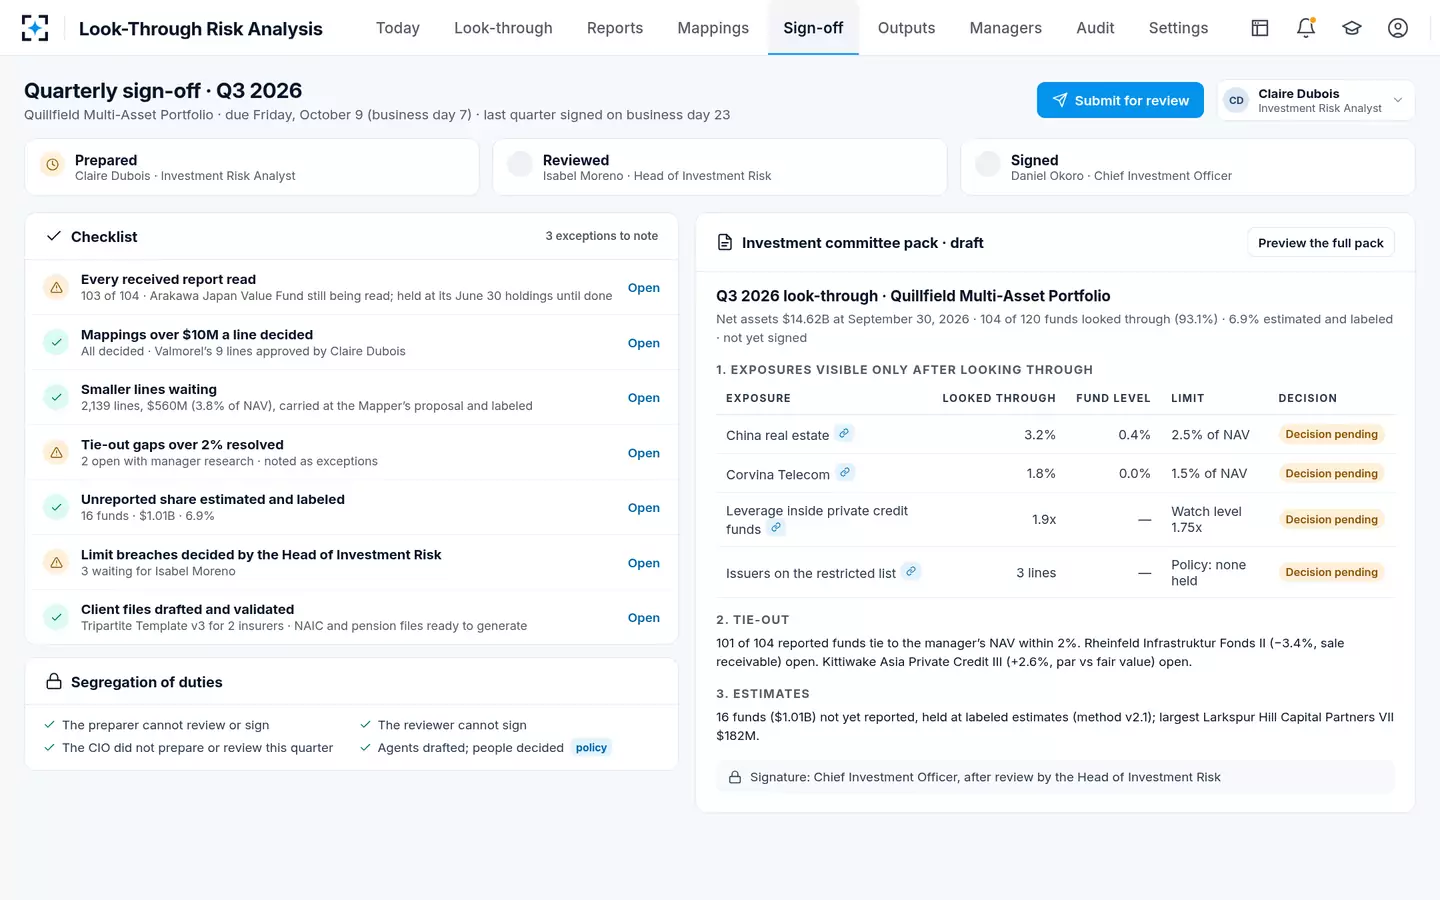
A checklist protects a one-person process from its biggest risk, which is that nobody else knows what was skipped. The one below is the sample firm's sign-off checklist, with the regulatory reason behind each item for an insurer.
Before the quarter's look-through is submitted for review
- Every received report read
Any report still being read is held at its last holdings until done, and noted.
- Every large mapping decided by a person
In the sample, every line over $10 million; smaller lines carried at the agent’s proposal and labelled.
- Tie-out gaps over tolerance resolved or noted
Open gaps go to the committee as exceptions with the manager’s question attached.
- The unreported share estimated and labelled
With the method, the last report date and the expected date for each fund.
- Funds of funds looked through to the last material layer
EIOPA asks for "a sufficient number of iterations" to capture all material risk.
- Breaches decided by the Head of Investment Risk
The analyst prepares; the reviewer decides; the CIO signs. No one does two of the three.
For an insurer client the list has a regulatory tail as well. The look-through template S.06.03 must cover all of the value invested in funds, with countries and currencies identified for 90% of fund value, worked from the largest fund down (Implementing Regulation (EU) 2023/894). The client files built from the signed quarter are described in the Tripartite Template field map.
Prepared, reviewed, signed: three people, and a checklist that shows what is left
Questions people ask
What is look-through analysis?
Look-through analysis measures an investor's real exposure by replacing each fund it holds with the fund's holdings, scaled to the investor's share. It lets issuer, sector, country, currency and leverage limits be tested on what the investor actually owns. Solvency II requires insurers to calculate capital this way under Article 84 of Delegated Regulation 2015/35.
What does a look-through analyst do?
In a small team, one investment risk analyst usually collects manager reports, extracts the holdings, maps each line to issuer, sector, country of risk and currency, ties each fund to the manager's NAV, estimates funds that have not reported and drafts the committee papers. With agents doing the extraction and first-pass mapping, the role becomes reviewing the exceptions and deciding the disputed lines.
How long does a quarterly look-through take?
No regulator or independent study publishes a standard. In the fictional sample firm, the manual look-through of 120 funds was signed on business day 23, and the solution's design target for the same portfolio is business day 7. Your own figure depends on report formats, languages and how many funds report late.
What is an acceptable tie-out gap?
It is a policy choice, set in advance and applied to every fund. The sample firm escalates any gap over 2% of NAV to manager research with an explanation from the report; 101 of its 104 reported funds tied within that tolerance, 96 of them within 0.5%.
Should funds that have not reported be left out of the look-through?
No; leaving them out understates exposure and makes the total look complete when it is not. The usual answer is a labelled estimate, rolled forward from the last report with calls and distributions since, replaced when the report arrives and with the variance logged.