How accurate is K-1 extraction by hand? No regulator, standards body or independent study publishes an error rate for keying Schedule K-1s, so no one can tell you. Research on manual data entry elsewhere gives a range: in a 2025 meta-analysis of clinical research, single entry from forms erred on about 0.29% of fields, while abstracting values from records that had to be read and interpreted erred on about 6.57%. K-1 extraction sits between the two, closer to the second whenever a value lives in a footnote rather than a box. For an investor that receives thousands of K-1s a season, that range is the difference between dozens and thousands of wrong values. The practical answer is to measure your own rate on last season's K-1s, then hold any tool to the same test. Botminds' K-1 Aggregation is built to be tested that way: every value it extracts is cited to its page, so each one can be checked against the original.
The research figures on this page come from peer-reviewed studies and a federal framework, linked where they appear; none of them measured K-1s. Product examples are fictional sample data in the solution.
What decades of data-entry studies found, in one meta-analysis
6.57%
pooled error rate for medical record abstraction, where values are read and interpreted
0.29%
pooled error rate for single data entry from forms
0.14%
pooled error rate for double data entry, keyed twice and compared
K-1 extraction, and why no one publishes its error rate
K-1 extraction is turning each Schedule K-1, its statements and any K-3 into the values an investor's tax software needs: every box, every code and amount, Items J, K and L, state lines and international detail. Investor tax teams have always done it, mostly by hand into spreadsheets and then the tax software. The work is invisible in the sense that matters for measurement: errors are found one at a time, in review or after filing, and almost never counted.
There is no public benchmark because there is no common test set. Each investor's K-1s come from different GPs, in different layouts, with different statements, and the IRS's consistency rule means the errors that matter surface as notices rather than statistics. A tax team that wants a number has to build it. That is less work than it sounds, and the method is below.
How accurate is K-1 data entry? What studies of hand-keying found
The best evidence on manual data entry comes from clinical research, which has measured its own error rates for forty years. The meta-analysis behind the figures above pooled 93 papers and found error rates "ranging from 2 errors per 10,000 fields to 2,784 errors per 10,000 fields," with the method of capture explaining much of the spread (Garza and others, 2025).
The more a value must be interpreted, the more often it is wrong
A controlled experiment points the same way and adds a warning about review. Barchard and Pace randomly assigned 195 participants to enter 30 data sheets by double entry, visual checking or single entry, and found that reading entries back by eye left about thirty times as many errors as keying everything twice, and did no significantly better than a single unchecked entry (Computers in Human Behavior 27(5), 2011). Reading a keyed value back against the original, which is how most K-1 reviews work, caught too few errors to beat no check at all.
Why reading a K-1 is closer to abstraction than to typing
A K-1 box is a form field; a K-1 footnote is a document to be interpreted. Keying Box 5 interest from a clean PDF resembles single data entry. Deciding which code a statement line belongs to, which line a UBTI percentage applies to, or whether a distribution footnote changes the year, resembles abstraction, where the meta-analysis found error rates more than twenty times higher.
Fund K-1s are weighted toward the second kind. The sample K-1 from Harlow Growth Partners III, a fictional fund, carried 15 boxes, Items J, K and L, five state lines, K-3 Parts II and III and eight footnotes, including UBTI, a Section 199A statement and California withholding. The boxes are typing; the footnotes are judgment. An error-rate measure that does not separate them will understate the risk exactly where it is highest. The K-1 footnotes guide sets out what each kind of footnote carries and who uses it.
What K-1 errors are most common? Where the form makes them likely
Without published counts, the useful question is where the structure of the form invites error. Read the form closely and five places stand out, each with a check that catches it.
Where K-1 errors hide, and the check that finds each
| Error | Why the form invites it | The check |
|---|---|---|
| Right values, wrong holding or investor | Hundreds of similar fund names; a fund may issue several K-1s to related entities. | Match partnership EIN and partner identifying number to the holding before keying. |
| Sign and character | Losses print in parentheses; a box can flip from income to loss between estimate and final. | Compare every box with the estimate and last year; flag sign changes. |
| Code mapped to the wrong line | Boxes 11 to 20 hold lettered codes, and codes are added or changed between years. | Map against the current year’s code table; flag codes new for that fund. |
| Statement-only items missed | Box 20 Z and often 20 V say only "STMT"; state detail is not on the federal form at all. | Count statements and footnotes; every one must map somewhere or be marked as not applicable. |
| Estimate treated as final | Draft K-1s can look identical to finals. | Label every document by type on arrival; block export of an unlabeled estimate. |
How to measure your own error rate on last season's K-1s
Measure it the way the clinical studies did: take a sample of K-1s, re-extract every field independently from the original, compare with what was keyed, and count disagreements per field, separately for boxes, codes and statement-derived values. Use last season's K-1s, because their correct values have since been settled by review, amendments and the filed return.
The sample size follows from the rate you expect. To estimate an error rate near 0.3% within plus or minus 0.1 percentage points with 95% confidence, you need about 11,500 fields: 1.96² × 0.003 × 0.997 ÷ 0.001², our arithmetic. At roughly 40 fields per fund K-1 that is about 290 K-1s. For statement-derived values, where the rate is likely higher, far fewer fields give the same precision, which is convenient because there are fewer of them.
Two rules keep the test honest. The person re-extracting must not see the keyed values first, or visual checking's weakness returns. And every disagreement is resolved against the original document, not by majority, so the measure reflects the K-1 rather than the team's habits. The result is a baseline: a number per field type that any change of process, or any tool, must beat.
How do you check K-1 data before import?
Checks that tie a K-1 to an independent source catch errors that reading back never will. Investment accounting knows the distributions and contributions, last year's K-1 knows the beginning capital, the estimate knows what was expected. A short list run on every K-1 before export is the cheapest control an investor tax team has.
Six checks to run before any K-1 reaches the tax software
- Identity
Partnership EIN, partner identifying number and investor entity match the holding.
- Distributions and contributions
Box 19 and Item L contributions tie to cash booked in investment accounting, within a set tolerance.
- Beginning capital
Item L beginning capital equals last year’s ending capital from the same fund.
- Estimate and prior year
Every box compared with the estimate and last year; sign changes and new codes flagged.
- Statements accounted for
Every footnote and STMT mapped to a code and line or marked not applicable, with the page cited.
- Totals
Federal totals in the export equal the sum of the K-1s, box by box, for each investor entity.
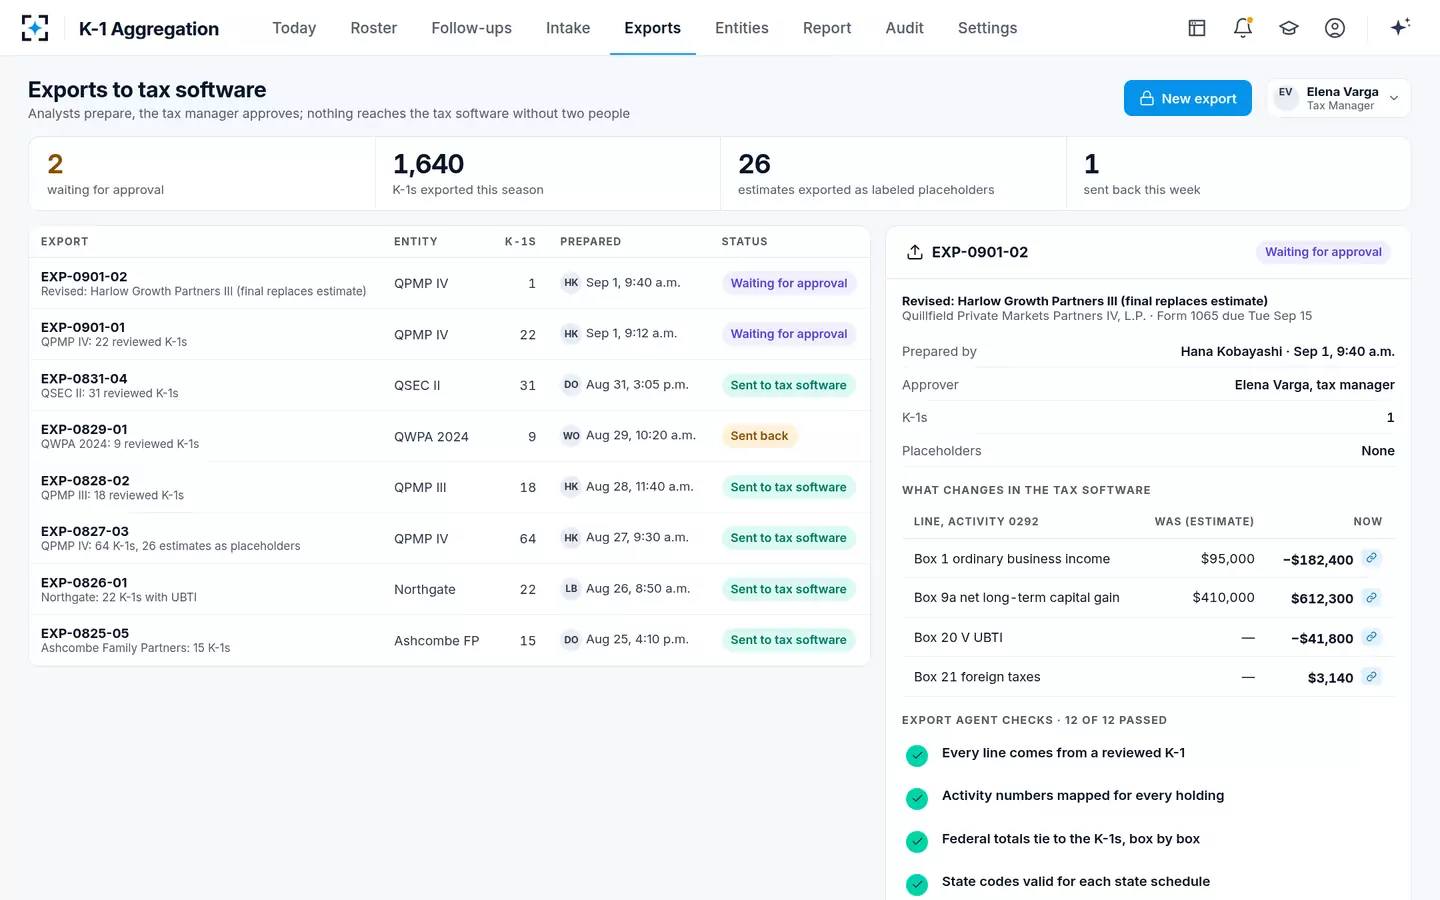
Twelve checks, and two people, before anything reaches the tax software
Can K-1s be scanned automatically? Hold the tool to the same test
Yes: K-1s can be read by software, and an investor should ask any tool, including ours, for the number the manual process cannot give, its error rate by field type on the investor's own K-1s. The US government's AI risk framework puts the logic plainly in its discussion of measurement.
"Risk management of AI systems that are intended to augment or replace human activity, for example decision making, requires some form of baseline metrics for comparison," NIST writes, adding that such baselines are hard to build because AI systems do different tasks from people, and do them differently (NIST AI 100-1, AI Risk Management Framework 1.0, January 2023). For K-1s the baseline is the one measured above, and the comparison is field by field on the same sample.
Keyed by hand, or extracted with citations: what each gives a reviewer
Keyed by hand into a spreadsheet: The reviewer re-finds it in the PDF.
Extracted, each value cited to its page: A link opens the passage on the read-only original.
Keyed by hand into a spreadsheet: Look the same as certain ones.
Extracted, each value cited to its page: Carry a confidence; below a set level they are highlighted or held for a person.
Keyed by hand into a spreadsheet: Made silently in the cell.
Extracted, each value cited to its page: Shown as a choice with both readings and the footnote text.
Keyed by hand into a spreadsheet: Needs a separate re-extraction exercise.
Extracted, each value cited to its page: Every value can be sampled and checked against its citation.
Keyed by hand into a spreadsheet: A footnote the GP wrote ambiguously.
Extracted, each value cited to its page: The same: an ambiguous footnote still needs a person or the GP.
What a wrong value costs downstream
An extraction error on a K-1 is an inconsistency with a return the IRS already holds, and the Code treats the resulting underpayment harshly. Under the consistency rule, "Any underpayment of tax by a partner by reason of failing to comply with the requirements of subsection (a) shall be assessed and collected in the same manner as if such underpayment were on account of a mathematical or clerical error appearing on the partner’s return" (26 U.S.C. 6222(b)). The IRS can assess it without the usual deficiency procedure.
For a fund of funds the cost multiplies. A wrong value on one underlying K-1 becomes wrong values on its own K-1s to every partner, and a K-1 furnished with incorrect information exposes the fund of funds to the per-K-1 penalties covered in the failure-to-furnish penalty guide. The IRS also reminds partners that the loss and deduction they may claim "may be less than the amount reported on Schedule K-1" (Partner's Instructions for Schedule K-1, 2025), so the extracted value is the start of the investor's work, not its end.
Where K-1 Aggregation fits in an extraction test, and where it does not
K-1 Aggregation's Extraction agent reads every box, code, Item J, K and L entry, K-3 part and state schedule and cites each value to its page; values below the investor's confidence setting, 95% in the sample, are highlighted for the analyst, and it never fills a blank. The Footnote agent maps statements to tax codes and waits for a person below its own setting, 90% in the sample. On the sample Harlow K-1, extraction took 11 seconds at 99% confidence; the design target is every box and footnote cited to its page, every swing reviewed before export.
What it does not do is make your baseline unnecessary. The right way to evaluate it, or any K-1 extraction tool, is the measurement above: last season's K-1s, re-extracted blind, compared field by field with what was filed. A pilot on last season's K-1s turns that into a pass-or-fail test with dates, and the K-1 Aggregation page shows the full workflow.
Questions people ask
How do you extract data from a K-1?
Read and record every Part III box and code with its amount, Items J, K and L, every supplemental statement and footnote, state schedules and any K-3 parts, then map each to the line of the investor's return or tax software where it belongs. Tie the result to investment accounting and last year's K-1 before import.
What is a K1 extractor?
Software that reads Schedule K-1s, usually from PDFs, and returns their values as data for spreadsheets or tax software. Ask any such tool how it handles codes, statements and K-3s, how it shows uncertain values, and what its error rate is by field type on a sample of your own K-1s.
How to test K-1 extraction accuracy?
Re-extract a sample of last season's K-1s blind, compare field by field with the values filed, and count disagreements separately for boxes, codes and statement-derived values. Near a 0.3% error rate, about 11,500 fields, roughly 290 fund K-1s, give a precision of plus or minus 0.1 percentage points.
Is double-keying K-1s worth it?
In clinical data, double entry halved the pooled error rate of single entry, 0.14% against 0.29%, while in a controlled experiment visual checking was not significantly better than single entry with no check at all. For K-1 boxes a comparison against an independent source often does the same job as double-keying at lower cost.
Can AI read K-1 footnotes?
Software can read footnote text and propose a mapping, and that is where it should be least confident and most transparent. A footnote that gives a percentage of an unnamed base, for example, needs a person or the GP; a tool should show both readings and its confidence rather than choose silently.