Investigator-initiated studies fail to recruit mainly because the enrolment rate in the concept is a hope, not a history. A medical affairs committee that funds an investigator-initiated study (IIS, or externally sponsored research, ESR) is betting that one hospital can find, screen and enrol a stated number of patients in a stated time. The concept form says so; nothing on it proves so. Yet the evidence is usually already in the company's hands: how fast that same site enrolled in its last comparable studies. Botminds' Investigator-Initiated Study Review uses that history to project months to full enrolment, tests fixes before the vote, and works out how much study drug the plan needs, so the committee's feasibility judgement rests on arithmetic rather than on the investigator's optimism. Once the study is funded and the contract signed, Investigator-Initiated Study Management checks every quarterly report against that same enrollment plan.
The stakes are concrete. An under-recruiting study ties up a grant, a drug allocation and a reviewer's credibility for years, and when it is finally stopped it is less likely to be published at all. This page sets out the evidence, the arithmetic every feasibility reviewer can use, and how the forecast changes what a committee decides.
Investigator-sponsored trials stop for poor recruitment three times as often
26.5%
of investigator-sponsored trials were discontinued for poor recruitment
8.4%
of industry-sponsored trials were discontinued for the same reason
55.1%
of discontinued trials stayed unpublished, against 33.6% of completed ones
Why investigator-initiated trials fail to recruit more often than company trials
Because the people who promise the enrolment are also the people who run the study, with less infrastructure to correct course. Under ICH E6(R3) the investigator of an investigator-initiated trial is a sponsor-investigator, carrying "the obligations of a sponsor and those of an investigator". There is rarely a feasibility department behind them testing the plan, and no portfolio of other sites to absorb a shortfall.
The largest cohort study on stopped trials puts a number on the gap. Of 1,017 randomised trials approved by ethics committees in three countries, a quarter were discontinued, and poor recruitment was the most common reason. Sponsorship made a large difference: 26.5% of investigator-sponsored trials stopped for poor recruitment, against 8.4% of industry-sponsored ones (odds ratio 0.25). These are investigator-sponsored trials in general, not only company-supported ones, but a company-supported IIS has the same structure: the investigator's institution is the sponsor.
The review process itself adds pressure toward optimism. In a decade of thoracic oncology concepts from a 13-institution consortium, sponsors approved only 25% of those submitted to them, and concepts with shorter projected durations were more likely to be approved (P = 0.05). Investigators learn that a short timeline wins. The committee's job is to know which short timelines are real.
How to calculate clinical trial recruitment rate: months = patients ÷ enrolled per month
Time to full enrolment is the target sample divided by the number of patients the site actually enrols each month, and that number is what survives screening, not what is screened. Every feasibility review comes down to three inputs: the sample size, the site's screening rate, and its screen failure rate. A concept usually states the first, implies the second, and leaves out the third.
Take a sample concept as it runs through the solution. VELOCITY-CD, from a fictional hospital in Budapest, proposes a single-arm study of a biologic in 60 adults with Crohn's disease after anti-TNF failure, and asks for 18 months to enrol. Working the plan backwards shows what that promise requires; working the site's own record forwards shows what it will deliver.
The same 60 patients, at the promised rate and at the site's real one
Three things follow from the drawing. The promise needs three times the site's demonstrated rate. Screen failure is where most hidden optimism lives: a site that "sees 5 eligible patients a month" may be describing referrals, and at 35% screen failure it enrols barely two-thirds of the people it screens. And the gap is not a rounding error. At 1.1 a month, 18 months produces about 20 patients, a third of the sample.
How uncertain is an enrolment forecast? Give a range, not a date
Even when the rate is right, the finishing month is a range, because patients arrive by chance and not on a schedule. A widely used statistical treatment, the Poisson–gamma model of Anisimov and Fedorov (Statistics in Medicine, 2007), treats each site's arrivals as random around its own rate and lets those rates differ between sites. It returns an interval for the time to full enrolment and is re-estimated as real recruitment data come in.
Applied to the sample concept, chance alone moves the date a long way. If the site really enrols 1.1 a month, 60 patients take about 55 months on average, but in nine runs out of ten anywhere from about 43 to 67. That is before any doubt about the rate itself, which here rests on two earlier studies. A committee that reads "55 months" as a date will be surprised in both directions; one that reads it as a band can compare scenarios honestly.
The same scenarios as ranges: what chance alone does to the finishing month
| Scenario | Enrolled a month | Expected months | Nine runs in ten |
|---|---|---|---|
| 60 patients, one site | 1.1 | ≈ 55 | 43 to 67 months |
| 60 patients, a second site added | ≈ 2.6 | ≈ 23 | 18 to 28 months |
| 40 patients, one site | 1.1 | ≈ 37 | 27 to 46 months |
| 40 patients and a second site | ≈ 2.7 | ≈ 15 | 11 to 19 months |
Two practical rules follow. Report the band beside the expected value, so the committee sees that even the combined scenario can run past 18 months. And re-estimate after the first three to six months of real enrolment: the model is built to update, and an early shortfall is the cheapest moment to add a site.
Where a site's real enrolment rate comes from: its own past studies
The best evidence of a site's future enrolment is what that site enrolled before, in a similar population, and a company that sponsors IIS work may already hold that record. A hospital that proposes an investigator study may well have been a site in one of the company's own trials, and those trials, its registries and its earlier funded studies record enrolment by site and month.
In the sample case the source is unusually direct. The proposing hospital was a site in the company's own phase 3b trial in the same disease, and in a registry study. Both show 1.1 patients enrolled a month, with 35% screen failure. The solution's feasibility check reads those histories, cites each, and projects the curve. Every number on the panel links to the passage it came from, so a reviewer can open the site's enrolment record rather than take the projection on trust.
Investigator-Initiated Study Review projects enrolment at the site's own rate
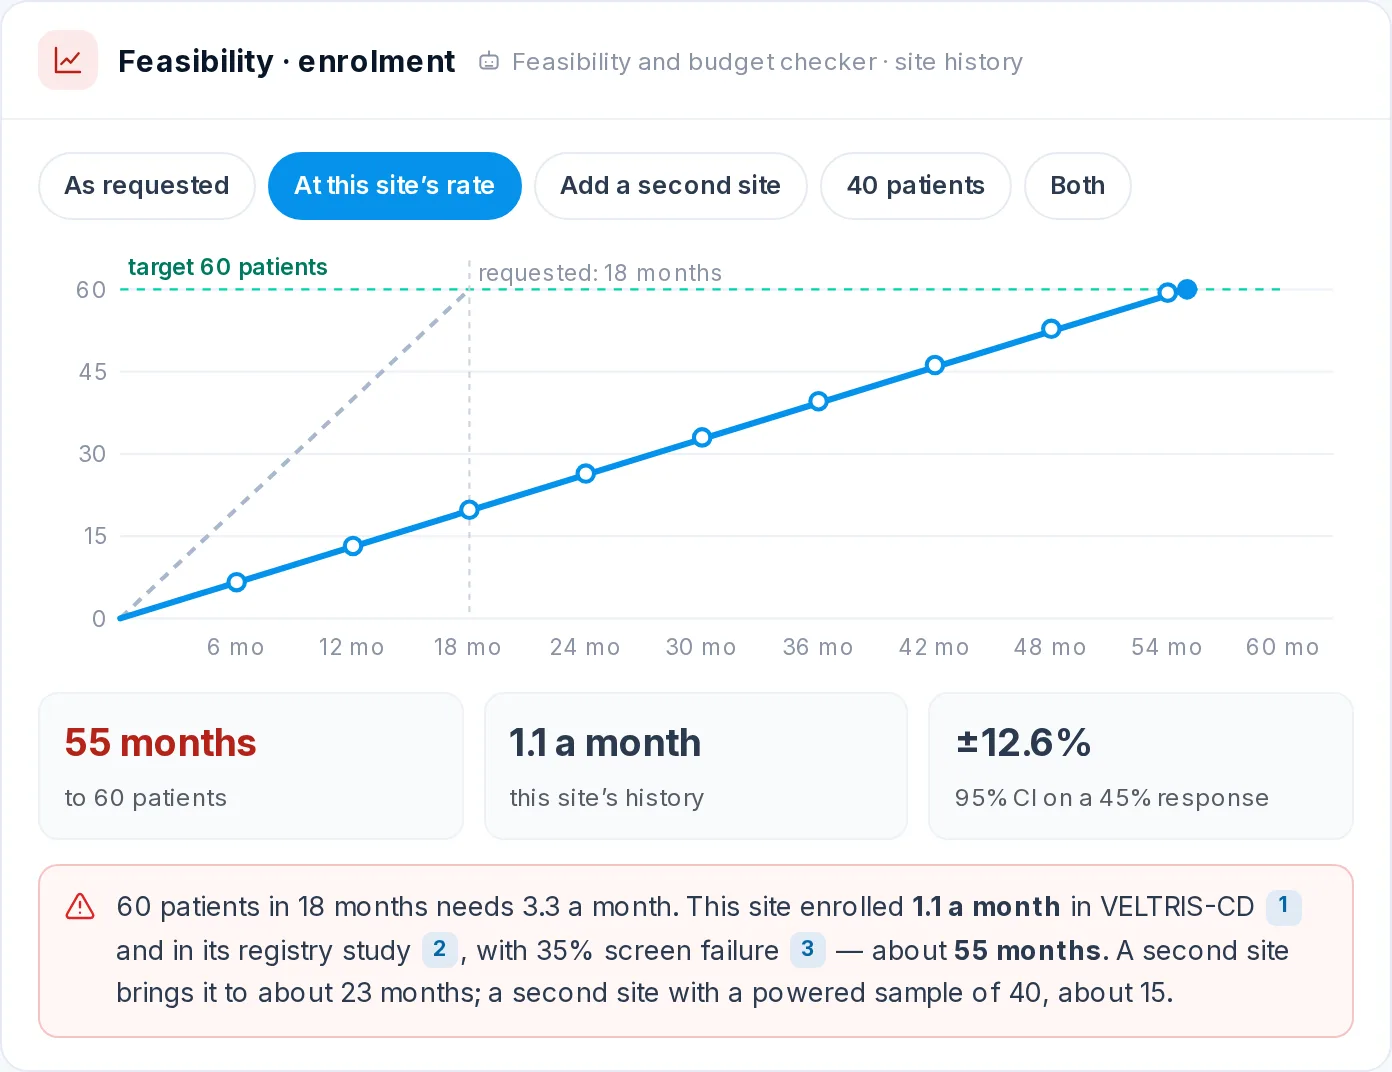
The projection says nothing about the investigator's good faith. It says the plan and the record disagree, and shows by how much.
Experienced committees already ask this question. A Medical Affairs Professional Society best-practice deck shows a committee assessment that weighs enrolment rate, institution experience and sub-sites among the criteria a committee assesses. What is usually missing is the step from asking to measuring: the reviewer reads the concept's claimed rate, has no time to pull the site's history, and records feasibility "as written".
Feasibility taken as written, and feasibility projected from site history
As written in the concept: The investigator's estimate, often of eligible patients seen rather than enrolled.
Projected from the site's past studies: Enrolled patients a month in the site's own comparable studies, each cited.
As written in the concept: Rarely stated; silently assumed to be zero.
Projected from the site's past studies: Taken from the same studies and applied to the plan.
As written in the concept: A sentence: "recruitment is feasible at our centre".
Projected from the site's past studies: Months to full enrolment, beside the months requested.
As written in the concept: Discovered after approval, as an amendment or a no-cost extension.
Projected from the site's past studies: Tested before the vote: a second site, a smaller sample, both.
As written in the concept: A comment in the reviewer's notes.
Projected from the site's past studies: A weighted, scored criterion on the scorecard.
Testing scenarios before the vote: a second site, a smaller sample, or both
A forecast earns its keep when it changes the question from "approve or decline" to "what would make this work". Once the site's rate is known, the fixes are arithmetic: add a site to raise the monthly rate, reduce the sample to lower the target, or do both, and see each one's months to full enrolment before anyone votes.
Months to full enrolment under each scenario, against an 18-month request
The scenarios also say which fix carries the weight. A second site alone gets within five months of the plan; a smaller sample alone does not, because 40 patients at 1.1 a month still takes about three years. That ordering is not obvious from the concept, and it is exactly what a reviewer needs to write a useful condition rather than a decline.
The combined scenario: a second site and 40 patients in 15 months
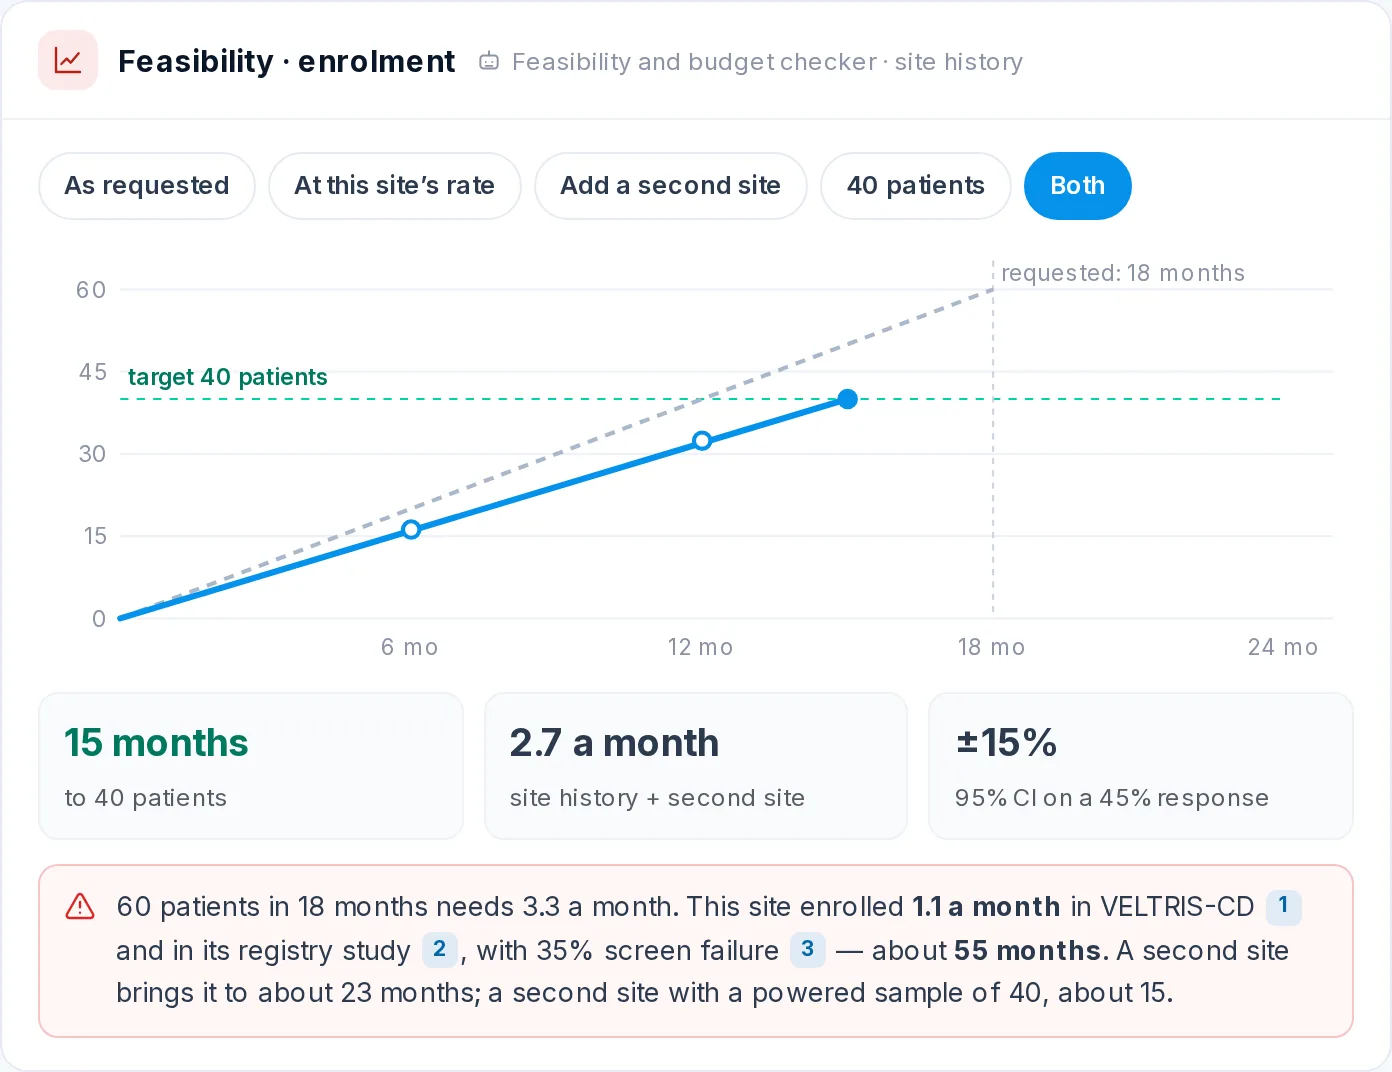
What a smaller sample costs: the precision behind "40 patients"
Cutting the sample buys time with precision, and the committee should see both sides of that trade before it accepts it. The sample concept is single-arm and estimates a response rate, so its sample size governs how tightly that rate is pinned down. On an expected 45% response, 60 patients give a 95% confidence interval of about ±12.6 percentage points; 40 patients give about ±15.
Whether ±15 points still answers the question is a scientific judgement, not a scheduling one, and it belongs to the reviewer and the committee's statistician. In the sample case it cannot be settled from the concept at all: the solution's reading of the form names the power calculation as missing. So the reviewer's condition is written as an either-or: add a second site, or justify 40 patients with a power calculation. That keeps the feasibility fix from quietly becoming a weaker study.
Drug supply: the enrolment forecast is also a supply forecast
The quantity of study drug follows directly from the number of patients and the treatment schedule, and its timing follows from the enrolment curve, so both can be known before the vote. Companies often provide product as well as, or instead of, money: the Medical Affairs Professional Society's working definition has the company provide "support in the form of study drug/device and/or funding". Yet the same talk places the supply forecast after the decision:
“Forecast as soon as the study is approved.”
Saberwal, Best Practices for Managing the Life-Cycle of an Investigator Initiated Trial (MAPS)
That advice is sound as far as it goes. The problem is that, by then, the committee has already committed product it never sized. In the sample case the feasibility and budget check works the quantity out from dose and duration while the concept is still under review: 60 patients treated for 52 weeks need 180 intravenous vials and 360 prefilled pens, three vials and six pens per patient. The drug supply lead confirmed clinical stock from the second quarter of 2027, and attends the committee as a non-voting member with "Stock available" recorded beside the votes.
Study drug quantity worked out before the vote
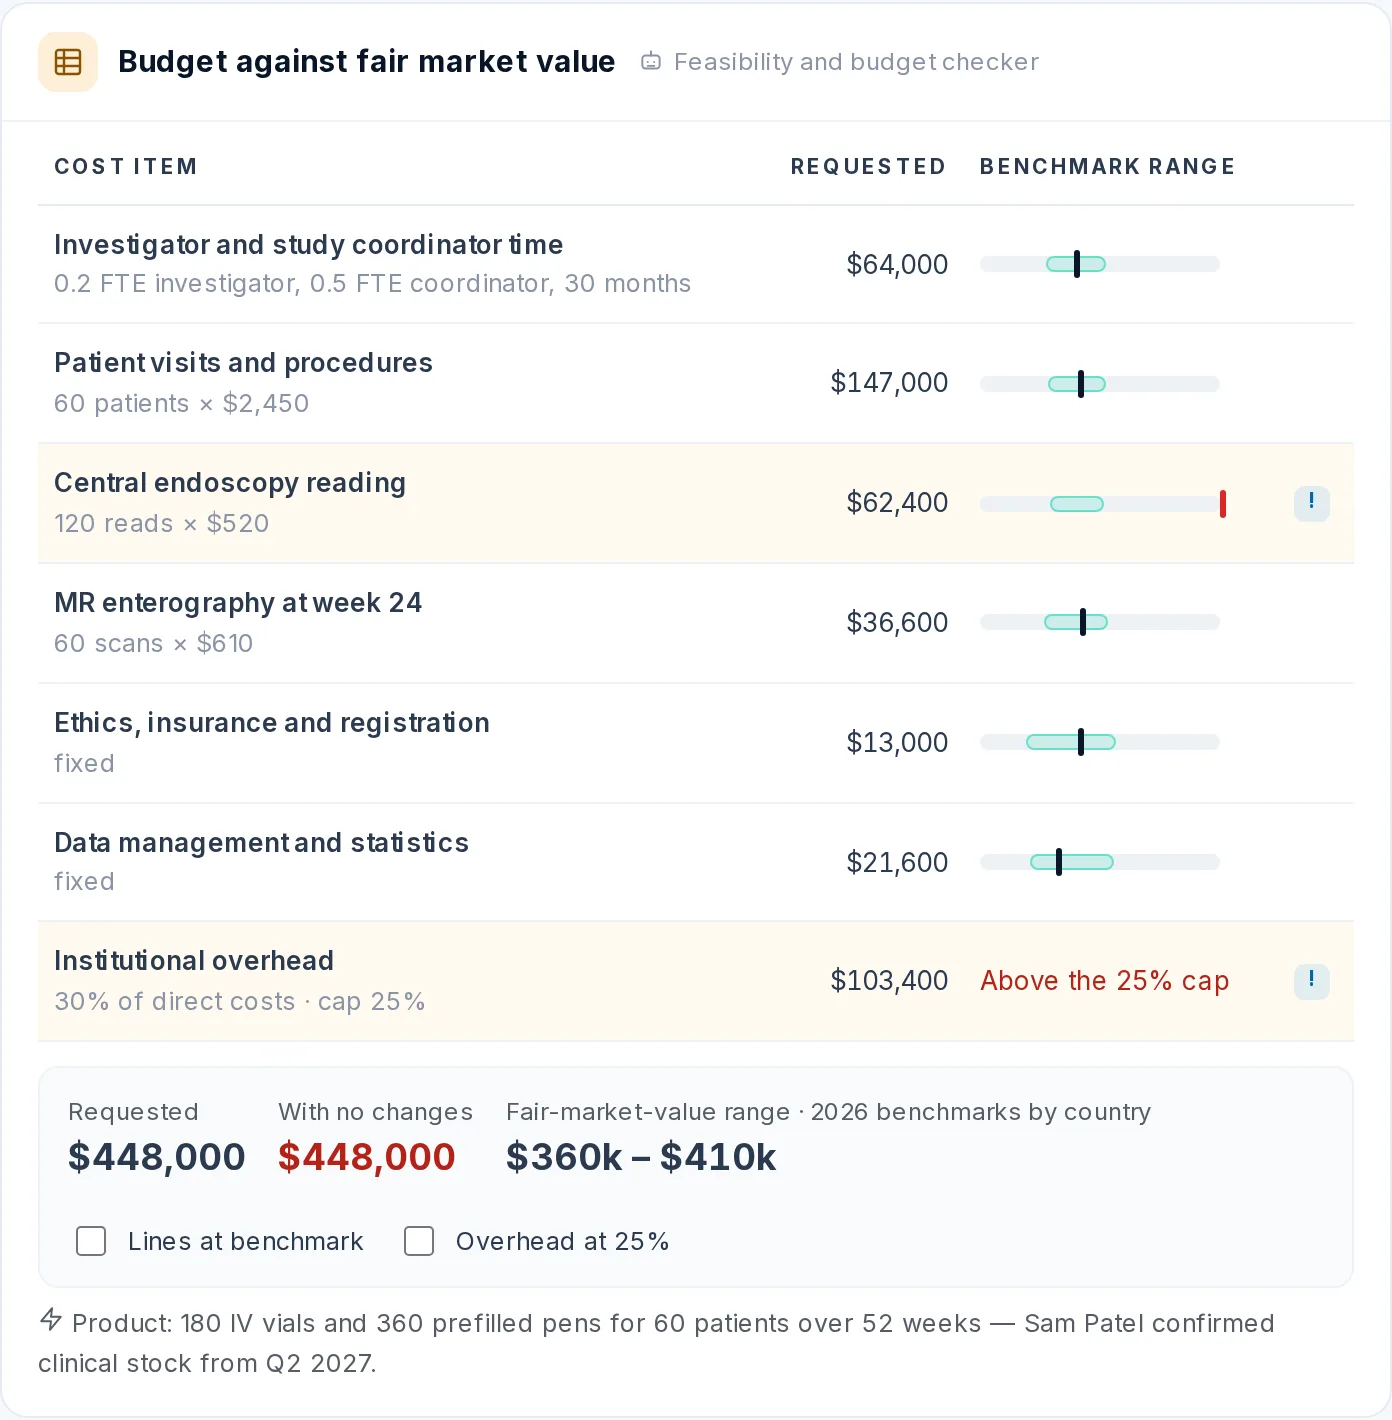
The enrolment forecast changes the supply picture as much as the quantity does. At the site's own rate, those 60 patients would start treatment over about four and a half years instead of eighteen months, so product would be drawn down in a long, thin stream, with the expiry and relabelling questions that brings. A smaller sample scales the order proportionally: at the same three vials and six pens per patient, 40 patients need 120 vials and 240 pens. The supply team can plan either version before the committee chooses between them, which is the point of the drug supply seat described on the page on who reviews investigator-initiated studies.
Feasibility as a scored criterion in Investigator-Initiated Study Review
In Investigator-Initiated Study Review, feasibility is one of four scored criteria, so a doubtful enrolment plan moves a concept down the ranking instead of sitting in a comment. The committee's default weights are 30% priority fit, 30% scientific quality, 20% feasibility and 20% overlap, the first three scored 1–5 and overlap 0–1, and the weights can be changed on the scorecard by the committee.
The sample concept scored 2.4 of 5 on feasibility. Its other scores were 4.4 for priority fit and 3.9 for design, and after the overlap check it totalled 62 out of 100. Working the same formula through shows what the weak enrolment plan cost: had feasibility scored 5, the concept would have totalled about 73. And the reason for the shortfall is cited back to the site's own enrolment record. How the four criteria combine, and how they rank a whole cycle, is the subject of the page on how a committee scores a concept.
The enrolment forecast travels to the committee as a flag
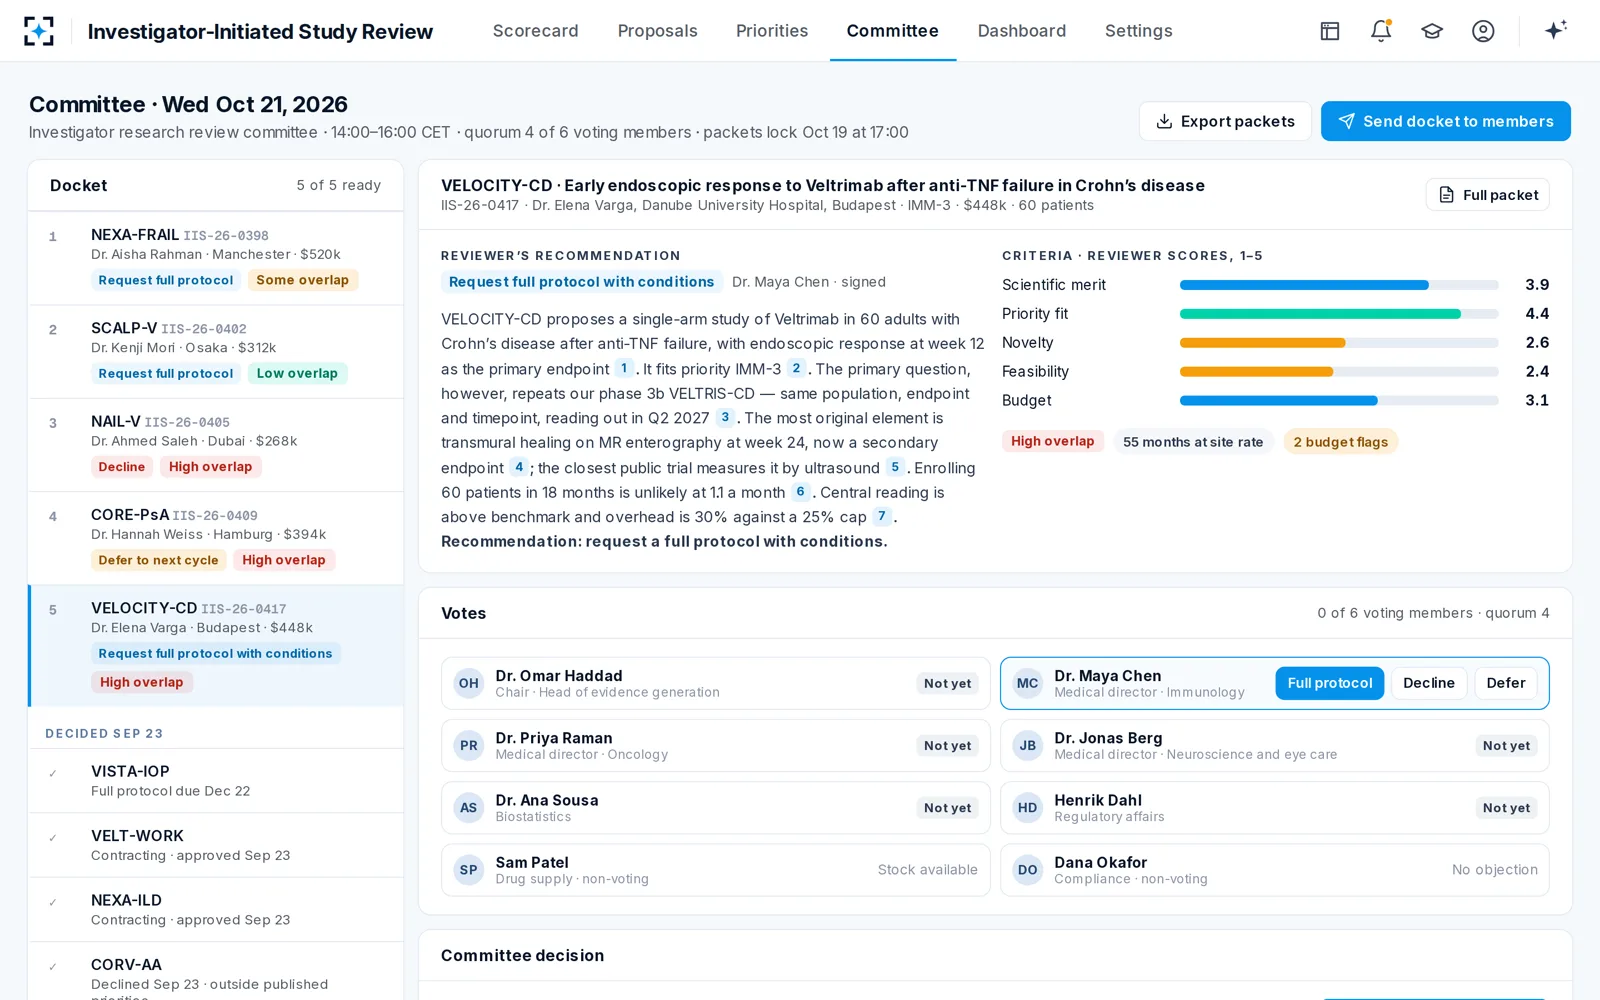
The forecast is a setting, not a hard-wired rule. "Enrolment from site history" is switched on by default; switched off, enrolment is taken as the concept states it. Either way the change is versioned in the audit trail, so a committee can show which basis it used in any cycle. And people still decide: the agents project and draft, the scientific reviewer writes the conditions and signs the recommendation, and the committee votes.
A feasibility review any committee can run
The method needs no software to understand, only discipline about where each number comes from. Software makes it cheap enough to run on every concept rather than the ones that already look doubtful.
Eight questions for the feasibility review of an investigator study
- What did this site enrol, per month, in its last comparable studies?
Use enrolled patients, from your own trials, registries and earlier funded studies, and cite the source.
- Is the stated rate screened, eligible or enrolled?
Referrals and eligible patients seen are not enrolment. Ask which one the concept means.
- What is the screen failure rate?
If the concept does not say, take it from the site's history; 35% failure turns 1.7 screened into 1.1 enrolled.
- How many months does the plan take at the site's real rate?
Divide the sample by the enrolled rate and put the answer beside the months requested.
- Which fix closes the gap?
Model a second site, a smaller sample and both; one usually carries most of the weight.
- What does a smaller sample cost in precision?
Ask for the power calculation, or the confidence interval at the reduced size, before accepting it.
- How much study drug, and when?
Quantity from dose and duration; timing from the enrolment curve, not from the plan.
- Will you compare the forecast with actual enrolment?
Milestone payments at 50% and 100% enrolment give you the data points for free.
The last question closes the loop. A forecast that is never checked against what happened cannot improve, and the comparison of projected and actual enrolment is one of the measures set out on the page on measuring an AI review's accuracy. Over a few cycles it tells a committee which sites keep their promises and how far to discount the ones that do not.
Questions people ask
How long will it take to enrol N patients?
Divide N by the number of patients the site enrols per month, where enrolled means past screening. If you only know screening numbers, multiply them by one minus the screen failure rate first. Use the site's history in comparable studies rather than the rate stated in the proposal.
What if the site has no history with the company?
Then the projection rests on weaker evidence, and the reviewer should say so. Public registry records of the site's past trials, its patient volumes and the investigator's earlier studies can stand in, and a conservative scenario, such as a second site from the start, protects the plan.
Does a slow forecast mean the concept should be declined?
Not usually. In the sample case the committee requested a full protocol with conditions, one of which was a second site or a justified smaller sample. The forecast turns a vague worry into a specific condition the investigator can meet.
How do milestone payments relate to enrolment?
Directly. The typical structure in the MAPS life-cycle guidance is four payments: at contract execution, at 50% enrolment, at 100% enrolment, and on the manuscript or final report, which carries the last 10 to 15% of the budget. A study that enrols at a third of its promised rate also draws its funding at a third of the planned pace, which is why finance as well as medical affairs needs the forecast.
Is the investigator told about the forecast?
The condition reaches the investigator in the decision letter, in plain words. The company's internal study records used to make the projection stay internal and are not named in the letter.