Medical affairs KPIs for an investigator-initiated studies (IIS) programme should count the evidence it buys, not the concepts it processes. The return on the programme is that evidence, per dollar and per reviewer hour: funded studies that enrol, report and answer a question the company's published research priorities ask. Medical affairs teams receive concepts from independent investigators who will sponsor and run the study themselves, while the company supplies drug, funding or both. A cross-functional committee decides which to support. The work is hard to value because its real costs sit outside the grants line, and no public benchmark exists to compare against. Botminds' Investigator-Initiated Study Review exists to make those costs visible: AI agents score each concept for priority fit, design, feasibility and overlap with existing studies, and build a cited packet for the people who decide.
So the ROI question is really four questions. How many funded studies duplicate work that was already under way? How many stall before they enrol? How long does each concept wait, and what does the wait cost? And how many medical director hours go into each decision? Count those, and "is the programme worth it" becomes "what does each answered question cost us".
What the public record says about the economics of investigator-initiated studies
25%
of 60 investigator-initiated oncology concepts approved by pharma sponsors; median 61 days to a decision
Gerber et al., 2025
18months
median from first submission to activation for the concepts that were approved
Gerber et al., 2025
26.5%
of investigator-sponsored trials stopped for poor recruitment, against 8.4% of industry-sponsored ones
Kasenda et al., 2014
0
fields in US Open Payments that mark a research payment as investigator-initiated
our query of 931,959 records, 2025
How to measure medical affairs value beyond activity counts
Measure what was bought, not what was handled: counts of concepts received, approved and funded measure throughput, not value. A programme can approve more concepts every year while funding duplicates, studies that never reach their sample size and studies that never report. The investigator-initiated sponsored research community has said so for years: the IISRA's metrics statement separates efficiency metrics such as "time from submission to review decision" from the value a programme should report, which it lists as publications, "data for potential future indications", supporting evidence for phase III design and expanded safety information (IISRA, 2011).
Nor can a head of medical affairs borrow a market figure for spend. US manufacturers reported $9.50 billion in research payments to Open Payments for 2025 (CMS), but most of that is company-sponsored trials, and our own query of the 931,959 research records found no field that identifies an investigator-initiated study. In the UK, R&D is 70% of disclosed transfers of value, £647.3 million in 2025 (ABPI, 2026), and under the EFPIA code it is disclosed only in aggregate. Every programme therefore has to build its own baseline. Approval rates do not travel either: in one oncology consortium the investigators' own peer review passed 88% of concepts, and the pharmaceutical sponsors then approved 25% of the same concepts (Gerber, 2025). A rate is a consequence of what arrives and who is judging it, not a measure of what was bought.
The upside is real, which is why the accounting matters. KEYNOTE-016, registered with Johns Hopkins as lead sponsor and Merck as collaborator (ClinicalTrials.gov NCT01876511), was one of five single-arm trials behind pembrolizumab's 2017 approval for MSI-high solid tumours, the first time the FDA approved a cancer treatment on a biomarker rather than the tumour's site of origin (FDA approval summary, 2019). Most IIS budgets fund nothing like that. The question for the programme owner is how much of the budget goes to studies that could, and how much leaks away before they start.
Four costs that never appear in the IIS budget
The hidden costs of an IIS programme are a funded duplicate, a study that stalls on enrolment, the time each concept waits, and the reviewer hours spent on concepts that should never have reached review. None appears as a budget line. All four can be counted.
The funded duplicate is the most expensive and the least visible. A concept that repeats a company phase 3b, another funded investigator study or a registered trial buys an answer that was coming anyway. It is also a compliance problem: the HHS Office of Inspector General lists research "that is unnecessarily duplicative" among the indicia of questionable research (OIG, 2003), and a Medical Affairs Professional Society presentation on running IIS programmes calls a "good tracking system necessary to identify overlap" (MAPS, 2018). How to run that check element by element is the subject of the overlap check.
"Indicia of questionable research include … research that is unnecessarily duplicative or is not needed by the manufacturer for any purpose other than the generation of business."
HHS-OIG Compliance Program Guidance for Pharmaceutical Manufacturers, 2003
The stalled study costs the payments made before it stopped, the drug shipped and the evidence it never produces. Investigator-sponsored trials were discontinued for poor recruitment at more than three times the rate of industry trials, and discontinued trials were more likely to stay unpublished, 55.1% against 33.6% (Kasenda, 2014). The usual cause is a forecast taken on trust; checking it against the site's own enrolment history is covered in the enrolment feasibility guide.
Waiting is a cost to the investigator, whose funding window and patient population do not wait, and to the company, whose question stays open. The pharma sponsors in Gerber's consortium took a median of 61 days to decide, and approved concepts took 18 months from first submission to activation. Concepts with shorter projected durations were more likely to be approved, which suggests sponsors already price time in, informally.
Reviewer time is the cost nobody books. The cross-functional committee the Medical Affairs Professional Society describes draws on medical affairs, clinical, regulatory, safety, legal and biostatistics, with clinical pharmacology and translational research joining as needed (MAPS, 2018). The scientific review itself is done by medical directors on top of a medical role. Every one of those hours is real, and each sits in another department's budget, uncounted.
A cost model you can fill in with your own numbers
Price each hidden cost as a count multiplied by a unit cost you already know, and leave the value of a day of waiting as your own judgement. The model below is deliberately blank where only your programme has the number. The illustrative fills come from a sample programme and from estimates, and are marked as such.
The hidden cost of an IIS programme, line by line
Two warnings about filling it in. First, do not import a cost of delay from drug development. A peer-reviewed Tufts Center study puts a day of delay at about $500,000 in lost prescription sales, averaged over 645 drugs launched since 2000, and the direct cost of a phase II or III trial at about $40,000 a day, from 409 trial budgets (Smith, DiMasi and Getz, Therapeutic Innovation & Regulatory Science, 2024). Both price a product's own development: the sales a marketed medicine forgoes, and the budget of a registration-stage trial. An IIS concept waiting for review is not a phase III programme waiting to file. Its delay rarely moves a launch date, and the study itself is sponsored and run by an outside investigator. Use your own figure, or leave the line in days and let the committee judge. Second, the stalled-study line depends on how you pay. Milestone payment, which a MAPS presentation describes as "typically 4 milestone payments", from contract execution through 50% and 100% enrolment to a final 10–15% on the manuscript or report, caps what a stalled study can cost (MAPS, 2018). A lump sum does not.
The bottom line of the model is the number worth reporting to a chief medical officer: total programme spend, hidden costs included, divided by the funded studies that actually report results. It falls when overlap is caught before funding, when infeasible studies are reshaped rather than approved as written, and when finished studies publish.
What KPIs should medical affairs track for an IIS programme?
Twelve, in four groups: three for speed, three for the quality of what is funded, three for compliance and three for the evidence that comes out. Each is a ratio or a duration that can be computed from timestamps and records the programme already keeps; none needs a survey.
The KPIs that show whether an IIS programme buys evidence
- Speed · Receipt to decision
Median and 90th-percentile days from a complete submission to the signed decision. The median hides the concepts that wait three cycles.
- Speed · Days by stage
Screening, scientific review, waiting for committee, letter. Shows whether the queue is the reviewers or the calendar.
- Speed · Approval to executed contract
Days from decision to signature. At 29 academic sites the median to full execution was 91 days, sponsor-initiated and investigator-initiated contracts together.
- Quality · Overlaps caught before committee
Concepts flagged as repeating a company, funded or registered study ÷ concepts reviewed. Track the misses too: duplicates found after funding.
- Quality · Decline and reshape reasons
Share by reason: duplicate, outside priorities, not feasible, budget above fair market value. Tells you what to publish to investigators.
- Quality · Enrolment against forecast
Actual patients a month ÷ forecast, per funded study, checked at the 50% enrolment milestone date.
- Compliance · Budgets above fair market value
Lines above the benchmark range at submission, and the share approved with a written reason. Should trend to zero unexplained.
- Compliance · Commercial-involvement flags
Concepts held for a sales or marketing link, and days to clear or hold. Zero flags in a year is a question, not a result.
- Compliance · Transparency completeness
Research payments reported with the study name ÷ payments made, as 42 CFR 403.904 requires in the US.
- Evidence · Priority coverage
Published research priorities with at least one funded or active study ÷ all priorities. The gaps are the agenda for the next cycle.
- Evidence · Results within a year
Funded studies with results posted within one year of primary completion ÷ studies due, the deadline in both 42 CFR 11.44 and EU CTR Article 37.
- Evidence · Cost per answered question
Total spend, hidden costs included ÷ funded studies that publish or post results. The single number for the business case.
The evidence measures are the ones most programmes do not keep, because the posting duty sits with the investigator-sponsor, not the company. The base rate is low. Only 40.9% of US trials due to report did so within the one-year deadline, and industry sponsors were 3.08 times as likely to comply as non-industry sponsors (DeVito et al., 2020). By our own count on ClinicalTrials.gov, completed phase 2–4 trials led by an academic sponsor with an industry collaborator posted results 54.9% of the time, against 68.5% for industry-led trials and 32.1% for academic trials with no industry collaborator (ClinicalTrials.gov API, 2015–2022 completions). And evidence takes time to arrive: across 691 trials in the IMPACT cohort, the median time to any publication was 4.07 years, and 26% reached a clinical guideline (Blümle et al., 2021). Report evidence KPIs on a rolling multi-year basis, or they will always look worse than the speed ones.
The quality measures need the most care, because they depend on how good your checks are. A programme that reports "no duplicates caught" may have none, or may not be looking. How to test an overlap finder's recall and a scorer's agreement with your committee is set out in measuring AI review accuracy.
Where the days go: receipt to decision, measured by stage
Measured by stage, the largest block of receipt-to-decision time is often waiting for the committee, not reviewing. That is why the stage split matters more than the total: a programme that only reports the median cannot tell whether to hire a reviewer or move the committee date.
Take a sample programme, a fictional mid-size company's fourth-quarter cycle, as it runs through Investigator-Initiated Study Review. The solution's design target is to cut the median from receipt to decision roughly in half, from an estimated 52 days by hand to 27. The split below shows where that saving is meant to come from.
Where the days go: Investigator-Initiated Study Review's target, by stage
- Screening6
- Scientific review18
- Waiting for committee21
- Letter7
- Screening2
- Scientific review9
- Waiting for committee14
- Letter2
- Sponsor decision (median, IQR 31–183)61
Read the lanes as a finance partner would. Screening falls because the agents read the concept form, budget sheet and cover email into a structured record and name what is missing, so the programme manager stops chasing. Scientific review falls because the medical director opens a packet already scored and searched, every finding linked to the passage it came from. Waiting for committee falls least, because the committee calendar does not move; it falls at all only because packets are ready before the docket closes. If your own stage split shows waiting as the largest block, the cheapest saving may be a rolling decision for low-risk concepts rather than any tool. The cycle itself is followed concept by concept in the one-cycle case study.
Evidence coverage: which research priorities your funded studies answer
Evidence coverage is the count, per published research priority, of company studies, funded investigator studies and concepts in the current cycle. It is the KPI that turns an IIS budget into a portfolio: it shows which priorities are crowded, which are covered and which have no study at all.
Evidence coverage in Investigator-Initiated Study Review: covered, crowded, open gap
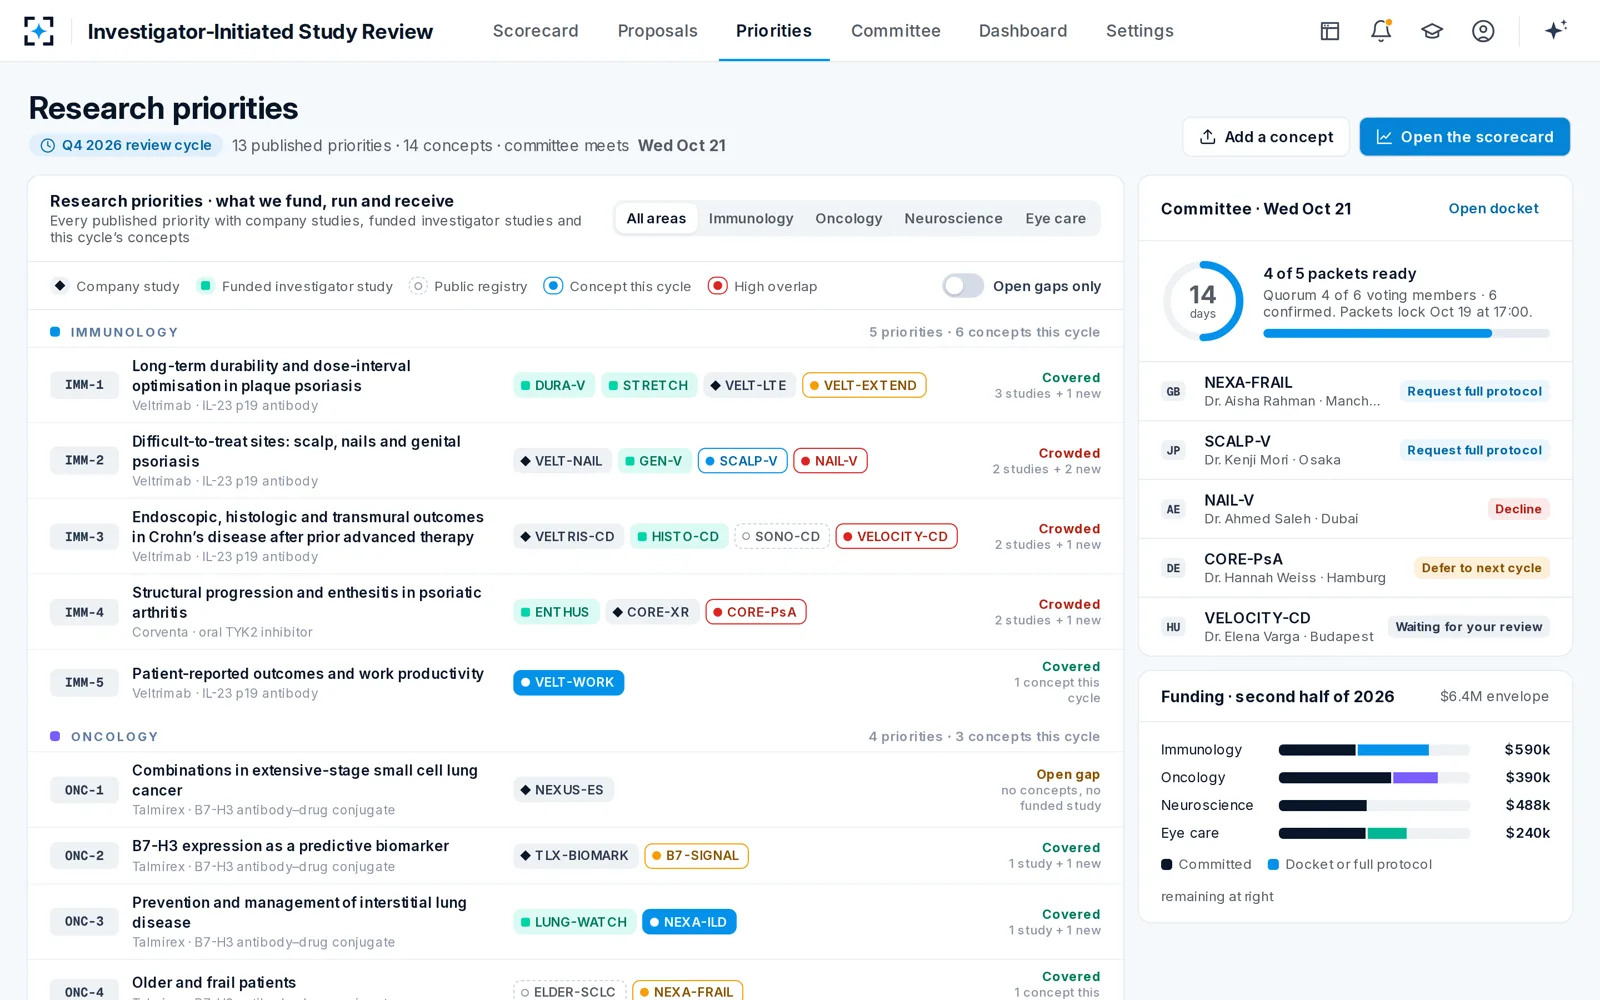
Look at the crowded rows: each has a concept marked high overlap. Crowding is where duplicate spend comes from; open gaps are where the budget is not reaching.
Coverage also tells the field team what to say. PhRMA's principles hold that companies "should not solicit research projects" from investigators, but "may publicly disclose the general areas or types of studies that it does or does not support" (PhRMA, 2014). An open gap is exactly such an area. Publishing it, and letting medical science liaisons share the published list in scientific exchange, is the compliant way to steer concepts toward unanswered questions. Measuring coverage each cycle shows whether that worked. Where the line between sharing an area and soliciting a study falls is covered in the compliance and fair market value guide.
What a programme dashboard should show, and what Investigator-Initiated Study Review reports
A programme dashboard for an IIS committee needs four panels: concepts received and decided over time, days by stage, the reasons concepts were declined or reshaped, and evidence coverage by priority. Investigator-Initiated Study Review builds these from the work itself: each concept's timestamps, the agents' findings, the reviewers' signed recommendations and the committee's decisions.
The raw material of the dashboard: every concept, its stage and its findings
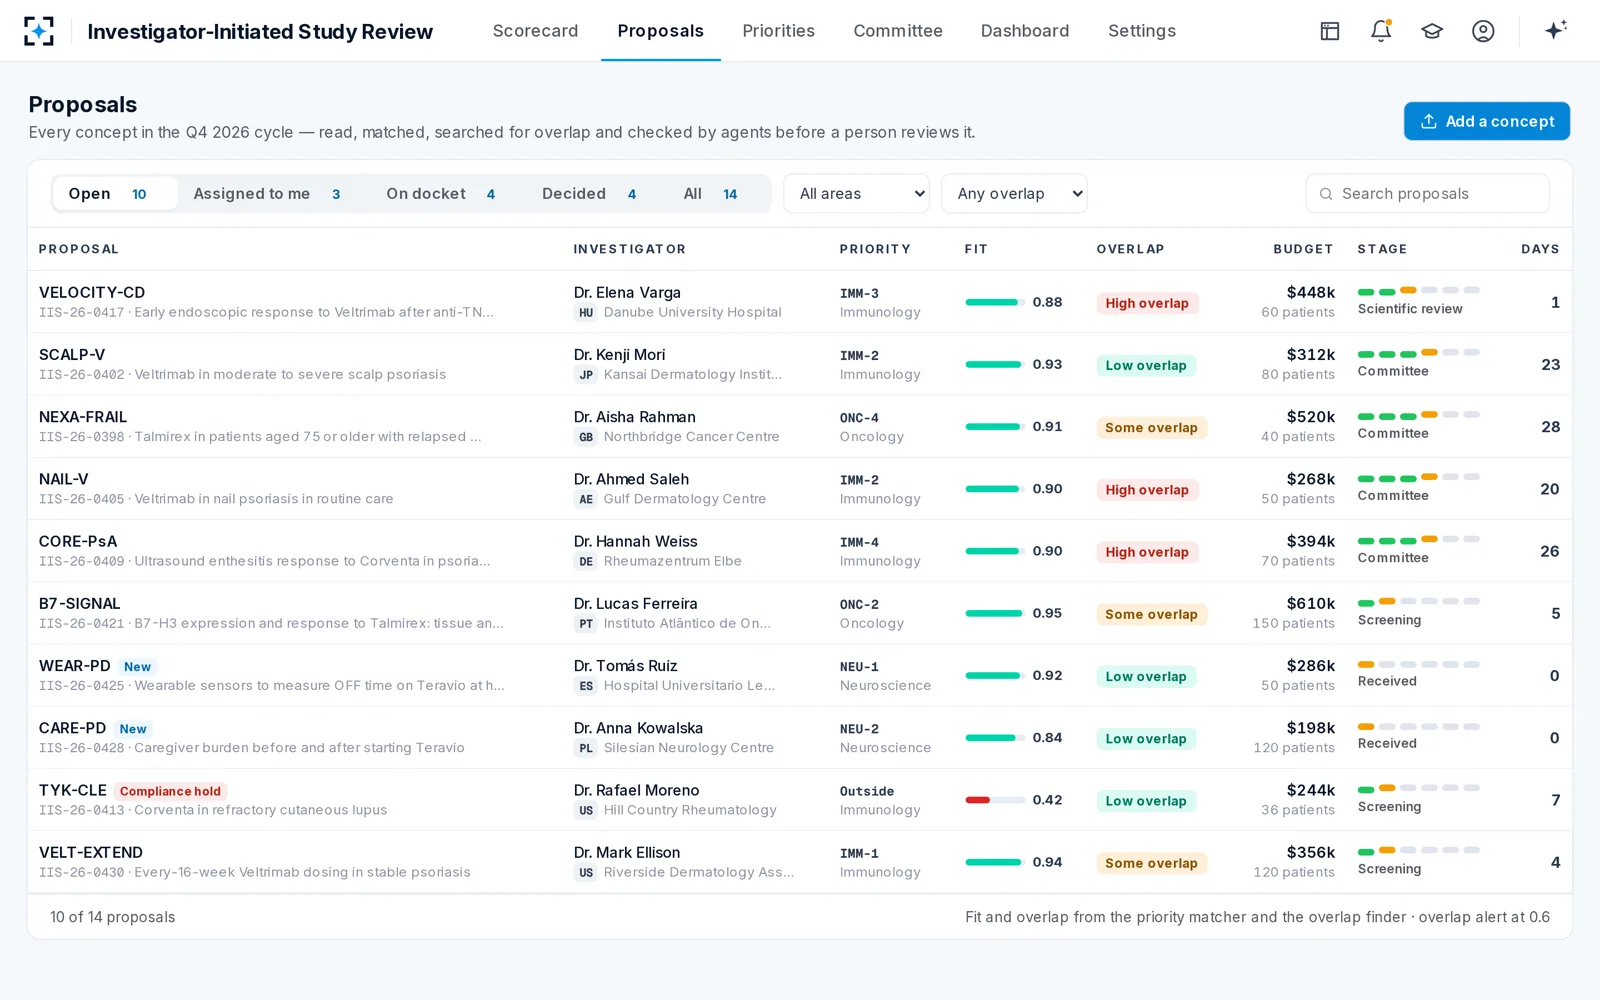
Read the Overlap column: three of the ten open concepts are marked high overlap.
The dashboard covers the speed and quality measures and evidence coverage up to the decision. The solution's journey ends when the letter is sent, at which point it updates the drug supply forecast and the transparency record. Enrolment against forecast, milestone payments and results posting happen after that, in the systems that manage contracts and studies, so the post-award KPIs in the list above still need their own source. A business case should say so rather than imply one screen answers every question.
Building the business case for IIS review software
A credible business case for IIS review software rests on your own baseline, the cost model above with your unit costs, and a measured comparison on a real cycle. Vendor percentages, including ours, are targets until your programme has measured them.
- Baseline from the last four cycles. Pull submission, decision and letter timestamps from the portal and the committee minutes. Compute the median, the 90th percentile and the stage split. Count decline reasons by hand once; it is usually a few dozen decisions.
- Count the duplicates you already funded. Take the last two or three years of approved concepts and search them against company and registered studies. Each match is a line in the funded-duplicate cost, and the most persuasive one in the case.
- Time one cycle of reviewer work. Ask each scientific reviewer to log hours per concept for one cycle. It is the unit cost every other line depends on.
- Run one cycle side by side. Let the agents score and search the next cycle's concepts while the committee works as usual, then compare rankings, overlaps found and the hours saved.
- Report cost per answered question each year. It moves slowly, which is why it should be agreed with finance at the start rather than discovered at renewal.
How long that side-by-side cycle takes to set up, and what the alternatives cost to run, is the subject of the go-live comparison. The design that makes each measure countable is on the Investigator-Initiated Study Review page.
Questions people ask
What is a good approval rate for an IIS programme?
There is no public benchmark. The best peer-reviewed figure, 25% of concepts approved by pharmaceutical sponsors in one thoracic oncology consortium, covers one therapy area and one group of investigators, and no large company publishes its own rate. Track decline reasons instead: a falling share of declines for duplication or for falling outside published priorities means investigators are being steered better.
How much does the industry spend on investigator-initiated studies?
Nobody can say from public data. US Open Payments reports $9.50 billion of research payments for 2025 but has no field that marks a study as investigator-initiated, and European codes disclose R&D only in aggregate. Your own programme's spend, measured against the evidence it produced, is the only number that means anything.
Should medical affairs use the Tufts cost of a day of delay for IIS?
No. The Tufts figures, about $500,000 a day in lost prescription sales and about $40,000 a day in direct costs for a phase II or III trial, price a product's own development, where a late day can move a launch. A concept waiting for IIS review rarely does. Keep waiting in days, or set an internal value per concept-day that your finance partner agrees with.
Should concepts sourced by medical science liaisons be a KPI?
Count them for context, but never set a target. PhRMA's principles say companies "should not solicit research projects, study descriptions, or protocols" from investigators, and a quota for MSL-sourced concepts rewards exactly that. The useful measure is the quality of what arrives, such as the share of concepts that fit a published priority and pass the compliance screen, not its volume.
Which single KPI should a head of medical affairs report?
Cost per answered question: total spend, hidden costs included, divided by funded studies that publish or post results. It moves only when the programme funds fewer duplicates, fewer infeasible studies and more studies that report, which are the three things an IIS budget should buy.