A good NAIC complaint index is one below 1.00, sustained over several years, on a book large enough that one or two complaints cannot move it much. The index divides a company's share of complaints in a line of insurance by its share of that line's business, measured by premium in the NAIC's reports and by policies in force in Texas's, so 1.00 is exactly average, 0.50 means half the expected complaints and 2.00 twice. The NAIC's market conduct handbook tells examiners to review a company's index and three years of complaint trends as part of the examination, and department analysts use it to pick which companies to look at. For a carrier, that makes the index a number to compute monthly from its own register, which Insurance Complaint Management, Botminds' complaint software, keeps by line, source and disposition.
"By contrast, the average complaint index will always be 1.00, regardless of the scale used for the underlying complaint ratios."
NAIC Market Regulation Handbook, 2017 edition, Chapter 4
What is a good NAIC complaint index?
Below 1.00, and stable. An index under 1.00 means a company drew fewer complaints than its share of the market would predict, and the NAIC's handbook (2017 edition) recommends basing the index on confirmed complaints, the ones the department found the company in the wrong on, because they are a better sign of company-specific problems. A company's index can also move without any change in its own conduct: the NAIC warns consumers that it "can vary not only due to fluctuations in the company's complaints or premiums but also due to fluctuations in the complaints or premiums of the U.S. market for the type of insurance being sold by the companies."
So "good" has three conditions. The index is below 1.00 in each line the company writes, not just overall. It stays there over the three years examiners may review. And the company's book in that line is large enough for the index to mean something: for a small writer, an index of 0 can simply mean no one happened to complain this year, and one complaint can turn it into 6.
How the complaint index is calculated
The index is the company's complaint share divided by its market share in the same line, state and period. The handbook defines it first as the company's complaint ratio over the market's, where a complaint ratio is confirmed complaints per thousand dollars of gross premium written, and notes that this is mathematically the same as complaint share over market share. Texas publishes the second form, using policies in force rather than premium.
The complaint index, term by term
Complaint share
Company’s complaints ÷ all companies’ complaints
Confirmed complaints in one line, one state or region, one period.
The department’s complaint data
Market share
Company’s business ÷ all companies’ business
Gross premium written in the NAIC’s reports; policies in force at 31 December in Texas’s.
Annual statement or policy counts
Complaint index
Complaint share ÷ market share
1.00 is average for every line by construction; below 1.00 is fewer complaints than expected.
Computed by the regulator; reproducible by the insurer
Because the index is a ratio of shares, it does not matter whether the complaint ratios behind it are expressed per dollar, per thousand dollars or per million: the handbook makes this point in a footnote. What does matter is that complaints and business are counted for the same set of policies. The handbook's own warning is that ratios and indexes "draw a misleading picture if the complaint count and the gross premium figure are based on different sets of policies".
The complaint index worked for one line
Take a fictional insurer writing private auto in Texas, set against the real 2025 market totals in TDI's index table. The market had 2,481 confirmed auto complaints and 15,057,105 auto policies in force at the end of 2025. The insurer has 300,000 policies and 70 confirmed complaints.
A fictional Texas auto insurer's index against the 2025 market: 1.42
Complaint share
70 ÷ 2,481 = 2.82%
Its confirmed auto complaints, out of every confirmed auto complaint in the state.
Market share
300,000 ÷ 15,057,105 = 1.99%
Its auto policies in force, out of every auto policy in force.
Complaint index
1.42
42% more confirmed complaints than its size predicts. To reach 1.00 it would need about 49 confirmed complaints, 21 fewer.
The same arithmetic shows how sensitive a mid-sized book is. Each confirmed complaint is worth about 0.02 of index for this insurer, so a run of a dozen confirmed complaints from one billing defect would move it by a quarter of a point. That is the practical reason to watch the index monthly: by the time the department's annual figure arrives, the defect has done its damage.
Complaint ratio or complaint index: the difference
A complaint ratio describes one company; a complaint index compares it with the market. The handbook defines the ratio as confirmed complaints divided by gross premium written in thousands of dollars, and says a typical ratio depends on the line and on prices in the market at the time, while the index averages 1.00 regardless. A ratio is useful for tracking one company against itself; an index is the fairer comparison between companies.
New York uses a ratio in its public rankings of health insurers. Its 2026 consumer guide divides complaints upheld by DFS by each company's premiums in millions of dollars. Across the HMOs in the guide, 307 upheld complaints against $6,805 million of premium give 0.0451; dividing any one HMO's ratio by that figure would give its index.
Why a small insurer's complaint index swings
Because the denominator is small, a single complaint is a large share of nothing. The handbook says it plainly: "Complaint indices can be misleading for companies with small market presence." It adds that published rankings should not include, without a conspicuous disclaimer, companies whose index would change significantly with one or two more or fewer confirmed complaints, and recounts a company once reported at an index above two million, on $1 of premium and one complaint.
What one confirmed complaint does to an index, by size of book (Texas auto, 2025 market)
Texas's 2025 auto table shows the effect across the market. Of the 55 auto insurers with exactly one confirmed complaint, 39 had an index above 2. Of the 425 companies with fewer than 10,000 auto policies, 354 had an index of 0 and 62 an index above 2; between them they held 2.3% of the state's auto policies.
What Texas's 2025 index table shows
Sorted by size, the table looks very different from a ranking of names. The 22 auto insurers with 100,000 policies or more held 87% of the policies; none had an index of 0, and only 2 were above 2. The two largest, with about half the state's auto policies between them, had indexes of 0.30 and 0.66.
Texas auto, 2025: complaint indexes by size of book
| Policies in force | Companies | Share of all policies | Index 0 | 0 to 1.00 | Above 1.00 to 2.00 | Above 2.00 |
|---|---|---|---|---|---|---|
| Under 10,000 | 425 | 2.3% | 354 | 4 | 5 | 62 |
| 10,000 to 99,999 | 46 | 10.4% | 7 | 23 | 8 | 8 |
| 100,000 to 999,999 | 20 | 38.5% | 0 | 6 | 12 | 2 |
| 1,000,000 or more | 2 | 48.8% | 0 | 2 | 0 | 0 |
Two lessons follow. For a large carrier the index is a stable, meaningful signal, and 12 of the 20 mid-to-large auto writers sat between 1.00 and 2.00, so "above average" is common and not by itself alarming. For a small one, the index is noise unless it is read over several years or alongside the raw count. Homeowners shows the same pattern: 137 of 230 companies had an index of 0, and the companies above 1.00 held 51% of the state's homeowners policies.
Why examiners pull the complaint index first
Because it is the cheapest available signal of where to look. The handbook (2017 edition) tells examiners reviewing complaint handling to check the NAIC Complaints Database System for the company's complaint index and adverse trends in complaint volume, and suggests reviewing the index and trends for the preceding three years. In market analysis, departments are told to review complaint ratios annually and look at companies outside the norm, and analysts can sort NAIC reports by the national confirmed complaint index to find outliers.
That makes the index the first number in a chain. A high index invites analysis; analysis can lead to an inquiry or an examination. The NAIC's AI model bulletin describes market conduct actions as "separate from, but may result from, individual complaints made by consumers asserting illegal practices by Insurers." A carrier that knows its index, and the causes behind it, before the department's annual report is in a different conversation from one that learns it from the call letter.
Premium or policies: which denominator to use
Use the regulator's: premium for the NAIC's reports, policies in force for Texas's, and both internally. The handbook explains why premium can mislead. If the average policy in one state costs half what it costs in a neighbouring state, the same level of complaint activity produces complaint ratios twice as high. It recommends that states consider a policy-count index for life insurance and annuities, where premium is a poor measure of activity.
For a carrier, computing both is cheap and informative. A gap between a premium-based and a policy-based index usually means the company's complaints sit in a part of the book with unusually low or high premiums, such as minimum-limits auto or high-value homes.
How to compute your own complaint index every month
Use the department's definition, the department's denominator and your own register, and compute it by line and state every month. The register gives the numerator only if it records the department's confirmed finding for each department complaint; the market totals come from the department's published data, such as Texas's, or from the latest annual figures.
Six steps to a monthly complaint index that matches the regulator's
- Record the department’s finding on every department complaint
Confirmed or not, as the department reports it; the index counts confirmed complaints.
- Count by line and state, never in total
The NAIC computes indexes by line, and Texas by line of coverage.
- Use the regulator’s denominator
Premium for NAIC-style indexes; policies in force at year end for Texas.
- Hold the market totals from the latest published year
Your index moves when the market’s complaints move, as the NAIC warns.
- Compute a rolling twelve months, and read three years
The examiner’s window is three years; a single month is noise.
- Attach the causes
An index that rose by a quarter of a point should come with the confirmed causes behind it.
Insurance Complaint Management and the index’s numerator
The solution keeps the numerator honest. Every department complaint is logged with its line, source and state as it arrives, and its disposition and outcome as it closes, so a monthly count of department complaints by line is a filter, not a project. The root cause finder adds what the index lacks: the reason it moved. In the solution's fictional sample, March's report showed 187 complaints, 41 through insurance departments, none answered late, and named the billing defect behind five of them.
Insurance Complaint Management’s report: causes ranked against last month
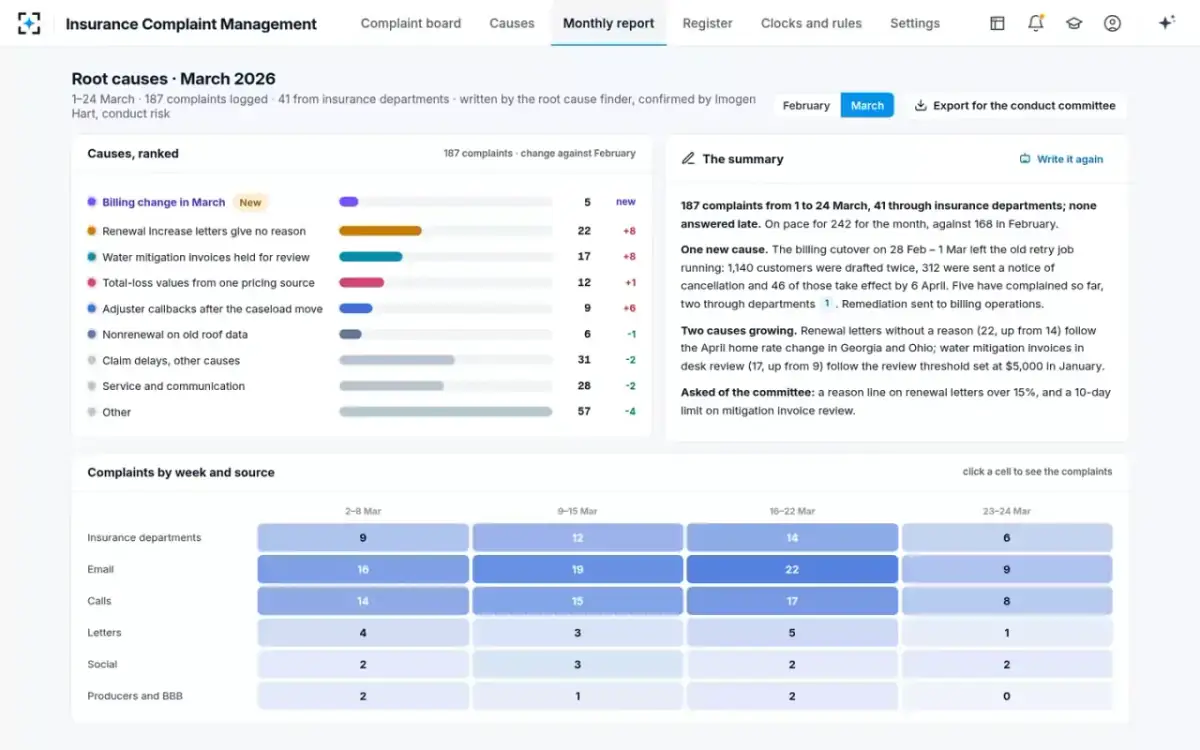
The solution does not compute the regulator's index for you: market totals are the department's, and the confirmed finding is the department's call. What it provides is the half of the calculation a carrier controls, complete and current, with the reasons attached. How the register itself must be kept is in complaint register requirements for an insurance company, and the public data the market totals come from in insurance complaints statistics by state.
Questions people ask
What does the NAIC complaint index mean?
It compares a company's share of complaints with its share of the market in a line of insurance. An index of 1.00 is average, 0.50 means half the complaints its size predicts and 2.00 means twice as many.
What is the NAIC complaint ratio?
The handbook defines a complaint ratio as confirmed complaints divided by gross premium written in thousands of dollars, for one line, state and period. Dividing a company's ratio by the market's gives its complaint index.
Is a complaint index of 0 good?
For a large company, yes. For a small one it may only mean no one complained that year: in Texas auto in 2025, 354 of the 425 companies with fewer than 10,000 policies had an index of 0.
What is the TDI complaint index?
Texas's version, published as open data: the company's percentage of confirmed complaints in a line divided by its percentage of policies in force in that line. TDI states that the average is 1.00 and that a number below 1 means fewer complaints than average.
Where can I look up an insurer's complaint index?
The NAIC's Consumer Insurance Search shows closed, confirmed complaint information by state, company and type of insurance for the past three years. Texas publishes its indexes by company and line on the state's open data portal.